Abstract
The annexins are a family of Ca2+- and phospholipid-binding proteins, which interact with membranes upon increase of [Ca2+]i or during cytoplasmic acidification. The transient nature of the membrane binding of annexins complicates the study of their influence on intracellular processes. To address the function of annexins at the plasma membrane (PM), we fused fluorescent protein-tagged annexins A6, A1, and A2 with H- and K-Ras membrane anchors. Stable PM localization of membrane-anchored annexin A6 significantly decreased the store-operated Ca2+ entry (SOCE), but did not influence the rates of Ca2+ extrusion. This attenuation was specific for annexin A6 because PM-anchored annexins A1 and A2 did not alter SOCE. Membrane association of annexin A6 was necessary for a measurable decrease of SOCE, because cytoplasmic annexin A6 had no effect on Ca2+ entry as long as [Ca2+]i was below the threshold of annexin A6-membrane translocation. However, when [Ca2+]i reached the levels necessary for the Ca2+-dependent PM association of ectopically expressed wild-type annexin A6, SOCE was also inhibited. Conversely, knockdown of the endogenous annexin A6 in HEK293 cells resulted in an elevated Ca2+ entry. Constitutive PM localization of annexin A6 caused a rearrangement and accumulation of F-actin at the PM, indicating a stabilized cortical cytoskeleton. Consistent with these findings, disruption of the actin cytoskeleton using latrunculin A abolished the inhibitory effect of PM-anchored annexin A6 on SOCE. In agreement with the inhibitory effect of annexin A6 on SOCE, constitutive PM localization of annexin A6 inhibited cell proliferation. Taken together, our results implicate annexin A6 in the actin-dependent regulation of Ca2+ entry, with consequences for the rates of cell proliferation.
Calcium entry into cells either through voltage- or receptor-operated channels, or following the depletion of intracellular stores is a major factor in maintaining intracellular Ca2+ homeostasis. Resting [Ca2+]i is low (∼100 nm compared with extracellular [Ca2+]ex of 1.2 mm) and can be rapidly increased by inositol triphosphate-mediated release from the intracellular Ca2+ stores (mostly endoplasmic reticulum (ER)3), or by channel-mediated influx across the plasma membrane (PM). Store-operated calcium entry (SOCE) has been proposed as the main process controlling Ca2+ entry in non-excitable cells (1), and the recent discovery of Orai1 and STIM provided the missing link between the Ca2+-release activated current (ICRAC) and the ER Ca2+ sensor (2–4). Translocation of STIM within the ER, accumulation in punctae at the sites of contact with PM and activation of Ca2+ channels have been proposed as a model of its regulation of Orai1 activity (5, 6). However, many details of the functional STIM-Orai1 protein complex and its regulation remain to be elucidated. The actin cytoskeleton plays a major role in the regulation of SOCE, possibly by influencing the function of ion channels or by interfering with the interaction between STIM and Orai1 (7–9). However, the proteins connecting the actin cytoskeleton and SOCE activity at the PM have yet to be identified.
The annexins are a multigene family of Ca2+- and phospholipid-binding proteins, which have been implicated in many Ca2+-regulated processes. Their C-terminal core is evolutionarily conserved and contains Ca2+-binding sites, their N-terminal tails are unique and enable the protein to interact with distinct cytoplasmic partners. At low [Ca2+]i, annexins are diffusely distributed throughout the cytosol, however, after stimulation resulting in the increase of [Ca2+]i, annexins are targeted to distinct subcellular membrane locations, such as the PM, endosomes, or secretory vesicles (10). Annexins are involved in the processes of vesicle trafficking, cell division, apoptosis, calcium signaling, and growth regulation (11), and frequent changes in expression levels of annexins are observed in disease (12, 13). Previously, using biochemical methods and imaging of fluorescent protein-tagged annexins in live cells, we demonstrated that annexins A1, A2, A4, and A6 interacted with the PM as well as with internal membrane systems in a highly coordinated manner (10, 14). In addition, there is evidence of Ca2+-independent membrane association of several annexins, including annexin A6 (15–19); some of which point to the existence of pH-dependent binding mechanisms (20–22). Given the fact that several annexins are present within any one cell, it is likely that they form a [Ca2+] and pH sensing system, with a regulatory influence on other signaling pathways.
The role of annexins as regulators of ion channel activity has been addressed previously (23–25). In particular, annexin A6 has been implicated in regulation of the sarcoplasmic reticulum ryanodine-sensitive Ca2+ channel (25), the neuronal K+ and Ca2+ channels (26), and the cardiac Na+/Ca2+ exchanger (27). Cardiac-specific overexpression of annexin A6 resulted in lower basal [Ca2+], a depression of [Ca2+]i transients and impaired cardiomyocyte contractility (28). In contrast, the cardiomyocytes from the annexin A6 null-mutant mice showed increased contractility and accelerated Ca2+ clearance (29). Consistent with its role in mediating the intracellular Ca2+ signals, especially Ca2+ influx, ectopic overexpression of annexin A6 in A431 cells, which lack endogenous annexin A6, resulted in inhibition of EGF-dependent Ca2+ entry (30).
The difficulty of investigating the influence of annexins on signaling events occurring at the PM lies in the transient and reversible nature of their Ca2+ and pH-dependent lipid binding. Although the intracellular Ca2+ increase following receptor activation or Ca2+ influx promotes the association of the Ca2+-sensitive annexins A2 and A6 with the PM, the proteins quickly resume their cytoplasmic localization upon restoration of the basal [Ca2+]i (14). Therefore, to investigate the effects of membrane-associated annexins on Ca2+ homeostasis and the cell signaling machinery, we aimed to develop a model system allowing for a constitutive membrane association of annexins. Here we used the PM-anchoring sequences of the H- and K-Ras proteins to target annexins A6 and A1 to the PM independently of [Ca2+]. The Ras GTPases are resident at the inner leaflet of the PM and function as molecular switches (31). The C-terminal 9 amino acids of H- and N-Ras and the C-terminal 14 amino acids of K-Ras comprise the signal sequences for membrane anchoring of Ras isoforms (32). Although the palmitoylation and farnesylation of the C terminus of H-Ras (tH) serves as a targeting signal for predominantly cholesterol-rich membrane microdomains at the PM (lipid rafts/caveolae) (33), the polybasic group and the lipid anchor of K-Ras (tK) ensures the association of K-Ras with cholesterol-poor PM membrane domains. Importantly, these minimal C-terminal amino acid sequences are sufficient to target heterologous proteins, for example GFP, to different microdomains at the PM and influence their trafficking (34).
In the present study we fused annexins A6, A2, and A1 with fluorescent proteins and introduced the PM-anchoring sequences of either H-Ras (annexin-tH) or K-Ras (annexin-tK) at the C termini of the fusion constructs. We demonstrate that the constitutive PM localization of annexin A6 results in down-regulation of store-operated Ca2+ entry. Expression of membrane-anchored annexin A6 causes an accumulation of the cortical F-actin, and cytoskeletal destabilization with latrunculin A abolishes the inhibitory effect of PM-anchored annexin A6 on SOCE. Taken together, our results implicate annexin A6 in the maintenance of intracellular Ca2+ homeostasis via actin-dependent regulation of Ca2+ entry.
EXPERIMENTAL PROCEDURES
Reagents and Antibodies
Monoclonal antibodies against annexins were purchased from BD Transduction (Lexington, KY) and Santa Cruz Biotechnology (Santa Cruz, CA). The anti-GFP monoclonal antibody (JL-8) was from Clontech. Chemicals and purified bovine calmodulin were from Sigma. Restriction endonucleases, Taq polymerase, and T4 DNA ligase were purchased from New England Biolabs. Fluo-3/AM and jasplakinolide were from Molecular Probes, Inc. Latrunculin A was from Calbiochem.
Expression of Annexins as Fusions with Fluorescent Proteins and Ras PM Anchor
The pC1-based GFP-tH and GFP-tK plasmids were a kind gift from Dr. J. Hancock (IMB, University of Queensland, Brisbane, Australia). These vectors were modified to replace GFP with the fluorescent proteins of choice (YFP or mCherry) and allow insertion of annexin sequences upstream of the fluorescent proteins' coding sequences. For this purpose, the coding sequences of YFP and mCherry proteins were amplified by PCR using the forward primer, 5′-ATAAAGCTAGCAAGCTTCTCGAGCGAGATCTCACCATGGTGAGCAAGGGCGAGGAG-3′, corresponding to the fluorescent protein cDNA and containing NheI, HindIII, XhoI, and BglII cloning sites (underlined); the reverse primer, 5′-ATAAAGAATTCGACTTGTACAGCTCGTCCATGCCG-3′, containing the EcoRI cloning site. The PCR products were ligated with a larger fragment of the NheI-EcoRI-digested GFP-tH or GFP-tH vectors, resulting in the replacement of the GFP coding sequence and introduction of unique cloning sites for insertion of annexins. Annexins A1 and A6 were cloned into pYFP-tH, -tK, pmCherry-tH and-tK, and pN1-mCherry (Clontech) as described previously (20). Annexin A6-GFP-tK protein was created by cloning annexin A6 coding sequence into the NheI site located upstream of the GFP sequence of the original pC1-GFP-tK vector. The pEYFP-β-actin expression vector was from Clontech.
Cell Culture and Transfections
HEK293 were maintained in Dulbecco's modified Eagle's medium containing 2 mm glutamine, 100 units of penicillin/ml, 100 μg of streptomycin/ml, 10% fetal calf serum. All cells were grown in 5% CO2 at 37 °C in a humidified incubator. HEK293 cells were transiently transfected with plasmids using electroporation (Bio-Rad) and analyzed after incubating at 37 °C for 48 h. Stable HEK293 cell lines expressing annexins A6YFP-tH, A6YFP-tH, and mCherry-tH were established using G-418 selection following the standard procedures. For cell proliferation analysis, cells were plated at equal density, harvested by trypsinization at selected time points, and counted following trypan blue extraction.
RNA Interference Knockdown of Annexin A6 Expression
Annexin A6 knockdown experiments in HEK293 cells were performed with shRNA targeting human annexin A6 (clone 1 (Pos. 322–372): 5′-GCAAGGACCTCATT GCTGATT-3′ and clone 2 (Pos. 2010–2030): 5′-ATGGTATCCC GCAGTGAGATT-3′) cloned into SureSilencing shRNA plasmids (SABiosciences). Cells were transfected with shRNA using electroporation and examined 48 h post-transfection. Levels of annexin A6 were assessed by Western blotting and immunofluorescence.
Live Cell Imaging and Intracellular Calcium Measurements
Live cell imaging and calcium imaging recordings were performed as described (14). Cells were observed under an Axiovert 200M microscope with laser scanning module LSM 510 META (Zeiss) using a ×63 or a ×100 oil immersion lens. Images were acquired at a scanning speed of 2 s, with 1-s intervals between frames. Images of the Fluo-3/AM-loaded cells were recorded and analyzed using the “Physiology Evaluation” software package (Zeiss).
Isolation of HEK293 Membranes; SDS-PAGE and Western Blotting Analysis
Unless otherwise stated, all procedures were performed at 4 °C or on ice. Membrane preparation from HEK293 cells was performed using a detergent-free protocol (35), and Triton X-100 extraction of post-nuclear cell lysates followed by sucrose gradient centrifugation was done as described (36). Membrane-bound annexins were separated from the unbound proteins by low speed centrifugation (20 min, 12,000 rpm at 4 °C). The membrane-bound proteins in the pellet and the soluble proteins in the supernatant were analyzed by SDS-PAGE followed by Western blotting with anti-annexin antibodies. Image analysis to estimate the protein content of the individual bands following SDS-PAGE and Western blotting was performed using PowerLook 1120 scanner and ImageQuant TL (v2003) software from Amersham Biosciences Europe GmbH.
Ca2+-ATPase Activity Assay
The enzymatic activity of plasma membrane Ca2+-ATPase (PMCA) was determined essentially as described (37). In brief, gradient-purified membranes (10 μg of protein) were incubated in an assay system containing, in a final volume of 200 μl, 25 mm Tris-HCl, pH 7.4, 50 mm KCl, 1 mm MgCl2, 200 μm EGTA, and CaCl2 to give 10 μm free Ca2+, determined using MaxChelator software. The reaction mixture was supplemented with 100 nm thapsigargin to inhibit sarco-endoplasmic reticulum Ca2+-ATPase (SERCA). Where specified, 2 μg (80 units) of purified bovine calmodulin were added. After 5-min preincubation at 37 °C, reaction was started by addition of 1 mm ATP, continued for 30 min, and stopped by addition of 500 μl of staining solution containing 14 mg/ml ascorbic acid, 0.3% ammonium molybdate, and 0.35 n H2SO4. After 20 min at room temperature, A820 was determined by spectrophotometry (DU 530, Beckman Coulter). The data were expressed as arbitrary units (optical density per μg of protein × 10).
Statistical Analysis
Statistically significant differences were determined with a Mann-Whitney U test with an α set to 0.05 for values not displaying a normal distribution, and with a two-tailed Student t test, preceded by a Levene test, with an α set to 0.05 for values with a normal distribution. Normality studies were done with Kolmogorov-Smirnov and Shapiro-Wilk tests (p < 0.05). All the studies were carried out with the SPSS program (version 15.0).
RESULTS
H- and K-Ras Membrane Anchor Sequences Ca2+-independently Target Annexin A6 to the PM
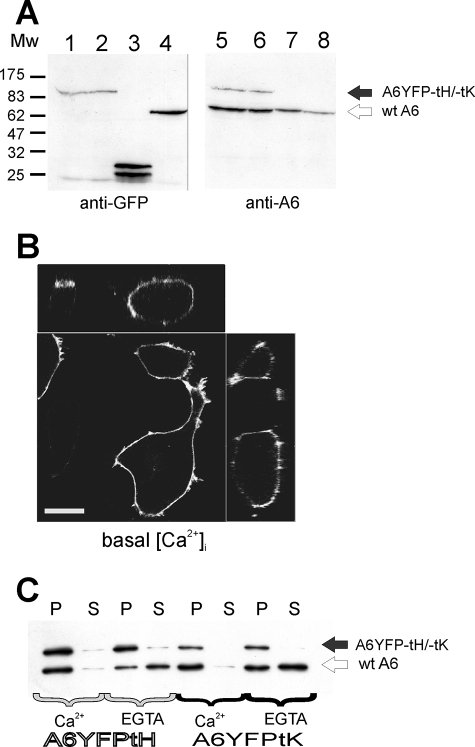
We fused the coding sequences of annexin A6 to the fluorescent proteins (GFP or YFP) and the minimal PM targeting sequences of H- and K-Ras, and expressed the resulting proteins following transient transfection of HEK293 cells. The chimeric proteins had an approximate molecular mass of 95 kDa, and were detected by Western blotting with both anti-GFP and anti-annexin A6 antibodies (Fig. 1A). The proteins constitutively localized to the PM of transfected cells under resting conditions (basal [Ca2+]i, Fig. 1B for A6GFP-tK), with some additional Golgi labeling of A6YFP-tH (not shown). We then studied the effects of [Ca2+] on the PM association of A6YFP-tK and -tH proteins. Membrane association of the tK- and tH-tagged annexin A6 was compared with that of endogenous annexin A6 following low speed centrifugation in presence of either 0.2 mm Ca2+, or 1 mm EGTA (Fig. 1C). Endogenous annexin A6 detached from the membranes in the presence of EGTA and was detected in the soluble fraction, whereas both tK- and tH-tagged annexin A6 fusion proteins remained PM-associated, indicating that the Ras membrane anchors were sufficient for Ca2+-independent binding.
FIGURE 1.
H- and K-Ras anchors target annexin A6 to the PM independent of Ca2+. A, annexin A6YFP-tH, annexin A6YFP-tK, GFP-tK, and annexin A1YFP were expressed in HEK293 cells. 48 h post-transfection the cells were collected, lysed, and analyzed by SDS-PAGE followed by Western blotting with monoclonal antibodies against GFP or human annexin A6. Lanes 1 and 5 show A6YFP-tH, lanes 2 and 6 A6YFP-tK, lanes 3 and 7 GFP-tK, and lanes 4 and 8 annexin A1YFP. The positions of endogenous annexin A6 (wt A6) and A6-fusions are indicated by arrows. B, live HEK 293 cells expressing annexin A6GFP-tK were examined at the confocal microscope under resting conditions (low basal [Ca2+]i). Cells are shown in orthogonal projection, bar = 5 μm. C, membranes from HEK293 cells expressing annexin A6YFP-tH, or annexin A6YFP-tK, were isolated in the presence of 0.2 mm Ca2+. The purified membranes were resuspended in Na+-Tyrode buffer containing 0.2 mm Ca2+, or 1 mm EGTA, as indicated. Membrane-bound annexins were separated from the unbound proteins by centrifugation (20 min, 12,000 rpm at 4 °C). The membrane-bound proteins in the pellet (P) and the soluble proteins in the supernatant (S) were analyzed by SDS-PAGE followed by Western blotting with monoclonal antibodies against annexin A6. Position of endogenous annexin A6 and A6YFP-tH and -tK fusions is indicated by arrows.
We then analyzed whether the annexin A6 fusion proteins retained the properties of endogenous annexin A6 by disrupting the Ras tag-mediated membrane anchoring using 0.5% Triton X-100 extraction (33) (supplemental Fig. S1). Membranes prepared from a mixture of A6YFP-tH- and GFP-tH-expressing HEK293 cells were extracted with 0.5% Triton X-100 in the presence of 0.2 mm Ca2+, and the distributions of A6YFP-tH, GFP-tH, endogenous annexin A6, and RhoA in sucrose gradient fractions were analyzed by Western blotting. Under these conditions, endogenous H- and K-Ras are found in soluble fractions (33), and consistent with these findings, most of the GFP-tH was extracted with Triton X-100 and found in high density gradient fractions (fractions 5–8), similar to RhoA (supplemental Fig. S1, A and B). Endogenous annexin A6 was associated predominantly with low density fractions (fractions 3 and 4) in the presence of Ca2+ (supplemental Fig. S1B). Importantly, Ras-tagged A6YFP-tH displayed the same distribution as endogenous annexin A6 within the gradient and was found almost exclusively in fractions 3–5 in the presence of Ca2+ (supplemental Fig. S1, A and B). Similar results were obtained when using a mixture of A6YFP-tK and GFP-tK membranes (supplemental Fig. S1C). These data strongly suggest that Triton X-100 extraction disrupts the membrane association of Ras-anchored annexin A6 and annexin A6 fusion proteins then behave like endogenous annexin A6 in their ability to interact with membranes in a Ca2+-dependent manner.
PM-targeted Annexin A6 Attenuates Store-operated Ca2+ Entry
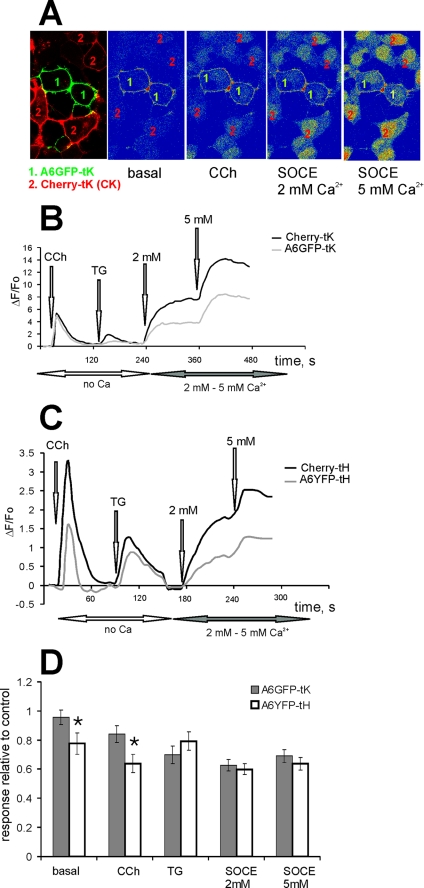
Earlier observations implicated annexin A6 in the regulation of intracellular Ca2+ homeostasis (28–30), therefore we examined whether its constitutive association with the PM had an effect on Ca2+ transients or Ca2+ entry into the cells. In all experiments, cells expressing mCherry protein, tagged to the PM with tH or tK membrane anchors served as a control for the nonspecific effects of transfection on cellular Ca2+ responses. Both mCherry-tK and A6GFP-tK-expressing cells were co-cultured on the same coverslip and loaded with Fluo-3/AM, and Ca2+ responses were recorded simultaneously (Fig. 2A). Fig. 2B shows the result from a representative experiment. The intracellular Ca2+ release was examined by applying 10 μm CCh in Ca2+-free Na+-Tyrode buffer. Both A6GFP-tK and mCherry-tK cells produced a similar Ca2+ transient, indicating no differences in the filling of intracellular Ca2+ stores. When the SOCE was stimulated by addition of 1 μm thapsigargin (TG) followed by 2 mm or 5 mm [Ca2+]ex, an attenuation of Ca2+ entry was observed in the cells expressing A6GFP-tK (Fig. 2B). Statistical evaluation of data from five independent experiments (n = 22 recordings), showed that the SOCE in A6GFP-tK-expressing cells was on average 60% of the control (p < 0.05) (Fig. 2D).
FIGURE 2.
PM-associated annexin A6 reduces store-operated Ca2+ entry. A, HEK293 cells expressing annexin A6GFP-tK or mCherry-tK were co-cultured on the same coverslip, loaded with Fluo-3/AM, and examined at the confocal microscope. An arbitrary field containing both cell types was selected, and changes in [Ca2+]i upon stimulation of intracellular Ca2+ release and store-operated Ca2+ entry examined, selecting an intracellular regions of interest to avoid the contribution of PM-associated GFP signal to Fluo-3 fluorescence changes observed in A6GFP-tK cells. B, cells were kept in Ca2+-free Tyrode buffer, stimulated with 10 μm CCh, followed by SERCA inhibition with 1 μm TG. SOCE was stimulated by adding 2 mm and 5 mm [Ca2+]ex, and responses in mCherry-tK-expressing cells (control, black line) were compared with annexin A6GFP-tK cells (gray line). C, shows a similar experiment as in B, performed with annexin A6YFP-tH and mCherry-tH cells. D, basal [Ca2+]i levels, CCh- and TG-stimulated ER release, and Ca2+ entry in tH- and tK-tagged annexin A6 cells were expressed relative to the responses of the control, Ras-tagged mCherry cells. The graph shows an average of five independent experiments (n = 22 recordings) ± S.E. The SOCE reduction to ∼60% of control levels shown in both annexin A6 constructs was statistically significant (p < 0.01). There was also a statistically significant (*, p < 0.05) reduction of basal [Ca2+]i and in the amplitude of CCh-induced Ca2+ release in A6YFP-tH cells compared with A6YFP-tK cells.
Given the different subcellular microlocalization of the tH- and tK membrane anchors (32), we next analyzed the effects of annexin A6, tagged with tH, on SOCE, using the same experimental set-up as described above for A6GFP-tK, with mCherry-tH serving as a control (Fig. 2C). The average of five experiments and a comparison of the effects of A6GFP-tK and A6YFP-tH on SOCE (Fig. 2D) demonstrates that, in addition to the attenuation of SOCE, observed both in A6GFP-tK- and A6YFP-tH-expressing cells (60% of control), there was a statistically significant (p < 0.05) reduction of basal [Ca2+]i, and the amplitude of CCh-mediated transient in A6YFP-tH cells, compared with cells expressing tK-tagged A6 (Fig. 2D).
Previously annexin A6 has been implicated in the regulation of EGF-stimulated Ca2+ entry into A431 cells (30). We performed similar experiments using A6YFP-tH- and mCherry-tH-transfected A431 cells and identified a down-regulation of EGF-stimulated Ca2+ entry (supplemental Fig. S2). Taken together, these results indicate that the constitutive PM association of annexin A6 caused a decrease of Ca2+ entry.
PM Localization of Annexin A6 Is Necessary for SOCE Attenuation
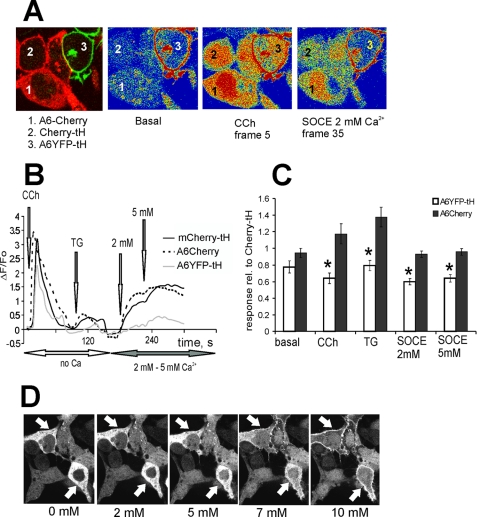
To asses the effects of cytoplasmic versus PM-targeted annexin A6 on SOCE, we co-cultured HEK293 cells, expressing cytoplasmic annexin A6 fused with mCherry (A6-mCherry), A6YFP-tH, and mCherry-tH (Fig. 3A), and treated them with CCh, followed by SOCE stimulation at 2 and 5 mm Ca2+ (Fig. 3B). In the control experiment, at these [Ca2+]ex levels untagged A6-mCherry remained in the cytoplasm (Fig. 3D). There was no significant difference in basal [Ca2+]i, the amplitude of CCh-induced intracellular Ca2+ release, or SOCE between the cells expressing mCherry-tH (control) and cytoplasmic A6-mCherry, whereas both the store contents and SOCE were decreased in A6YFP-tH-expressing cells (Fig. 3B for a representative recording, Fig. 3C for the average of n = 9 recordings). These results indicate that a PM association of annexin A6 was required to elicit a distinct effect on the amplitude of SOCE.
FIGURE 3.
A constitutive PM localization of annexin A6 is necessary for SOCE attenuation. A, HEK293 cells expressing annexin A6YFP-tH, wild-type cytoplasmic annexin A6-mCherry or mCherry-tH were co-cultured on the same coverslip, loaded with Fluo-3/AM, and examined in the confocal microscope. An arbitrary field containing all three cell types was selected, and changes in [Ca2+]i upon stimulation of intracellular Ca2+ release and store-operated Ca2+ entry examined by calcium imaging, selecting intracellular regions of interests to avoid the contribution of the YFP signal into Fluo-3 fluorescence changes observed in A6YFP-tH cells. B, cells were kept in Ca2+-free Tyrode buffer, stimulated with 10 μm CCh, followed by SERCA inhibition with 1 μm TG. SOCE was stimulated by adding 2 mm and 5 mm [Ca2+]ex, and responses in mCherry-tH-expressing cells (control, solid black line) were compared with annexin A6YFP-tK cells (gray line) and A6-mCherry (dotted black line). C, basal [Ca2+]i levels, CCh- and TG-stimulated ER release and Ca2+ entry in annexin A6-mCherry, and A6YFP-tH cells were expressed relative to responses of the control, mCherry-tH cells. The graph shows an average of three independent experiments (n = 9 arbitrary fields measured) ± S.E. SOCE was reduced to ∼60% of control levels in annexin A6YFP-tH construct (*, p < 0.05), but there was no statistically significant difference between the responses recorded in A6-mCherry cells and control, provided that annexin A6-mCherry remains in the cytoplasm. D, live HEK293 cells expressing annexin A6-mCherry (arrows) and mCherry were observed in the confocal microscope and treated with 1 μm TG followed by 2, 5, 7, and 10 mm [Ca2+]ex. Localization of annexin A6-mCherry after adding the indicated [Ca2+]ex is shown. There was no translocation of annexin A6-mCherry to PM at 2 or 5 mm [Ca2+]ex.
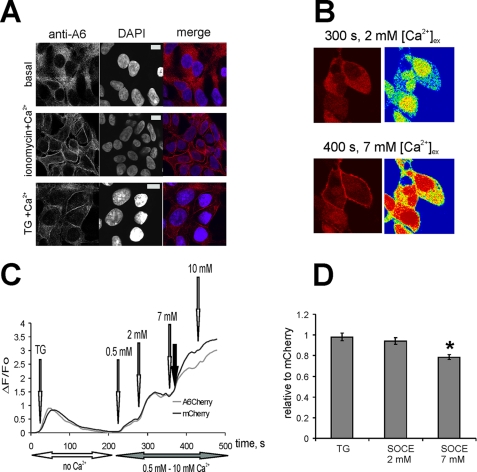
Previously we showed that ectopically expressed annexin A6 translocated to the PM in live cells treated with ionomycin or TG upon elevation of [Ca2+]i (14). In the set of experiments described above (Fig. 3, A–C), by choosing the appropriate [Ca2+]ex., we kept [Ca2+]i below the threshold levels required for annexin A6 PM translocation. However, when HEK293 cells were treated with TG, followed by addition of 7 mm or 10 mm [Ca2+]ex, large amounts of annexin A6-mCherry associated with the PM (Fig. 3D). Similarly, endogenous annexin A6 associated with the PM of Ca2+-ionomicin or TG-treated cells as detected by immunofluorescence (Fig. 4A). To assess the effects of annexin A6-PM translocation on Ca2+ entry we co-cultured HEK293 cells expressing annexin A6-mCherry or mCherry alone, treated them with TG followed by SOCE stimulation with gradually increasing [Ca2+]ex up to 10 mm. As shown in Fig. 4B, at [Ca2+]ex below 5 mm, SOCE was similar in A6-overexpressing and control cells. When [Ca2+]ex was increased above 7 mm, annexin A6-mCherry fusion protein translocated to the PM (Fig. 4B). PM translocation of A6-mCherry under these conditions correlates with ∼20% decline in the rates of Ca2+ entry, indicating that PM translocation of annexin A6 attenuated SOCE (Fig. 4, C and D).
FIGURE 4.
Annexin A6 interacts with the PM upon elevation of [Ca2+]i and decreases Ca2+ entry following its membrane binding. A, untransfected HEK293 cells were left untreated, or stimulated with either ionomycin or TG as indicated, followed by the addition of 10 mm [Ca2+]ex. Cells were fixed and localization of endogenous annexin A6 examined by immunofluorescence with anti-annexin A6 monoclonal antibodies. B, HEK293 cells expressing annexin A6-mCherry or mCherry alone were co-cultured and loaded with Fluo-3/AM and stimulated with 1 μm TG. SOCE was activated by adding 0.5, 2, 7, and 10 mm [Ca2+]ex. Increase of [Ca2+]i (green channel, here shown as a rainbow) was monitored simultaneously with the localization of mCherry-tagged annexin A6 (red channel). C, in a representative experiment shown in B, responses in mCherry-expressing cells (control, black line) were compared with annexin A6-mCherry cells (gray line). The filled arrow indicates the translocation of annexin A6-mCherry to PM. D, the graph shows an average of five independent experiments (n = 23 fields) ± S.E. There was no statistically significant difference between the TG-induced Ca2+ release and SOCE stimulated by 2 mm [Ca2+]ex, but a statistically significant (*, p < 0.01) 20% reduction of SOCE after annexin A6 PM translocation at 7 mm [Ca2+]ex.
Knockdown of Endogenous Annexin A6 Causes Elevation of Ca2+ Entry
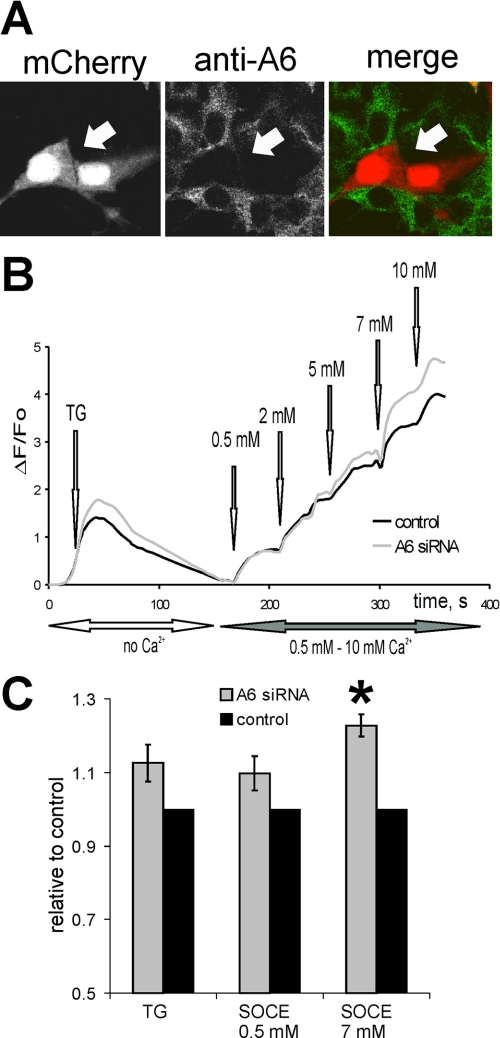
To establish a role for endogenous annexin A6 in the regulation of SOCE, we performed knockdown experiments using transient transfections of HEK293 cells with annexin A6 shRNA plasmids targeting human annexin A6, together with mCherry, or scrambled shRNA (control) together with mCherry-tH. The levels of inhibition of annexin A6 expression were evaluated by immunofluorescence, and no endogenous annexin A6 protein was detected in mCherry-positive cells 48 h post-transfection (Fig. 5A). Cells were co-cultured on coverslips, and levels of SOCE were investigated after adding 1 μm TG followed by increasing [Ca2+]ex from 0.5 mm to 10 mm (Fig. 5B). Consistent with annexin A6 overexpression inhibiting SOCE, there was a statistically significant elevation of Ca2+ entry caused by application of 7 mm [Ca2+]ex in annexin A6 knockdown HEK293 cells compared with the controls (n = 23 recordings, Fig. 5C).
FIGURE 5.
Knockdown of endogenous annexin A6 causes increased Ca2+ entry in HEK293 cells. A, HEK293 cells were co-transfected with shRNA plasmids expressing annexin A6-specific siRNA and mCherry. Expression levels of endogenous annexin A6 were examined by immunofluorescence 48 h post transfection. mCherry-positive cells do not express annexin A6 (arrows). B, HEK293 cells co-expressing annexin A6 shRNA together with mCherry or scrambled shRNA control together with mCherry-tH were co-cultured, loaded with Fluo-3/AM, and stimulated with 1 μm TG. SOCE was activated by adding 0.5, 2, 5, 7, and 10 mm [Ca2+]ex. In a representative experiment, responses in mCherry-expressing annexin A6-negative cells (gray line) were compared with control mCherry-tH cells (black line). C, an average of four independent experiments (n = 14 recordings) is shown in the graph.
Plasma Membrane Targeting of Annexins A1 and A2 Does Not Influence SOCE
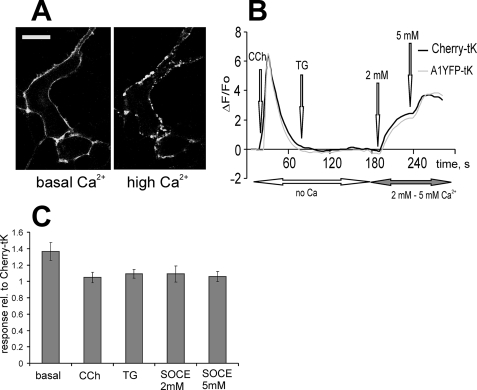
All annexins interact with cellular membranes upon elevation of [Ca2+]i, albeit with different [Ca2+]i sensitivities (10, 14). To test for the specificity of the annexin A6-induced SOCE attenuation within the annexin family, we performed identical assays with annexin A1, anchored to the PM with the tK sequence. We expressed annexin A1YFP-tK, and first examined its intracellular localization. Similar to membrane-targeted annexin A6, A1YFP-tK was evenly distributed at the PM of non-stimulated cells. However, upon elevation of [Ca2+]i in ionomycin-treated cells, we observed a redistribution and punctuated PM staining of tagged annexin A1, consistent with its association with ceramide platforms, as described previously for cytoplasmic annexin A1YFP (38) (Fig. 6A). A1YFP-tK-expressing cells were stimulated with CCh, followed by treatment with TG. Fig. 6B shows a representative recording with five cells each imaged in the same field, and the data are summarized in Fig. 6C. Most importantly, activation of SOCE in cells expressing A1YFP-tK did not result in any significant differences compared with control cells.
FIGURE 6.
Annexin A1 does not influence Ca2+ entry in A1YFP-tK cells. A, annexin A1 was expressed as a fusion with YFP and the K-Ras anchor sequence. Live HEK293 cells producing A1YFP-tK were analyzed by confocal microscopy under resting conditions, and after stimulation with 2 mm Ca2+-ionomycin. tK-tagged annexin A1 was targeted to the PM at rest, and redistributed into a punctuated PM staining as shown previously (38) due to association with ceramide platforms at high Ca2+. Bar = 5 μm. B, annexin A1YFP-tK-expressing cells were co-cultured with mCherry-tK control, loaded with Fluo-3/AM, and stimulated with 10 μm CCh, followed by SERCA inhibition with 1 μm TG, and activation of SOCE with 2 mm and 5 mm [Ca2+]ex. In a representative experiment, responses in mCherry-tK-expressing cells (control, black line) were compared with annexin A1YFP-tK cells (gray line). C, the graph shows an average of five independent experiments (n = 21 recordings) ± S.E. There was no statistically significant difference between the responses in annexin A1YFP-tK cells compared with the mCherry-tK control.
Similar to annexin A1, annexin A2 is also known to interact with the PM in a Ca2+-dependent manner (14). We therefore also analyzed the effects of overexpression of membrane-targeted annexin A2 on SOCE and obtained results comparable to the data shown for annexin A1. H-Ras-anchored annexin A2 remained PM-associated in low and high [Ca2+]i but did not show the punctuated distribution typical for annexin A1 (supplemental Fig. S3A). However, despite the differences in subcellular localization, there was no significant decrease of SOCE compared with the control (supplemental Fig. S3, B and C) (n = 25 recordings). In summary, these data indicate that attenuation of Ca2+ entry was annexin A6-specific.
Attenuated Ca2+ Entry in A6YFP-tH Cells Leads to a Decrease in ER Store Contents
Annexin A6, constitutively attached to the PM by two different Ras membrane anchors tH and tK, caused similar decreases in SOCE. However, tH-tagged A6 also reduced the amounts of Ca2+ stored in the ER as judged by the amplitude of CCh-mediated Ca2+ transients (Fig. 2D). In non-stimulated A6YFP-tH cells, the levels of basal Fluo-3 fluorescence were often decreased, indicating a reduction of basal [Ca2+]i levels (not shown). To rule out effects of tH-tagged annexin A6 on intracellular compartments, such as the ER, we performed additional control experiments. Similar to the results described in Fig. 2C, cells were transfected with A6YFP-tH, loaded with Fluo-3/AM in the absence of Ca2+, and treated with TG followed by addition of Ca2+ to induce SOCE. Under these conditions, and consistent with the data shown in Fig. 2 (C and D), there was a marked decrease in the amplitude of Ca2+ release from the ER, as evident after TG application (supplemental Fig. S4A). However, when the cells were re-loaded with 3 mm [Ca2+]ex for 2 h after Fluo-3/AM incubation, prior to SOCE stimulation, there was no difference in the amplitude of intracellular Ca2+ release between A6YFP-tH and mCherry-tH control cells, whereas the inhibitory effect on SOCE was not significantly affected (supplemental Fig. S4B). Thus Ca2+ reloading before stimulation restored the basal [Ca2+]i levels and the Ca2+ store contents in the ER to the control levels, indicating that cells expressing tH-tagged annexin A6 did not develop deficiencies in ER loading or an excessive ER leak. These findings indicate that tH-tagged annexin A6 possibly induced a stronger inhibition of Ca2+ entry across the PM compared with tK-tagged annexin A6, causing the decrease of ER store contents under Ca2+-free conditions. In view of these observations, in all subsequent experiments with A6YFP-tH cells, the cells were preincubated in Ca2+-Tyrode and perfused with Ca2+-free buffer shortly before application of TG.
The PM-localization of Annexin A6 Does Not Affect Ca2+ Extrusion Rates across the Membrane
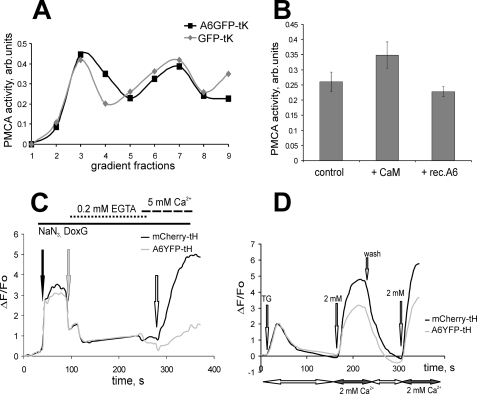
To test whether A6YFP-tH- and -tK-mediated down-regulation of SOCE was the result of an increased Ca2+ extrusion, we measured the PM Ca2+-ATPase (PMCA) activity in membrane fractions, containing bound annexin A6, as well as the speed of Ca2+ clearance from A6YFP-tH cells. The PMCA activity was similar in membrane preparations from the A6GFP-tK-expressing cells and in GFP-tK control cells (Fig. 7A). Likewise, the addition of purified recombinant annexin A6 to membrane preparations of HEK 293 cells in the presence of 10 mm Ca2+ had no effect on PMCA activity, whereas addition of purified calmodulin, a known modulator of PMCA (37), resulted in an increase of PMCA activity (Fig. 7B).
FIGURE 7.
The PM localization of annexin A6 does not affect Ca2+ extrusion rates. A, PM Ca2+-ATPase (PMCA) activity in sucrose gradient fractions of A6GFP-tK cells (black line) or GFP-tK cells (gray line). Membranes were prepared using detergent-free gradient flotation method in the presence of 1 mm EGTA. B, PMCA activity was measured in membranes of untransfected HEK293 cells (control), in membranes supplemented with 2 μg of purified calmodulin (+ CaM) and in membranes supplemented with 2 μg of purified recombinant annexin A6 (+ rec.A6), both in the presence of 10 μm Ca2+. The graph shows an average of four experiments ± S.E. Binding of the recombinant annexin A6 to the membranes was controlled by in vitro binding assay (not shown). C, co-cultured A6YFP-tH and mCherry-tH cells were preincubated in 20 mm NaN3 and 2-deoxy-d-glucose (DoxG), [Ca2+]i returned to basal by adding 0.2 mm EGTA, and Ca2+ entry was stimulated by adding 5 mm [Ca2+]ex. The black trace shows a representative recording in control, gray line in A6YFP-tH cells. D, SOCE was stimulated in co-cultured A6YFP-tH and mCherry-tH cells, followed by perfusion with a Ca2+-free buffer to restore basal [Ca2+]i, and subsequent addition of 2 mm [Ca2+]ex.
We then measured Ca2+ entry after PMCA inactivation upon ATP depletion in A6YFP-tH cells and mCherry-tH control (Fig. 7C). Cells were preincubated in 20 mm NaN3 and 20 mm 2-deoxy-d-glucose, and Ca2+ entry was stimulated by addition of 5 mm [Ca2+]ex. Despite inactivation of PMCA by ATP depletion, a significant decrease in the rates of Ca2+ entry in A6YFP-tH cells was observed, compared with the mCherry-tH control. Finally, we determined the effectiveness of Ca2+ clearance in cells expressing A6YFP-tH and mCherry-tH (Fig. 7D). In line with the results described above, there was no difference in the Ca2+ extrusion speed when control and A6YFP-tH cells restored their basal [Ca2+]i after SOCE stimulation. Taken together, these results suggest that membrane-tagged annexin A6 acts on SOCE independent of PMCA and does not affect the speed of Ca2+ extrusion.
The Ca2+ Independent Interactions of A6YFP-tH and A6YFP-tK with Membranes Are Mediated by Actin
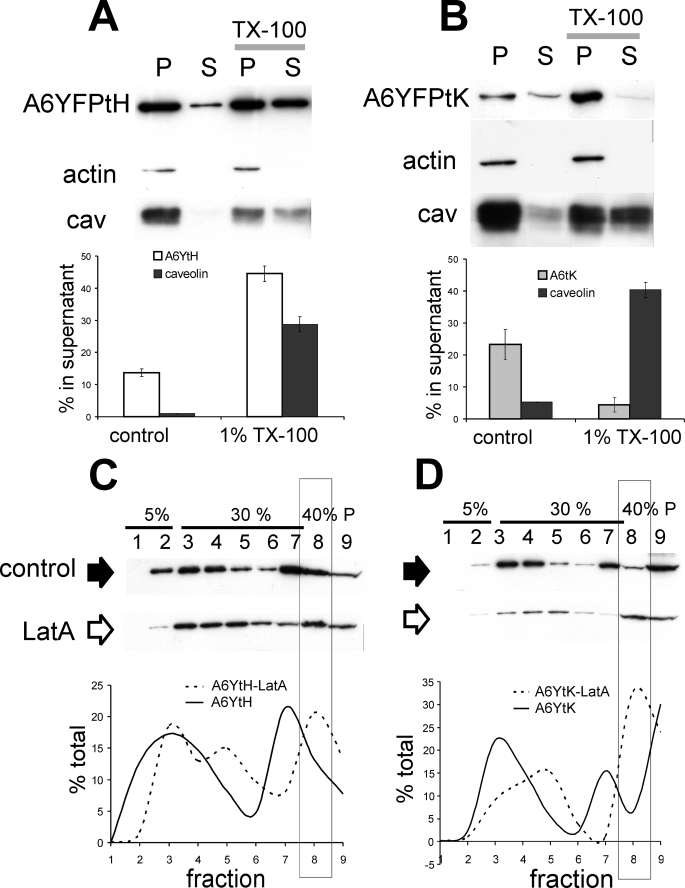
Stabilization of cortical cytoskeleton with jasplakinolide reduces SOCE in most cells (8), possibly by interfering with STIM1 function (39). Annexin A6 has been reported to bind actin filaments and stabilize cytoskeleton of contractile cells (40–42). Confirming the previously published observations, purified endogenous annexin A6 bound actin in a Ca2+-dependent manner in vitro (supplemental Fig. S5). We then examined the association of membrane-anchored annexin A6 with cortical actin. Membrane fractions, which were gradient-purified in the presence of 1 mm EGTA, contained significant amounts of F-actin and caveolin (Fig. 8, A and B). Lipid extraction of A6YFP-tH-containing membranes with 1% Triton X-100 resulted in the solubilization of both tH-tagged annexin and caveolin, indicating that a proportion of annexin A6YFP-tH was lipid-associated (Fig. 8A). Analogous treatment of A6YFP-tK-containing membranes produced a different result: in contrast to caveolin, no solubilization of tK-tagged annexin was achieved, and it remained in the pellet (Fig. 8B). The fact that membrane-tagged annexin A6 co-purified with actin-rich and TX-insoluble membrane fraction is indicative of an interaction of annexin A6 with the actin cytoskeleton at the PM.
FIGURE 8.
Actin modulates the Ca2+ independent interactions of A6YFP-tH and A6YFP-tK with membranes. A, membranes of transfected HEK293 cells expressing annexin A6YFP-tH or (B) annexin A6YFP-tK were prepared in the presence of 1 mm EGTA and extracted with 1% Triton X-100. After 30-min incubation at 4 °C, membrane-bound proteins were separated by centrifugation (20 min, 12,000 rpm at 4 °C). The membrane-bound proteins in the pellet (P) and the soluble proteins in the supernatant (S) were analyzed by SDS-PAGE followed by Western blotting with antibodies against annexin A6, β-actin, and caveolin. The graphs show the distribution of annexin A6YFP-tH, A6YFP-tK, and caveolin in the supernatant following Triton X-100 extraction and represent the mean of three independent experiments ± S.E. C, HEK293 cells expressing annexin A6YFP-tH or (D) annexin A6YFP-tK were harvested 48 h post-transfection and left untreated (control, black arrow), or incubated for 2 h in Na+-Tyrode buffer with 2 mm Ca2+ and 5 μm latrunculin A (Lat A, open arrow). Cell lysates were extracted with 0.5% Triton X-100 and fractionated on a discontinuous 5–30% flotation sucrose gradient in 1 mm EGTA. Fractions were collected from the top of the gradient and analyzed by SDS-PAGE and Western blotting with anti-GFP antibodies to detect annexin A6 fusion proteins. The graphs show the protein distribution in gradient fractions, expressed as % of total protein. Fraction 8, containing soluble proteins (40% sucrose), is highlighted.
The enrichment of a protein in a particular fraction of detergent-resistant membranes separated on sucrose gradients is influenced by its interactions with both the lipid bilayer and membrane cytoskeleton (35). Because results described above pointed to an interaction of A6YFP-tH and A6YFP-tK with actin, we aimed to address the importance of the actin cytoskeleton for the Triton X-100-solubility of membrane-tagged annexin A6. Cortical actin cytoskeleton was destabilized by incubating HEK293 cells with 5 μm latrunculin A (Lat A) for 2 h, and membranes isolated after extraction with 0.5% Triton X-100. In untreated A6YFP-tH controls, the majority of tH-tagged annexin A6 is found in fractions 2–4 (detergent-resistant membranes) and 7, with ∼10% of A6YFP-tH in the soluble fraction of the gradient (fraction 8) and small amounts present in the insoluble pellet (fraction 9). It should be noted that, under these conditions, the Ras lipid anchors are soluble when being extracted with Triton X-100 (see supplemental Fig. S1), therefore the observed membrane binding most probably reflects the interaction of annexin A6 with its membrane-associated partner (lipid or protein). Lat A treatment resulted in redistribution and proportional increase of A6YFP-tH content in the soluble protein fraction of the gradient (fraction 8, 20% total) (Fig. 8C). Whereas in untreated cells, A6YFP-tK also accumulated in fractions 2, 3, and 7, large amounts of A6-YFP-tK (30% total) were found in the insoluble pellet (fraction 9) (Fig. 8D). Indeed, Lat A had a stronger effect on A6YFP-tK distribution as 30% of the protein was solubilized and relocated to fraction 8 of the gradient after Lat A incubation, compared with 5% of control. Furthermore, after Lat A treatment, the relative amount of insoluble A6YFP-tK was reduced (fraction 9) (Fig. 8D). Taken together, these data suggest that the Lat A-induced redistributions reflect the association of PM-targeted annexin A6 with actin.
The Constitutive PM Localization of Annexin A6 Stabilizes the Cortical Actin Cytoskeleton
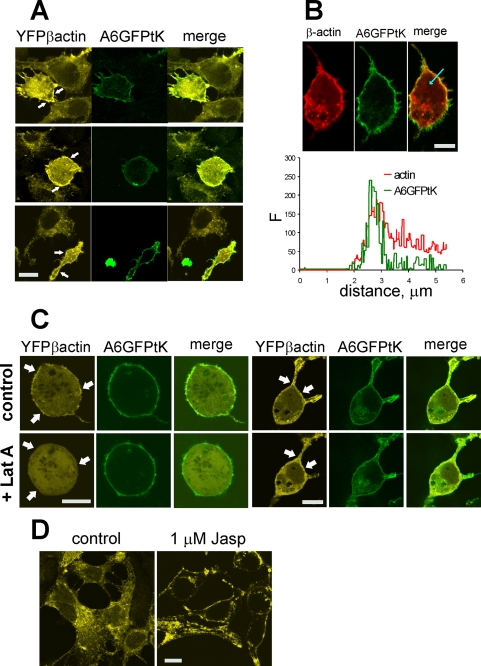
We then addressed the question whether PM localization of annexin A6 and its interaction with actin manifested themselves as changes in the distribution of F-actin filaments under the PM. We co-expressed YFP-β-actin with A6GFP-tK and compared the distribution of F-actin in these cells with the control, expressing YFP-β-actin alone. The control cells generally lacked a well developed cortical actin ring; however, in the cells co-expressing membrane-associated annexin A6, a strong accumulation of YFP-β-actin under the PM was observed (Fig. 9A, arrows). In agreement with the biochemical analysis (Fig. 8 and supplemental Fig. S5) and further supporting F-actin-annexin A6 interaction, we observed a partial co-localization of annexin A6GFP-tK and YFP-β-actin at the PM (Fig. 9B). Destabilization of the cortical actin with Lat A caused a re-distribution of YFP-β-actin, and a rapid disappearance of the cortical β-actin aggregates, without affecting the PM localization of annexin A6GFP-tK (Fig. 9C). Similar to the sub-plasmalemmal aggregates of F-actin, observed in the annexin A6GFP-tK-expressing cells, the F-actin-stabilizing agent jasplakinolide also caused the formation of a pronounced cortical actin ring under the PM of YFP-β-actin-expressing HEK293 cells (Fig. 9D). These results indicate that the constitutive PM localization of annexin A6 promoted its interaction with F-actin, resulting in a re-modeling of the actin cytoskeleton, and stabilization of cortical actin.
FIGURE 9.
The constitutive localization of annexin A6 at the plasma membrane promotes the stabilization of cortical actin. A, HEK293 cells, co-transfected with plasmids expressing annexin A6GFP-tK and YFP-β-actin, or with YFP-β-actin alone, were co-cultured for 48 h, fixed, and examined in the confocal microscope under the settings, which completely separated the GFP and YFP emission signals. Any possible bleed-through was controlled by imaging the cells, expressing either A6GFP-tK or YFP-β-actin alone (not shown). The cells co-expressing YFP-β-actin with A6GFP-tK accumulated F-actin under the PM (arrows). Bar = 5 μm. B, co-localization of annexin A6GFP-tK (here in green) and YFP-β-actin (here in red) under the plasma membrane. The graph shows an intensity profile of the green and red signals, corresponding to A6GFP-tK and b-actin, along an arbitrary axis (arrow). There is a co-localization of the signals at the PM. Bar = 5 μm. C, live HEK293 cells co-expressing A6GFP-tK and YFP-β-actin in Ca2+-Tyrode buffer were examined in the confocal microscope. Images of the same cells were taken before (control) and 2 min after addition of 5 μm Lat A (+ Lat A). Lat A treatment quickly dispersed the patches of PM-associated F-actin (arrows). Bar = 5 μm. D, cells expressing YFP-β-actin were left untreated (control), or exposed to 1 μm jasplakinolide (Jasp) for 1 h, before fixation and examining in the confocal microscope. Bar = 5 μm.
Destabilization of the Actin Cytoskeleton Abolishes the Annexin A6YFP-tH-mediated Decrease of Ca2+ Entry
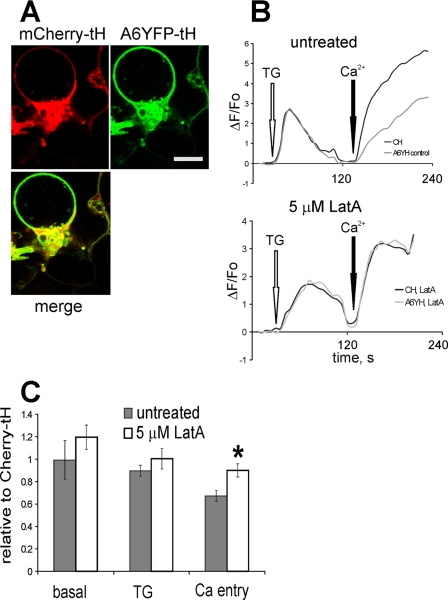
To investigate an involvement of the actin cytoskeleton in the inhibitory effects of membrane-tagged annexin A6 on SOCE, we examined Lat A-treated HEK293 cells, expressing annexin A6YFP-tH and mCherry-tH by confocal microscopy (Fig. 10A). In line with previous observations, Lat A-treated cells rounded up due to cytoskeleton destabilization. Yet, there was no noticeable intracellular redistribution of either annexin A6YFP-tH or mCherry-tH. A6YFP-tK behaved similarly (not shown). These data indicate that tH- or tK-membrane anchors facilitate an association of annexin A6 with the PM independent of the cortical actin cytoskeleton. On the other hand, given the results of the biochemical and microscopic studies in the presence of Lat A (D), once the H- and K-Ras anchor sequences have directed annexin A6 to the PM, they appear to facilitate an association of annexin A6 with F-actin.
FIGURE 10.
Destabilization of actin cytoskeleton with latrunculin A abolishes the annexin A6YFP-tH-mediated decrease of Ca2+ entry. A, HEK293 cells co-expressing annexin A6YFP-tH and mCherry-tH were treated with 5 μm Lat A for 2 h, and examined in the confocal microscope. Bar = 5 μm. B, co-cultured HEK293 cells expressing annexin A6GFP-tH (A6YH) or mCherry-tH (CH) were loaded with Fluo-3/AM, and responses to the application of 1 μm TG followed by stimulation of SOCE recorded by calcium imaging. Representative recordings from untreated cells (top), and from cells incubated in 5 μm Lat A for 1 h before SOCE activation (bottom) are shown. C, basal [Ca2+]i levels, TG-stimulated ER release and Ca2+ entry in A6YFP-tH cells treated with 5 μm Lat A for 1 h, or in untreated A6YFP-tH cells were expressed relative to the responses of the control, mCherry-tH cells. The graph shows an average of three independent experiments (n = 10 arbitrary fields each measured for untreated and Lat A-treated coverslips) ± S.E. The difference in relative SOCE levels between untreated and Lat A-treated A6YFP-tH cells was statistically significant (*, p < 0.05).
Finally, we examined the effects of cytoskeletal destabilization on SOCE in annexin A6YFP-tH-expressing cells. In the untreated cells, similar to the results described in Figs. 2, 3, and 5, there was an ∼40% attenuation of Ca2+ entry in A6YFP-tH cells compared with the control. However, when SOCE was stimulated in cells, pre-treated with 5 μm Lat A for 1 h, there was no difference in the amplitude of Ca2+ entry compared with the mCherry-tH controls (Fig. 10B). The quantification of three independent experiments (n = 10 recordings each for untreated and Lat A-treated cells) is summarized in Fig. 10C, demonstrating that Lat A treatment abolished the inhibitory effect of A6YFP-tH on SOCE (*, p < 0.05). In summary, these results suggest that membrane-targeted annexin A6 interacts with the cortical actin cytoskeleton to alter store-operated Ca2+ entry and homeostasis.
Constitutive PM Targeting of Annexin A6 Reduces Cell Proliferation
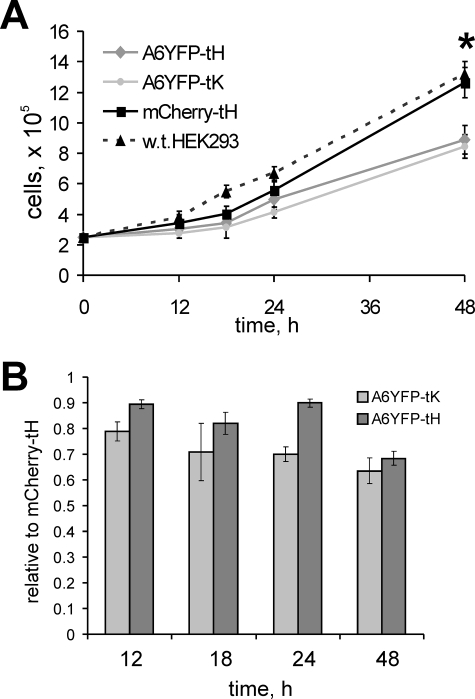
In many cell types, SOCE is believed to be vital for cell proliferation (43, 44). We investigated whether the reduction of SOCE observed in HEK293 cells ectopically expressing PM-anchored annexin A6 has an effect on cell proliferation rates. We generated HEK293 cells lines, stably expressing annexin A6YFP-tH, A6YFP-tK, and mCherry-tH control, and assessed their growth by counting viable cells at selected time points (Fig. 11A). Although differences in cellular growth were not apparent in the initial 18 h upon plating, we were able to determine a considerably slower proliferation of HEK-A6YFP-tK at 24 h and thereafter (Fig. 11B). The control HEK-mCherry-tH cells were growing similar to the wild-type HEK293. At 48 h post plating, the HEK293 cells stably expressing PM-anchored A6YFP-tH and A6YFP-tK showed reduced proliferation rates as their numbers reached ∼70% of the control. It can be concluded that both tH- and tK-anchored annexin A6 proteins inhibit cell proliferation when constitutively expressed.
FIGURE 11.
The constitutive PM targeting of annexin A6 reduces cell proliferation. A, three HEK293 cell lines, stably expressing annexin A6YFP-tH, A6YFP-tK, and mCherry-tH, and the wild-type HEK293 cells were seeded in 12-well plates at 2.5 × 10⁵ cells/well, in triplicates. At times indicated, cells were detached by trypsinization, and the total number of cells per well counted after trypan blue exclusion. The graph shows the increase in absolute cell numbers observed in two independent proliferation assays, each time point in triplicate ± SDEV. At 48 h there was a statistically significant reduction of cells per well in HEK-A6YFP-tH, and HEK-A6YFP-tK compared to the control (*, p < 0.05). B, the graph shows data from A for HEK-A6YFP-tH and HEK-A6YFP-tK relative to the number of HEK-mCherry-tH control cells at 18, 24, and 48 h post plating.
DISCUSSION
Intracellular Ca2+ homeostasis is important for many cellular functions, and any drastic alteration of the Ca2+ influx or extrusion can have far-reaching and often negative consequences. Therefore cells are equipped with a plethora of proteins controlling [Ca2+]i during signaling events and at rest. Annexin A6 knock-in and knock-out experiments (28–30) suggested a function of this Ca2+- and lipid-binding protein in the regulation of intracellular Ca2+ homeostasis. Here we used constitutive PM targeting of annexin A6 to study its role in Ca2+ entry into the cell. We fused fluorescent protein-labeled annexin A6 with PM anchor sequences of H- and K-Ras (tH and tK, respectively) and showed that the resulting proteins localized to the PM in resting cells (basal [Ca2+]i) and remained PM-associated during membrane isolation in Ca2+-free conditions. We induced SOCE in cells expressing tH- and tK-tagged annexin A6 and showed that both constructs caused a decrease of the SOCE.
PM association was necessary to observe a clear attenuation of SOCE, because ectopic expression of wild-type annexin A6, when localized in the cytoplasm, had no effect on Ca2+ entry under the same experimental conditions. Previously, we showed that cytoplasmic annexin A6 was able to bind to the PM upon elevation of [Ca2+]i in ionomycin- and TG-treated cells (14, 45). It should be noted, that for clarity in the comparative experiments shown here, the level of [Ca2+]i reached during SOCE in TG-treated cells did not promote the PM translocation of the untagged annexin A6-mCherry. However, when the TG-treated cells were perfused with higher [Ca2+]ex, resulting in further increased [Ca2+]i levels, we observed the PM translocation of both the endogenous and ectopically expressed annexin A6. Under these conditions, the wild-type annexin A6 also caused attenuation of SOCE, similar to its PM-targeted counterpart.
These data were further confirmed by knockdown experiments using annexin A6-specific shRNA. The annexin A6-negative HEK293 cells displayed elevated Ca2+ entry when SOCE was stimulated with TG. Our results are in accordance with previously published observations, where annexin A6 null-mutant cardiomyocytes showed increased Ca2+ transients and higher contractility (29), and A431 cells, lacking the endogenous annexin A6 showed higher EGF-dependent Ca2+ entry than A431 cells “rescued” by introduction of ectopic annexin A6 (30).
Most annexins associate with the PM at high [Ca2+]i, and thus could potentially influence Ca2+ entry upon PM binding. To test whether the observed effects were annexin A6-specific, we expressed annexins A1 and A2 as fusions with the YFP and tK- and tH-targeting sequences, respectively. Annexin A1YFP-tK failed to reduce SOCE in stimulated cells, indicating the specificity of the annexin A6-mediated response. Similarly, Annexin A2YFP-tH did not significantly alter SOCE upon overexpression in HEK293 cells. These findings are somewhat surprising, taking into account the high Ca2+ sensitivity of annexin A2 and its ability to bind actin (46). However, unlike annexin A6, annexin A2 appears to bind predominantly at the sites of active actin polymerization, which might not directly be linked to SOCE regulation (40, 47). Additionally, it should be noted that annexin A2 exists as a heterotetrameric complex with S100A10 (p11) protein, and this interaction is essential for most of its functions. One could envisage that PM tethering of monomeric annexin A2 using the lipid anchors of Ras proteins does not allow heterotetramer formation with S100A10 (p11) and thus interferes with the function of annexin A2. In-depth evaluation of the effects of constitutive PM localization of this and other annexins awaits further study.
Interestingly, when annexin A6 was targeted to the PM by either tH, which predominantly associated with lipid rafts, or tK, which is primarily found in non-rafts, both constructs exhibited a similar inhibitory effect on SOCE. Apart from additional labeling of the Golgi apparatus, which is characteristic for tH-tagged proteins (34), there was no visible difference in the intracellular distribution of the two proteins. The stronger attenuation of Ca2+ entry by tH-tagged A6 was not statistically significant, but manifested itself in significantly reduced amounts of Ca2+ stored in the ER, when the cells were maintained in low [Ca2+]ex. These effects were reversed by Ca2+ supplementation, indicating that tH-tagged annexin A6 did not have a direct effect on ER loading or cause an excessive ER leak.
Calcium clearance counterbalances Ca2+ entry to achieve a precise regulation of Ca2+ homeostasis. In non-excitable HEK293 cells, the PMCA is the principal pump responsible for Ca2+ efflux, and its activity has been shown to be stimulated by calmodulin and influenced by phosphorylation, hormones, and reactive oxygen species (48). Previously published studies indirectly implicated annexin A6 in the enhancement of neuronal Na+/Ca2+ exchanger (26). Here we tested the effect of the PM-targeted or recombinant purified annexin A6 on the activation of PMCA, and showed that there was no enhancement of the pump activity. A6YFP-tH-expressing cells showed the same rates of Ca2+ clearance as the control, and inhibition of the PMCA in ATP-depleted cells did not abolish A6YFP-tH-mediated down-regulation of Ca2+ entry.
PM-targeted annexin A6 attenuated both TG-induced SOCE, and EGF receptor-mediated Ca2+ entry. The process of Ca2+ entry is influenced by a multitude of proteins and lipids, modulating the coupling between ER and PM at the sites of SOCE stimulation, or acting directly on the Ca2+ channel components. To clarify the role of annexin A6 in the down-regulation of Ca2+ entry, we investigated the factors, which determine its PM binding and localization in addition to the H- and K-Ras lipid anchors. We used membrane fractionation in the presence of EGTA and Triton X-100, when both the endogenous annexin A6 and tH- or tK-tagged GFP had lost their ability to associate with membranes, and showed that A6YFP-tH and A6YFP-tK retained their membrane binding, probably due to the interaction of annexin A6 with the actin cytoskeleton. Cytoplasmic annexin A6 associates with the cortical cytoskeleton in a Ca2+-dependent and Ca2+-independent manner (41, 49), and its complex with actin has been suggested to stabilize cardiomyocyte sarcolemma during cell stimulation (50). Results presented here demonstrate that annexin A6 binds actin in vitro and suggest that actin is a binding partner of both tH- and tK-tagged annexin A6 at the PM. Microscopic studies further strengthen this hypothesis, because A6GFP-tK-expressing cells exhibited a noticeable redistribution of F-actin filaments, and an increased sub-plasmalemmal cortical actin ring.
The actin cytoskeleton plays a major role in the regulation of SOCE (7–9). Agents, acting on cortical actin, are well known to interfere with the activation of SOCE: stabilization of the cortical cytoskeleton with jasplakinolide reduces SOCE in most cells (8), possibly by interfering with STIM1 function (39), whereas disruption of cytoskeleton with latrunculin A or cytochalasin D activates Ca2+ entry (51). In agreement with membrane-anchored annexin A6 inhibiting SOCE via actin reorganization, we showed that Lat A treatment abolished the annexin A6YFP-tH-mediated attenuation of SOCE. These findings implicate the interaction of annexin A6 with cortical actin in the regulation of Ca2+ entry into the cells. Although the exact mechanism by which annexin A6 exerts its effects on cytoskeletal organization and the concomitant activity of the SOCE machinery awaits further clarification, it is possible that, similar to jasplakinolide, the role of annexin A6 lies in PM recruitment and stabilization of cortical actin. Our results indicate that annexin A6 is a key player linking the actin cytoskeleton with SOCE, and its interaction with PM and subsequent stabilization of cortical actin might contribute to attenuation of Ca2+ entry in vivo.
Many details of SOCE, including the functional STIM-Orai1 protein complex remain to be elucidated. Caveolae have been suggested as important Ca2+ entry sites, and recently it has been shown that alterations of caveolin expression modulated SOCE (52). Likewise, it has been reported that the disruption of cholesterol-rich microdomains reduces Ca2+ entry (53). We have previously shown that the membrane binding of annexin A6 is modulated by cholesterol, which is necessary for EGTA-resistant association of annexin A6 with endosomal membranes (54) and that high levels of annexin A6 indirectly reduce the number of caveolae at the cell surface (18, 19). Thus, in addition to the actin cytoskeleton stabilization, common for both K- and H-Ras-anchored annexin A6 constructs, the tH-tagged annexin A6 may affect SOCE via a lipid raft or caveolae-dependent mechanism, thus contributing to a stronger down-regulation of Ca2+ entry in annexin A6YFP-tH cells.
An alteration of intracellular Ca2+ homeostasis often leads to the changes in cell proliferation, growth, and differentiation. Reduction of SOCE by inhibiting STIM1 and Orai1 gene expression results in decreased proliferation rates in endothelial and hepatoma cells (43, 55). We compared the proliferation rates of stable HEK293 cell lines, expressing PM-anchored annexin A6 to controls and found that membrane-targeted annexin A6 inhibited cell proliferation by ∼30% of the control levels. Interestingly, the expression of annexin A6 is reduced or lost in many cancers (56, 59), and annexin A6 has an anti-proliferative effect in some cancer cell lines (45). Because annexin A6 has other functions at the plasma membrane in addition to attenuating Ca2+ entry, such as the regulation of growth factor receptor, Ras, and PKC signaling (57), there might be different reasons for the inhibitory effects of its PM localization on cell proliferation, which remain to be elucidated. Likewise, further studies are needed to understand the role of annexin A6 in the interaction between STIM1 and Orai1. The constitutive PM anchoring of annexin A6 offers an excellent tool to gain a mechanistic insight into various functions of this protein.
Supplementary Material
Acknowledgments
We thank Dr. J. Hancock (Brisbane, Australia) for the kind gift of pC1-GFP-tH and pC1-GFP-tK plasmids, and Drs. C. Enrich (Barcelona, Spain) and N. Demaurex (Geneva, Switzerland) for helpful discussions.
This work was supported in part by the Swiss National Science Foundation (SNF Grants 320000-111778 to K. M. and 3100A0-121980/1 to E. B.) and the National Research Programme NRP 53 “Musculoskeletal Health-Chronic Pain” (Grant 405340-104679/1 to A. D.).
 The on-line version of this article (available at http://www.jbc.org) contains supplemental Figs. S1–S5.
Footnotes
- ER
- endoplasmic reticulum
- PM
- plasma membrane
- SOCE
- store-operated Ca2+ entry
- GFP
- green fluorescent protein
- tH
- C terminus of H-Ras
- tK
- lipid anchor of K-Ras
- YFP
- yellow fluorescent protein
- shRNA
- short hairpin RNA
- PMCA
- plasma membrane Ca2+-ATPase
- SERCA
- sarcoplasmic-endoplasmic reticulum calcium ATPase
- CCH
- carbachol
- TG
- thapsigargin
- EGF
- epidermal growth factor
- Lat A
- latrunculin A.
REFERENCES
- 1.Parekh A. B. ( 2006) Pflugers Arch. 453, 303– 311 [DOI] [PubMed] [Google Scholar]
- 2.Vig M., Peinelt C., Beck A., Koomoa D. L., Rabah D., Koblan-Huberson M., Kraft S., Turner H., Fleig A., Penner R., Kinet J. P. ( 2006) Science 312, 1220– 1223 [DOI] [PMC free article] [PubMed] [Google Scholar]
- 3.Putney J. W., Jr. ( 2005) J. Cell Biol. 169, 381– 382 [DOI] [PMC free article] [PubMed] [Google Scholar]
- 4.Soboloff J., Spassova M. A., Dziadek M. A., Gill D. L. ( 2006) Biochim. Biophys. Acta 1763, 1161– 1168 [DOI] [PubMed] [Google Scholar]
- 5.Dziadek M. A., Johnstone L. S. ( 2007) Cell Calcium 42, 123– 132 [DOI] [PubMed] [Google Scholar]
- 6.Ong H. L., Liu X., Tsaneva-Atanasova K., Singh B. B., Bandyopadhyay B. C., Swaim W. D., Russell J. T., Hegde R. S., Sherman A., Ambudkar I. S. ( 2007) J. Biol. Chem. 282, 12176– 12185 [DOI] [PMC free article] [PubMed] [Google Scholar]
- 7.Patterson R. L., van Rossum D. B., Gill D. L. ( 1999) Cell 98, 487– 499 [DOI] [PubMed] [Google Scholar]
- 8.Rosado J. A., Sage S. O. ( 2000) J. Physiol. 526, 221– 229 [DOI] [PMC free article] [PubMed] [Google Scholar]
- 9.Jardin I., Lopez J. J., Salido G. M., Rosado J. A. ( 2008) J. Biol. Chem. 283, 25296– 25304 [DOI] [PubMed] [Google Scholar]
- 10.Draeger A., Wray S., Babiychuk E. B. ( 2005) Biochem. J. 387, 309– 314 [DOI] [PMC free article] [PubMed] [Google Scholar]
- 11.Gerke V., Moss S. E. ( 2002) Physiol. Rev. 82, 331– 371 [DOI] [PubMed] [Google Scholar]
- 12.Hayes M. J., Moss S. E. ( 2004) Biochem. Biophys. Res. Commun. 322, 1166– 1170 [DOI] [PubMed] [Google Scholar]
- 13.Grewal T., Enrich C. ( 2006) Bioessays 28, 1211– 1220 [DOI] [PubMed] [Google Scholar]
- 14.Monastyrskaya K., Babiychuk E. B., Hostettler A., Rescher U., Draeger A. ( 2007) Cell Calcium 41, 207– 219 [DOI] [PubMed] [Google Scholar]
- 15.Köhler G., Hering U., Zschörnig O., Arnold K. ( 1997) Biochemistry 36, 8189– 8194 [DOI] [PubMed] [Google Scholar]
- 16.Grewal T., Heeren J., Mewawala D., Schnitgerhans T., Wendt D., Salomon G., Enrich C., Beisiegel U., Jäckle S. ( 2000) J. Biol. Chem. 275, 33806– 33813 [DOI] [PubMed] [Google Scholar]
- 17.Harder T., Kellner R., Parton R. G., Gruenberg J. ( 1997) Mol. Biol. Cell 8, 533– 545 [DOI] [PMC free article] [PubMed] [Google Scholar]
- 18.Cubells L., Vilà de, Muga S., Tebar F., Wood P., Evans R., Ingelmo-Torres M., Calvo M., Gaus K., Pol A., Grewal T., Enrich C. ( 2007) Traffic 8, 1568– 1589 [DOI] [PMC free article] [PubMed] [Google Scholar]
- 19.Cubells L., de Muga S. V., Tebar F., Bonventre J. V., Balsinde J., Pol A., Grewal T., Enrich C. ( 2008) J. Biol. Chem. 283, 10174– 10183 [DOI] [PubMed] [Google Scholar]
- 20.Monastyrskaya K., Tschumi F., Babiychuk E. B., Stroka D., Draeger A. ( 2008) Biochem. J. 409, 65– 75 [DOI] [PubMed] [Google Scholar]
- 21.Golczak M., Kirilenko A., Bandorowicz-Pikula J., Pikula S. ( 2001) FEBS Lett. 496, 49– 54 [DOI] [PubMed] [Google Scholar]
- 22.Kim Y. E., Isas J. M., Haigler H. T., Langen R. ( 2005) J. Biol. Chem. 280, 32398– 32404 [DOI] [PubMed] [Google Scholar]
- 23.Hawkins T. E., Merrifield C. J., Moss S. E. ( 2000) Cell Biochem. Biophys. 33, 275– 296 [DOI] [PubMed] [Google Scholar]
- 24.Kaetzel M. A., Chan H. C., Dubinsky W. P., Dedman J. R., Nelson D. J. ( 1994) J. Biol. Chem. 269, 5297– 5302 [PubMed] [Google Scholar]
- 25.Díaz-Muñoz M., Hamilton S. L., Kaetzel M. A., Hazarika P., Dedman J. R. ( 1990) J. Biol. Chem. 265, 15894– 15899 [PubMed] [Google Scholar]
- 26.Naciff J. M., Behbehani M. M., Kaetzel M. A., Dedman J. R. ( 1996) Am. J. Physiol. 271, C2004– C2015 [DOI] [PubMed] [Google Scholar]
- 27.Camors E., Charue D., Trouvé P., Monceau V., Loyer X., Russo-Marie F., Charlemagne D. ( 2006) J. Mol. Cell Cardiol. 40, 47– 55 [DOI] [PubMed] [Google Scholar]
- 28.Gunteski Hamblin A. M., Song G., Walsh R. A., Frenzke M., Boivin G. P., Dorn G. W., Kaetzel M. A., Horseman N. D., Dedman J. R. ( 1996) Am. J. Physiol. 270, H1091– H1100 [DOI] [PubMed] [Google Scholar]
- 29.Song G., Harding S. E., Duchen M. R., Tunwell R., O'Gara P., Hawkins T. E., Moss S. E. ( 2002) FASEB J. 16, 622– 624 [DOI] [PubMed] [Google Scholar]
- 30.Fleet A., Ashworth R., Kubista H., Edwards H., Bolsover S., Mobbs P., Moss S. E. ( 1999) Biochem. Biophys. Res. Commun. 260, 540– 546 [DOI] [PubMed] [Google Scholar]
- 31.Hancock J. F., Parton R. G. ( 2005) Biochem. J. 389, 1– 11 [DOI] [PMC free article] [PubMed] [Google Scholar]
- 32.Prior I. A., Hancock J. F. ( 2001) J. Cell Sci. 114, 1603– 1608 [DOI] [PubMed] [Google Scholar]
- 33.Prior I. A., Harding A., Yan J., Sluimer J., Parton R. G., Hancock J. F. ( 2001) Nat. Cell Biol. 3, 368– 375 [DOI] [PubMed] [Google Scholar]
- 34.Apolloni A., Prior I. A., Lindsay M., Parton R. G., Hancock J. F. ( 2000) Mol. Cell. Biol. 20, 2475– 2487 [DOI] [PMC free article] [PubMed] [Google Scholar]
- 35.Babiychuk E. B., Draeger A. ( 2006) Biochem. J. 397, 407– 416 [DOI] [PMC free article] [PubMed] [Google Scholar]
- 36.Monastyrskaya K., Hostettler A., Buergi S., Draeger A. ( 2005) J. Biol. Chem. 280, 7135– 7146 [DOI] [PubMed] [Google Scholar]
- 37.Zaidi A., Gao J., Squier T. C., Michaelis M. L. ( 1998) Neurobiol. Aging 19, 487– 495 [DOI] [PubMed] [Google Scholar]
- 38.Babiychuk E. B., Monastyrskaya K., Draeger A. ( 2008) Traffic 9, 1757– 1775 [DOI] [PubMed] [Google Scholar]
- 39.Tamarina N. A., Kuznetsov A., Philipson L. H. ( 2008) Cell Calcium 44, 533– 544 [DOI] [PubMed] [Google Scholar]
- 40.Hayes M. J., Rescher U., Gerke V., Moss S. E. ( 2004) Traffic 5, 571– 576 [DOI] [PubMed] [Google Scholar]
- 41.Babiychuk E. B., Palstra R. J., Schaller J., Kämpfer U., Draeger A. ( 1999) J. Biol. Chem. 274, 35191– 35195 [DOI] [PubMed] [Google Scholar]
- 42.Babiychuk E. B., Babiychuk V. S., Danilova V. M., Tregubov V. S., Sagach V. F., Draeger A. ( 2002) Biochim. Biophys. Acta 1600, 154– 161 [DOI] [PubMed] [Google Scholar]
- 43.Abdullaev I. F., Bisaillon J. M., Potier M., Gonzalez J. C., Motiani R. K., Trebak M. ( 2008) Circ. Res. 103, 1289– 1299 [DOI] [PMC free article] [PubMed] [Google Scholar]
- 44.El Boustany C., Bidaux G., Enfissi A., Delcourt P., Prevarskaya N., Capiod T. ( 2008) Hepatology 47, 2068– 2077 [DOI] [PubMed] [Google Scholar]
- 45.Vilá de, Muga S., Timpson P., Cubells L., Evans R., Hayes T. E., Rentero C., Hegemann A., Reverter M., Leschner J., Pol A., Tebar F., Daly R. J., Enrich C., Grewal T. ( 2009) Oncogene 28, 363– 377 [DOI] [PubMed] [Google Scholar]
- 46.Filipenko N. R., Waisman D. M. ( 2001) J. Biol. Chem. 276, 5310– 5315 [DOI] [PubMed] [Google Scholar]
- 47.Hayes M. J., Shao D., Bailly M., Moss S. E. ( 2006) EMBO J. 25, 1816– 1826 [DOI] [PMC free article] [PubMed] [Google Scholar]
- 48.Zyliñska L., Soszyñski M. ( 2000) Acta Biochim. Pol. 47, 529– 539 [PubMed] [Google Scholar]
- 49.Babiychuk E. B., Draeger A. ( 2000) J. Cell Biol. 150, 1113– 1124 [DOI] [PMC free article] [PubMed] [Google Scholar]
- 50.Locate S., Colyer J., Gawler D. J., Walker J. H. ( 2008) Cell Biol. Int. 32, 1388– 1396 [DOI] [PubMed] [Google Scholar]
- 51.Morales S., Camello P. J., Rosado J. A., Mawe G. M., Pozo M. J. ( 2005) Cell Signal. 17, 635– 645 [DOI] [PubMed] [Google Scholar]
- 52.Zhu H., Weisleder N., Wu P., Cai C., Chen J. W. ( 2008) J. Pharmacol. Sci. 106, 287– 294 [DOI] [PubMed] [Google Scholar]
- 53.Jardin I., Salido G. M., Rosado J. A. ( 2008) Channels (Austin) 2, 401– 403 [DOI] [PubMed] [Google Scholar]
- 54.de Diego I., Schwartz F., Siegfried H., Dauterstedt P., Heeren J., Beisiegel U., Enrich C., Grewal T. ( 2002) J. Biol. Chem. 277, 32187– 32194 [DOI] [PubMed] [Google Scholar]
- 55.Darbellay B., Arnaudeau S., König S., Jousset H., Bader C., Demaurex N., Bernheim L. ( 2009) J. Biol. Chem. 284, 5370– 5380 [DOI] [PubMed] [Google Scholar]
- 56.Mussunoor S., Murray G. I. ( 2008) J. Pathol. 216, 131– 140 [DOI] [PubMed] [Google Scholar]
- 57.Grewal T., Evans R., Rentero C., Tebar F., Cubells L., de Diego I., Kirchhoff M. F., Hughes W. E., Heeren J., Rye K. A., Rinninger F., Daly R. J., Pol A., Enrich C. ( 2005) Oncogene 24, 5809– 5820 [DOI] [PubMed] [Google Scholar]
- 58.Deleted in proof
- 59.Grewal T., Enrich C. ( 2009) Cell. Signal. 21, 847– 858 [DOI] [PubMed] [Google Scholar]
Associated Data
This section collects any data citations, data availability statements, or supplementary materials included in this article.


