Abstract
Voltage-gated sodium channels (Nav) produce sodium currents that underlie the initiation and propagation of action potentials in nerve and muscle cells. Fibroblast growth factor homologous factors (FHFs) bind to the intracellular C-terminal region of the Nav α subunit to modulate fast inactivation of the channel. In this study we solved the crystal structure of a 149-residue-long fragment of human FHF2A which unveils the structural features of the homology core domain of all 10 human FHF isoforms. Through analysis of crystal packing contacts and site-directed mutagenesis experiments we identified a conserved surface on the FHF core domain that mediates channel binding in vitro and in vivo. Mutations at this channel binding surface impaired the ability of FHFs to co-localize with Navs at the axon initial segment of hippocampal neurons. The mutations also disabled FHF modulation of voltage-dependent fast inactivation of sodium channels in neuronal cells. Based on our data, we propose that FHFs constitute auxiliary subunits for Navs.
Introduction
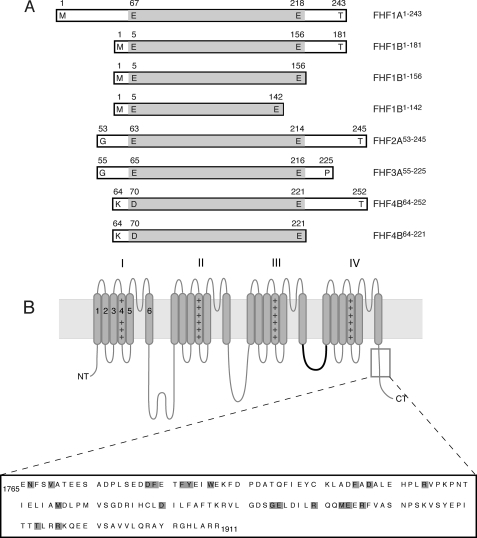
Voltage-gated sodium channels (Nav)3 produce sodium currents that underlie the initiation and propagation of action potentials in nerve and muscle cells. These channels are heteromeric membrane proteins composed of an α subunit, which is sufficient for channel gating, and one or more auxiliary β subunits, which tune voltage dependence and kinetics of channel gating (for review, see Ref. 1). Nine α subunit isoforms (Nav1.1–Nav1.9) and a tenth related protein (Nax) have been identified in mammals (2). The α subunit of Navs consists of four homologous domains (DI–DIV) which compose the ion conduction pore and the voltage sensors, allowing sodium flux into the cell upon membrane depolarization and channel activation (Fig. 1B). The cytoplasmic loop linking DIII and DIV contains the gate, which binds to and occludes the cytoplasmic face of the channel pore during fast inactivation (3, 4). For the cardiac channel Nav1.5, it has been proposed that interaction between the DIII-DIV loop and the C-terminal domain of the α subunit stabilizes the inactivated state of the channel (5).
FIGURE 1.
Schematic of FHF and channel constructs used in this study. A, FHF constructs. Boundaries of each construct are labeled. The boundaries of the FHF homology core region are shaded gray. B, topology of the Nav α subunit. The four homologous domains of the α subunit (labeled I-IV), each containing six transmembrane α-helical segments (gray rods labeled 1–6) form the ion conduction pore. The fourth segment of each domain contains positive charge clusters (++) and is part of the voltage sensors. The intracellular loop linking domains III and IV functions as the fast inactivation gate (highlighted in bold). The C-terminal region, which binds FHFs, is boxed, and the primary sequence of this region in murine Nav1.6 (residues 1765–1911) is shown. The positions of pathogenic mutations in this channel region are shaded gray.
The functional importance of the cytoplasmic C-terminal domain in Nav physiology is evidenced by the fact that mutations at this region (Fig. 1B) have been linked to epilepsy, autism, cardiac arrhythmias, and skeletal muscle disease (6). The channel C-terminal domain has been shown to contain binding sites for channel regulatory proteins (7), including fibroblast growth factor homologous factors FHF1–FHF4 (8, 9). Because of sequence homology, FHFs are also classified as members of the fibroblast growth factor (FGF) family using the following terminologies: FHF1 = FGF12 = iFGF12, FHF2 = FGF13 = iFGF13, FHF3 = FGF11 = iFGF11, FHF4 = FGF14 = iFGF14 (10–12). However, FHFs do not bind and activate FGF receptors (FGFRs) (8), and therefore, we have suggested referring to these proteins as FHFs (8, 13).
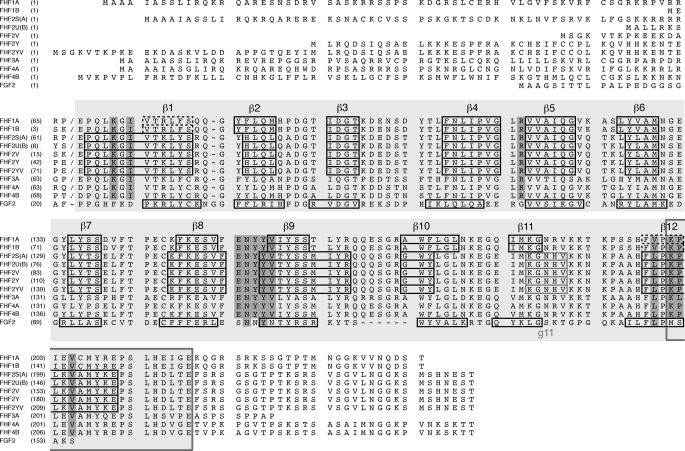
For each of the four mammalian FHFs, multiple isoforms with distinct N-terminal sequences are generated through alternative promoter usage and 5′ alternative splicing (14), giving rise to 10 FHF isoforms in humans (Fig. 4). These isoforms may differ in their subcellular localization and have been shown to differentially modulate channel function (15, 16). FHFs are predominantly expressed in developing and adult neurons of the central and peripheral nervous systems (9, 17, 18) and co-localize with Navs at axon initial segments (AIS) and nodes of Ranvier (15, 19, 20). Missense or frameshift mutations in the fhf4 gene have been identified in patients with inherited spinocerebellar ataxia (21–23). Syndromic and nonspecific forms of X-linked mental retardation have been mapped to the fhf2 gene locus, making the fhf2 gene a positional candidate gene for these disorders (24–28).
FIGURE 4.
Structure-based sequence alignment of all 10 human FHF isoforms. For comparison, the sequence of FGF2 is included in the alignment. Secondary structure elements (β1-β12, g11) are indicated above and below alignments, and residues containing these elements for known secondary structures are boxed. β1 and β12 strands of FHF1 (PDB ID 1Q1U; Ref. 8) are indicated by dashed boxes. Note that these strands are shorter than the corresponding β strands of FHF2 due to C-terminal truncation of the crystallized FHF1B protein (see also Fig. 6B). A slash in each sequence marks the junction between alternatively spliced N-terminal region and FHF homology core region. Sequence alignment was optimized by introducing gaps (dashes). The FHF homology core region is shaded light gray, and the 18-residue-long C-terminal extension not shared with FGFs is indicated by a box drawn around the sequences. Residues of the FHF homology region engaged in channel binding are shaded darker gray. Channel binding residues are conserved among all FHFs, and all but three of these residues are divergent from corresponding FGF residues.
Gene knock-out studies have also implicated FHFs in development and function of the nervous system. In frog embryos, fhf2 gene knock-out suppresses neuronal differentiation (29). Fhf4-null mice show sensorimotor and cognitive abnormalities that resemble symptoms seen in ataxia patients carrying fhf4 mutations (30, 31). Impaired excitability of cerebellar granule and Purkinje neurons in fhf4 knock-out mice (19, 32) may contribute to the ataxia phenotype. The fhf4 null mice also display impaired hippocampal synaptic transmission and plasticity (33). In mice deficient for both fhf4 and fhf1, the ataxia phenotype is aggravated (19). The excitability of cerebellar granule neurons in fhf1/fhf4-null mice is more severely impaired than in fhf4-null mice and is due to a substantial hyperpolarizing shift in the voltage dependence of sodium channel inactivation and slower recovery of channels from fast inactivation (19). Reciprocally, transfection of FHF4 proteins into primary hippocampal neurons induces a depolarizing shift in the voltage dependence of sodium channel inactivation (15).
Previously, we solved a crystal structure of FHF1B and demonstrated that FHFs are functionally distinct from FGFs even though FHFs share remarkable structural homology with FGFs (8). Here, we present a crystal structure of FHF2A, which enabled us to define a conserved surface on FHFs required for binding to the C-terminal domain of Navs and for the modulation of channel inactivation. The FHF2A structure also reveals how a FHF invariant secondary structure in the C-terminal region of FHFs contributes to the inability of FHFs to bind FGFRs, further substantiating FHFs as functionally distinct from FGFs.
EXPERIMENTAL PROCEDURES
Analysis of FHF-Channel Interactions by Surface Plasmon Resonance Spectroscopy
Surface plasmon resonance (SPR) experiments were performed on a Biacore 2000 instrument (Biacore AB), and FHF-channel interactions were studied at 25 °C. To analyze FHF1 binding to the C-terminal domain of Nav α subunit isoforms, FHF1A1–243 and FHF1B1–181 (Fig. 1A) were immobilized by amine coupling on two flow channels of a research grade CM5 chip (Biacore AB; ∼91 fmol/mm2 of flow channel). To control for nonspecific binding, FGF21–155 was coupled to the control flow channel of the chip (∼84 fmol/mm2). Increasing concentrations of the cytoplasmic C-terminal tail of Nav1.5 (Nav1.5CT) in HBS-EP buffer (10 mm HEPES-NaOH, pH 7.4, 150 mm NaCl, 3 mm EDTA, 0.005% (v/v) polysorbate 20) were injected over the chip at a flow rate of 50 μl min−1. At the end of each protein injection (180 s), HBS-EP buffer (50 μl min−1) was flowed over the chip to monitor dissociation for 180 s. The chip surface was then regenerated by injecting 50 μl of 2.0 m NaCl in 10 mm sodium acetate, pH 4.5. The data were processed with BiaEvaluation software (Biacore AB). For each Nav1.5 injection, the nonspecific responses from the FGF2 control flow channel were subtracted from the responses recorded for the FHF1 flow channel. Maximal equilibrium responses were plotted against the concentrations of Nav1.5CT (Fig. 2, A and B), and from the fitted saturation binding curve the equilibrium dissociation constant (KD) was calculated. Fitted binding curves were judged to be accurate based on the distribution of the residuals (even and near zero) and χ2 (<10% of Rmax).
FIGURE 2.
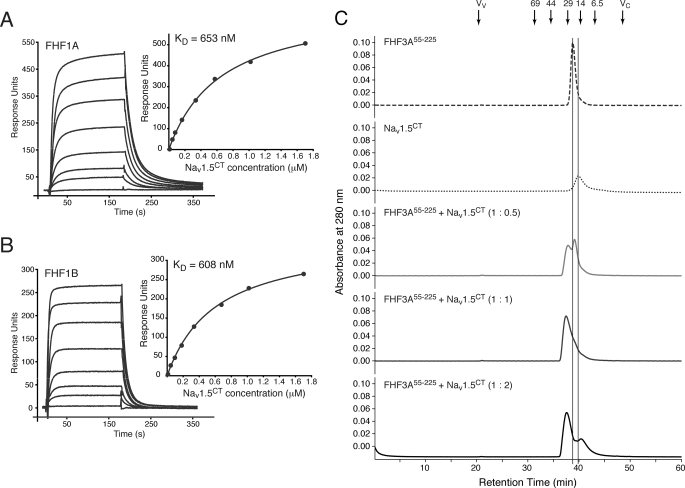
FHFs form 1:1 complexes with the C-terminal domain of Nav1.5 regardless of N-terminal alternative splicing. Shown is a representative SPR sensorgram of FHF1A1–243 binding to Nav1.5CT (A) and a representative SPR sensorgram of FHF1B1–181 binding to Nav1.5CT (B) and fitted saturation binding curves. FHF1 proteins were immobilized on a biosensor chip, and increasing concentrations of Nav1.5CT were passed over the chip. Dissociation constants (KD) were calculated from the saturation binding curves. C, representative stack plot of size-exclusion chromatograms of FHF3A55–225 alone, Nav1.5CT alone, and FHF3A55–225 mixed with Nav1.5CT at molar ratios of 1:0.5, 1:1, and 1:2. Vertical lines indicate the retention times of FHF3A55–225 and Nav1.5CT. Arrows indicate the retention times of molecular size standards, the void volume (Vv), and the column volume (Vc).
To analyze channel binding of FHF2-FHF4, Nav1.1CT, Nav1.2CT, Nav1.5CT, Nav1.6CT, and Nav1.9CT were immobilized on flow channels of research grade CM5 chips. To control for nonspecific binding, FGFR1c142–365 was coupled to the control flow channel. The coupling densities (fmol/mm2 of flow channel) were ∼210 (Nav1.1CT), 212 (Nav1.2CT), 61–201 (Nav1.5CT), 74 (Nav1.6CT), 79 (Nav1.9CT), and 69–209 (FGFR1c142–365). Increasing concentrations of FHF2A53–245, FHF3A55–225, FHF4B64–252, or mutant FHF2A proteins in HBS-EP buffer were passed over the chip. Monitoring of dissociation phase, chip regeneration, and data processing were done as described above. For each FHF injection, the nonspecific responses from the FGFR1c control flow channel were subtracted from the responses recorded for the flow channel onto which a channel C-terminal domain was immobilized. Where possible, data were fit using equilibrium analysis as described above.
Analysis of FHF-Channel Interactions by Size-exclusion Chromatography
Size-exclusion chromatography experiments were performed on a Waters 626 high pressure liquid chromatography system equipped with a Waters 600S controller and a Waters 996 photodiode array detector. A TSK-G3000SW column (TOSOH Bioscience LLC) was used for all experiments. Because of poor solubility of FHF2A53–245 and FHF3A55–225 in low salt buffers, the experiments were carried out with 25 mm HEPES-NaOH buffer, pH 7.5, containing 1.0 m NaCl. Sample injection volume was 100 μl, and the flow rate was 0.5 ml min−1. Protein retention times were determined by absorbance at 280 nm. The column was calibrated with albumin (69.3 kDa), ovalbumin (44.3 kDa), carbonic anhydrase (28.8 kDa), ribonuclease A (13.7 kDa), and aprotinin (6.5 kDa). The void volume was determined using blue dextran 2000, and the column volume was measured with acetone. To analyze complex formation of different FHF proteins with the C-terminal domain of Nav α subunit isoforms, 2.6 μmol of FHF and 2.6 μmol of C-terminal channel fragment were mixed in 25 mm HEPES-NaOH buffer, pH 7.5, 1.0 m NaCl, left on ice for about 10 min, and then applied to the size-exclusion column. Retention times of FHF and channel C-terminal domain alone served as reference points. To determine the stoichiometry of the FHF-channel complex, FHF and C-terminal channel fragment were mixed at molar ratios of 1:0.5, 1:1, and 1:2.
Crystallization of FHF2A, X-ray Diffraction Data Collection, and Structure Determination
FHF2A53–245 was mixed with Nav1.6CT in 25 mm HEPES-NaOH buffer, pH 7.5, 150 mm NaCl, and the protein complex was treated with thrombin and then isolated by size-exclusion chromatography. The FHF2A-Nav1.6 complex was concentrated to ∼10 mg ml−1, mixed 1:1 with crystallization buffer, and equilibrated against 750 μl of crystallization buffer at 20 °C. FHF2A alone crystallized in 100 mm HEPES-NaOH, pH 7.5, 200 mm (NH4)2SO4, and 22% (v/v) polyethylene glycol 4000. Cryoprotection of the FHF2A crystal was achieved by soaking the crystal in crystallization buffer with stepwise increasing concentrations of glycerol (5–20% v/v) before flash-freezing under a liquid nitrogen stream. The FHF2A crystal belonged to space group P21, and there were two FHF2A molecules in the asymmetric unit of the crystal with solvent content of 37.5%. Diffraction data were collected at the National Synchrotron Light Source beam line X4A, and data sets were indexed, integrated, and scaled using HKL-2000 (34). The FHF2A structure was determined by molecular replacement using the program AMoRe (35), and the published FHF1B structure (PDB ID 1Q1U) (8) as the search model. Models were built into 2Fo − Fc and Fo − Fc electron density maps using O (36) and refined with CNS (37). The final model for the FHF2A structure contains residues 64–212 of two FHF2A molecules; residues 60–63 at the N terminus and 213–237 at the C terminus are disordered in each of the two molecules. Data collection and refinement statistics are summarized in Table 1.
TABLE 1.
Data collection and refinement statistics
Values in parentheses are for the highest resolution shell (1.97-1.9 Å).
| FHF2A | |
|---|---|
| Data collection | |
| Space group | P21 |
| Cell dimensions, a, b, c (Å); β (°) | 52.218, 57.998, 52.236; 93.791 |
| Resolution (Å) | 50.0-1.9 |
| Rsym (%) | 4.4 (20.2) |
| I/σI | 34.9 |
| Completeness (%) | 94.8 (86.8) |
| Redundancy | 8.2 (7.4) |
| Refinement | |
| Resolution (Å) | 25.0-1.9 |
| No. reflections | 23,092 |
| Rcryst/Rfree (%)a | 21.9/25.1 |
| No. atoms | |
| Protein | 2,360 |
| Water | 130 |
| B-Factors | |
| Protein | 25.5 |
| Water | 30.6 |
| Root mean square deviations | |
| Bond lengths (Å) | 0.006 |
| Bond angles (°) | 1.4 |
a 10% of the reflections were used for calculation of Rfree.
Analysis of Subcellular Targeting of FHF2A and FHF4B in Hippocampal Neurons
Hippocampal neurons were isolated from E18 rat embryos (19). At day 4 in vitro, cells were transfected with plasmids expressing wild-type FHF2A-GFP or mutant FHF2A-GFP carrying the following eight mutations at the channel binding site: K67F, I69R, Y151N, Y152H, L195R, K197M, P198S, and V201S (FHF2Aocta-mutant-GFP). 48 h post-transfection, neurons were processed for immunofluorescence imaging (19). For FHF2A staining, fixed neurons were incubated with a mouse monoclonal antibody to GFP (Chemicon) followed by biotinylated anti-mouse IgG2a (Jackson ImmunoResearch) and streptavidin-Alexa488 (Molecular Probes). For ankyrin G labeling, fixed neurons were incubated with a mouse monoclonal antibody to ankyrin G (Santa Cruz Biotechnology) followed by anti-mouse IgG1-Alexa594 (Molecular Probes). Green and red fluorescence was detected using a Zeiss Axiophot microscope with a 40× objective lens.
R117G single and Y158N/V160N double mutations were introduced into FHF4B-GFP construct (15) by site-directed mutagenesis (FHF4BR117G-GFP; FHF4BY158N/V160N-GFP). Cultures of hippocampal neurons were prepared from E18 rat embryos (15). After 9 days in culture, neurons were transfected with expression vectors for wild-type FHF4B-GFP and FHF4B-GFP mutants. One day later, transfected neurons were processed for fluorescence imaging (15, 38). Wild-type FHF4B and mutant variants could be directly visualized by GFP fluorescence. For βIV-spectrin labeling, fixed neurons were incubated with a chicken antibody to βIV-spectrin provided by Dr. M. Komada (Tokyo Institute of Technology) followed by biotin-conjugated goat anti-chicken IgG (Vector Laboratories) and streptavidin-Alexa350 (Invitrogen). GFP- and Alexa350-fluorescent images were acquired using a Zeiss Axio Imager epifluorescence microscope with a 63× objective, and digital images were collected using a Zeiss Axiocam MRC digital camera and Axio-Vision software. Quantitative analysis of FHF2A and FHF4B images was carried out similarly as described (15, 38). For analysis of AIS enrichment of FHF4B wild-type and mutants, a mask of the AIS was first generated by thresholding the βIV-spectrin images. The mask of the corresponding region was then applied to the unthresholded GFP images. Fluorescence intensity in dendrites was directly measured on the GFP images. For analysis of AIS enrichment of FHF2A wild-type and mutants, GFP immunofluorescence was averaged within 5-μm zones of the AIS and the brightest proximal dendrite. The AIS enrichment index was defined as the ratio of total fluorescence intensity/area at AIS divided by the total fluorescence intensity/area in dendrites (15). Analysis was done using ImageJ (United States National Institutes of Health) and Photoshop (Adobe®) software.
Analysis of FHF2 Modulation of Nav Fast Inactivation in Neuro2A Cells
Murine neuroblastoma-derived Neuro2A cells, which endogenously express at least four Nav α subunit isoforms (15), were transfected with bicistronic expression vectors for coupled expression of GFP and one of the following untagged FHF proteins: FHF2A, octa-mutant FHF2A, FHF2B, octa-mutant FHF2B. The octa-mutant FHF2B harbored mutations equivalent to those of the octa-mutant FHF2A (see section above). 6 h post-transfection, the cells were trypsinized and plated on poly-d-lysine-coated coverslips for electrophysiological analysis 48 h later. Coverslips were placed in the recording chamber perfused with a solution consisting of 120 mm NaCl, 26 mm NaHCO3, 3 mm KCl, 10 mm glucose, 4 mm MgCl2, 2 mm CaCl2, 0.2 mm CdCl2, 3 mm myoinositol, and 2 mm sodium pyruvate. Patch pipettes were pulled with a P-97 Micropipette Puller (Sutter Instruments) to a tip diameter of about 1.5 μm and a resistance of 3–4 megaohms when filled with intracellular recording solution consisting of 10 mm HEPES-NaOH, pH 7.2, 104 mm CsF, 50 mm tetraethylamine chloride, 5 mm glucose, 2 mm MgCl2, 10 mm EGTA, 2 mm ATP, and 0.2 mm GTP. Cells exhibiting GFP fluorescence were patched in whole cell configuration after obtaining a pipette seal resistance of >5 gigaohms. Voltage clamp commands and current recordings were performed with an Axopatch 200B amplifier and Digidata 1322 analog-digital interface using pClamp9 software (Axon Instruments). Cells were held at a membrane voltage of −110 mV. To measure voltage dependence of sodium channel fast inactivation, membrane voltage was stepped from −110 mV to conditioning voltages (between −110 and −20 mV, at 5-mV intervals) for 60 ms followed by further depolarization to 0 mV. Peak inward sodium currents were converted to fraction of conductance available (not inactivated), and these values for each cell were used to calculate membrane voltage of half-maximal inactivation (V1/2inact) by fitting to the Boltzmann equation, ƒ(Vm) = 1/{1 + e([Vm − V1/2inact]/k}.
Statistical Analysis
Statistical significance of differences in fitted parameter values between Neuro2A cells co-expressing GFP and FHF proteins and untransfected cells was calculated by the two-tailed Student's t test. Similarly, statistical significance of differences in AIS enrichment index between neurons expressing wild-type FHFs and neurons expressing mutant FHFs were determined using Student's t test.
Additional Methods
The following methodologies can be found in the supplemental material: purification of FHF and channel proteins, analysis of FHF2A crystal by mass spectrometry, and analysis of FHF1B-Nav1.6 interaction by SPR spectroscopy.
RESULTS AND DISCUSSION
The Alternatively Spliced N Terminus of FHFs Does Not Contribute to FHF Interaction with the C-terminal Region of the Nav α Subunit
Interaction between FHFs and Navs has been shown using yeast two-hybrid, far-Western blot, and co-immunoprecipitation assays (15, 16, 20, 39, 40). None of these experimental approaches, however, can unambiguously show whether FHF and channel interact directly. Thus, we used SPR spectroscopy as well as size-exclusion chromatography to examine whether FHF-channel binding is direct. To this end, we expressed and purified the two human full-length splice isoforms of FHF1, FHF1A1–243 and FHF1B1–181 (Fig. 1A), and C-terminal fragments of Nav1.1 (Glu-1787 to Arg-1912; Nav1.1CT), Nav1.2 (Glu-1777 to Gln-1923; Nav1.2CT), Nav1.5 (Glu-1773 to Arg-1919; Nav1.5CT), Nav1.6 (Glu-1765 to Arg-1911; Nav1.6CT), and Nav1.9 (Glu-1585 to Glu-1729; Nav1.9CT) (Fig. 1B). These Nav fragments were designed based on previous studies showing that this channel region can bind FHF1B (39, 40), FHF2 (16, 20), and FHF4 (15).
FHF1A and FHF1B were immobilized on a biosensor chip, and increasing concentrations of Nav1.5CT were passed over the chip. FGFR1c142–365 was used as a negative control. As shown in Fig. 2, A and B, both FHF1 isoforms bound to Nav1.5CT with nearly identical binding affinities. As expected, FGFR1c did not exhibit any FHF binding (data not shown). Consistent with the SPR data, FHF1A and FHF1B each co-eluted with Nav1.5CT from a size-exclusion column (supplemental Table 1). Because both FHF1 isoforms bind to Nav1.5CT with comparable affinity, the data imply that alternative splicing at the FHF1 N terminus may not contribute to channel binding. To determine whether the alternative splicing likewise does not impact FHF1 interaction with other Nav α subunit isoforms, we analyzed binding of FHF1A and FHF1B to Nav1.6CT and Nav1.9CT. FHF1A and FHF1B each co-eluted with Nav1.9CT from a size-exclusion column (supplemental Table 1), and SPR analysis showed that both FHF1 isoforms bound to the C-terminal fragments of Nav1.6 and Nav1.9 (supplemental Fig. 1). Together, the data suggest that the alternatively spliced FHF1 N terminus does not contribute to FHF1 interaction with the C-terminal domain of Navs.
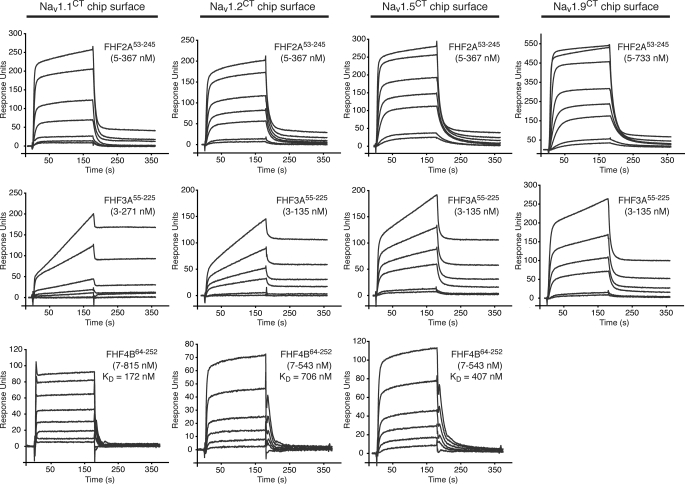
To test whether the alternatively spliced N termini of FHF2-FHF4 also do not participate in binding to the Nav C-terminal domain, we expressed and purified residues 53–245 of FHF2A (FHF2A53–245), residues 55–225 of FHF3A (FHF3A55–225), and residues 64–252 of FHF4B (FHF4B64–252) (Fig. 1A). These N-terminal-truncated FHF constructs represent the regions that are shared among the multiple isoforms of the respective FHF. Binding of these FHF2-FHF4 constant regions to the C-terminal fragments of Nav1.1, Nav1.2, Nav1.5, Nav1.6, and Nav1.9 was measured by SPR spectroscopy. The channel C-terminal fragments were coupled to a biosensor chip, and increasing concentrations of FHF2A53–245, FHF3A55–225, FHF4B64–252, and as negative controls, FGF11–155 and FGF21–155, were passed over the chip. All three FHFs bound to the C-terminal regions of Nav1.1, Nav1.2, Nav1.5, Nav1.6, and Nav1.9 (Fig. 3, supplemental Fig. 2, and data not shown). As expected, neither FGF1 nor FGF2 exhibited any channel binding (supplemental Fig. 3), demonstrating that the interaction between FHF and channel C-terminal domain observed by SPR spectroscopy is specific. Consistent with the SPR data, gel filtration analysis also showed channel binding of N-terminal-truncated FHF2A, FHF3A, and FHF4B (Fig. 2C, supplemental Table 1). Together, the data demonstrate that alternative splicing at the FHF N terminus does not contribute to FHF interaction with the C-terminal domain of Navs. We also studied the stoichiometry of the FHF-channel complex by analyzing the elution profile of the FHF3A55–225-Nav1.5CT complex prepared in the presence of a 2-fold molar excess of either FHF3A55–225 or Nav1.5CT. As shown in Fig. 2C, excess channel or FHF eluted at their respective retention times, affirming that FHF and channel form a 1:1 complex.
FIGURE 3.
FHFs bind to the C-terminal domain of multiple Nav α subunits. Representative SPR sensorgrams illustrating binding of FHF2A53–245, FHF3A55–225, and FHF4B64–252 to Nav1.1CT, Nav1.2CT, and Nav1.5CT and binding of FHF2A53–245 and FHF3A55–225 to Nav1.9CT. Channel C-terminal fragments were immobilized on biosensor chips, and increasing concentrations of FHF protein were passed over the chips. For FHF4B-channel interactions, equilibrium dissociation constants (KD) could be calculated.
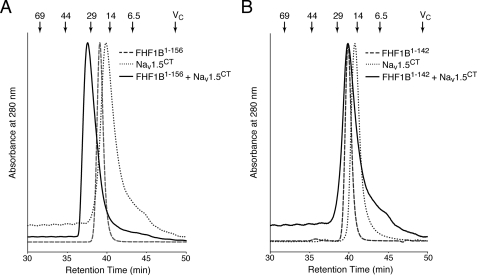
Our data demonstrate that all FHFs, regardless of N-terminal isoform variability, interact directly with the C-terminal domain of multiple Nav α subunits, suggesting that FHFs share a common channel binding site. Sequence alignment shows that FHFs exhibit a high degree of pairwise sequence identity (71–79%) within a 152-residue-long region (Fig. 4). Notably, this FHF homology region extends at the C terminus by 18 residues beyond the canonical β-trefoil core within which FHFs also exhibit significant sequence homology with FGFs (Fig. 4). To examine whether this FHF homology region is sufficient for channel binding, we expressed and purified the corresponding homology regions of FHF1B and FHF4B (FHF1B1–156, FHF4B64–221; Fig. 1A). To test the role of the FHF-invariant C-terminal extension of the homology region in channel binding, we further truncated the FHF1B protein at its C terminus (FHF1B1–142; Fig. 1A). FHF1B1–156 and FHF4B64–221 still bound Nav1.5CT, as judged by co-elution with the channel protein from a size-exclusion column (Fig. 5A, supplemental Table 1), whereas FHF1B1–142 and Nav1.5CT eluted separately upon gel filtration (Fig. 5B, supplemental Table 1). These data show that the 152-residue-long FHF homology region is sufficient for channel binding and that the 18-residue-long, C-terminal extension of the homology region plays a critical role in channel binding.
FIGURE 5.
The 18-residue-long FHF-invariant C-terminal extension of the FHF homology region is essential for FHF binding to the C-terminal domain of Nav1.5. A, overlaid size-exclusion chromatograms of FHF1B1–156 alone, Nav1.5CT alone, and a 1:1 mixture of Nav1.5CT with FHF1B1–156. B, overlaid size-exclusion chromatograms of FHF1B1–142 alone, Nav1.5CT alone, and a 1:1 mixture of Nav1.5CT with FHF1B1–142. Arrows indicate the retention times of molecular size standards and the column volume (Vc).
Crystal Structure of FHF2A Reveals a Key Structural Element for Functional Distinction of FHFs from FGFs
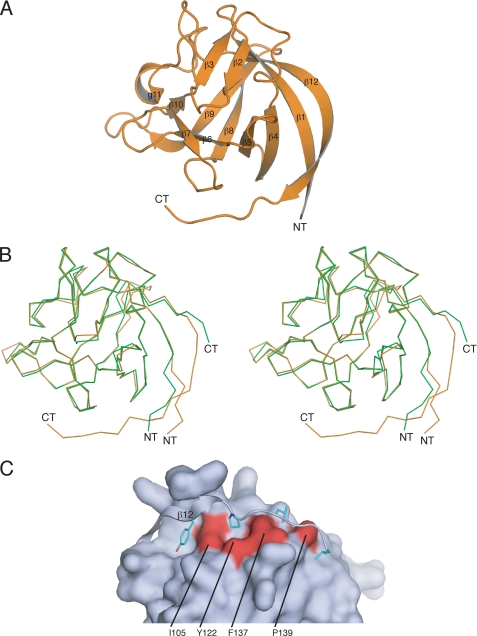
Different FHFs in complex with Nav1.6CT were screened for crystallization. We obtained a single crystal for the FHF2A-channel complex, but diffraction data analysis indicated that the crystal only contained FHF2A. After completion of diffraction data collection, the crystal was analyzed by mass spectrometry, which indicated that FHF2A residues 60–237 are within the boundaries of the crystallized FHF2A protein. The crystal structure was solved by molecular replacement using the FHF1B structure (PDB ID 1Q1U; Ref. 8) as the search model. The structure has been refined to 1.9 Å resolution with working and free R factors of 21.9 and 25.1%, respectively (Table 1). The final model consists of two FHF2A molecules (residues Pro-64 to Leu-212) and 130 water molecules (Fig. 6A, Table 1). Importantly, our new FHF2A structure accounts for all but three residues of the FHF homology region of FHF2A (Fig. 4). A single N-terminal residue (Glu-63) and the two most C-terminal residues (Thr-213, Glu-214) from the FHF homology region could not be modeled due to weak electron density. In contrast, our previous FHF1B structure (PDB ID 1Q1U Ref. 8) lacked 13 of the 18-residue-long C-terminal extension of the FHF homology region necessary for channel binding (Fig. 4).
FIGURE 6.
Crystal structure of FHF2A. A, ribbon representation of the crystal structure of the FHF homology core region of FHF2A. The FHF2A structure includes the C-terminal epitope required for FHF interaction with Navs. The β strands are labeled according to the conventional strand nomenclature for FGF1 and FGF2. NT and CT denote the N and C termini of the FHF2A core region. B, superimposition of the Cα trace of the FHF2A β-trefoil (orange) onto the Cα trace of the FHF1B β-trefoil (green; PDB ID 1Q1U; Ref. 8) shown in stereo view. The C-terminal residues 200–206 strand pair with N-terminal residues 64–69, and therefore, β1 and β12 are longer than the corresponding β strands in FHF1B (see also Figs. 4 and 5, B and C). C, molecular surface representation of part of the FHF2A β-trefoil core and ribbon representation of the C-terminal epitope (residues 200–212) required for channel binding. The C-terminal epitope is tethered to the β-trefoil core and masks a hydrophobic patch in the FHF core whose homologous region in FGFs binds to the Ig domain III of FGFRs. Tyr-204, Pro-207, Leu-209, and Leu-212 of the C-terminal epitope (residues colored cyan blue) engage in hydrophobic interactions with residues of the β-trefoil core, which are colored red and labeled.
Superimposition of the FHF2A β-trefoil core onto that of FHF1B reveals a major structural divergence at the β1 and β12 strand regions. Notably, these β strands are twice as long in FHF2A than in FHF1B and assume different Cα paths than those observed in the FHF1B structure (Fig. 6B). These structural differences between FHF2A and FHF1B are attributable to the fact that the crystallized FHF1B protein lacked the last 13 residues from the FHF homology region. In the FHF2A structure these C-terminal residues interact with the core region through many hydrogen bonding and hydrophobic interactions (Fig. 6C). Tyr-204, Pro-207, Leu-209, and Leu-212 pack against surface-exposed hydrophobic residues in the β-trefoil core region, and residues 200–206 strand pair with N-terminal residues 64–69. This extended strand pairing between C-terminal and N-terminal residues accounts for why β1 and β12 strands in the FHF2A structure are longer and adopt a different conformation than the corresponding β strands in the FHF1B structure (Figs. 4 and 6B). Hence, the lack of these C-terminal residues is responsible for the artificial structure of the β1 and β12 regions in our previously reported FHF1B structure (PDB ID 1Q1U; Ref. 8). The 13 C-terminal residues of the FHF homology region are highly conserved among FHFs (80–93%), suggesting that the extended β1-β12 strand pairing seen in the FHF2A structure is an inherent structural element of all FHFs.
The unique conformation of this C-terminal region plays a key role in functional distinction of FHFs from FGFs. In the FHF2A structure, this C-terminal region caps a hydrophobic patch in the FHF core whose homologous region in FGFs is essential for binding to the Ig domain III of FGFRs (Fig. 6C). Hence, this additional, FHF-invariant homology region plays a dual role by further contributing to the inability of FHFs to bind FGFRs and by directly participating in FHF binding to Navs. Taken together, the FHF2A structure further substantiates our previous identification of FHFs as functionally distinct from FGFs (8).
Crystal Structure of FHF2A Unveils a Conserved Binding Surface Region for Navs
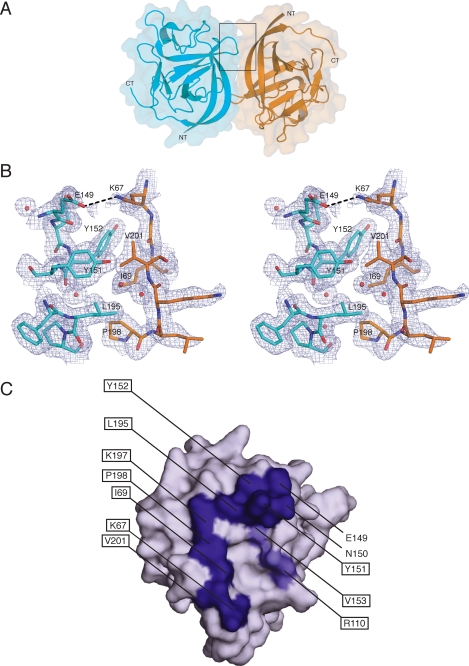
FHF2A formed a non-crystallographic 2-fold symmetric dimer with a buried surface area of 1218 Å2, a shape complementarity of 0.686, and a hydrophobic/polar ratio of 3.94:1 (Fig. 7A) (41, 42). The dimer interface is mediated by hydrophobic contacts between residues in the β8-β9 region (Tyr-151, Tyr-152) and in β12 (Leu-195) of one monomer with residues in β1 (Ile-69) and β12 (Pro-198, Val-201) regions of the other monomer (Fig. 7B). At the periphery of this hydrophobic patch, Lys-67 from one monomer hydrogen bonds with Glu-149 in the other monomer (Fig. 7B). Moreover, Lys-197 and Asn-150 from one monomer are within hydrogen bonding distance to backbone and side-chain residues in the other monomer. These biophysical parameters of the FHF2A dimer interface imply that FHF2A may also dimerize in solution. We found, however, that FHF2A migrated as a monomer on a size-exclusion column (supplemental Fig. 4), demonstrating that the FHF2A dimer is the result of favorable crystal packing contacts under the crystallization conditions employed. Because lattice contacts observed in crystals of an isolated protein (in the absence of its physiological binding partner) occasionally highlight surface regions mediating physiologically relevant interactions (43, 44), we considered whether the FHF2A surface involved in dimerization in the crystal in fact serves as binding site for FHF targets such as Navs. Another strong indication that this surface region may be physiologically relevant is implied by the sequence divergence between FHFs and FGFs at this surface region. Notably, most of the residues that mediate the FHF2A dimer in the crystal are highly conserved among FHFs but are diverged in FGFs (Figs. 4, 7C, and supplemental Fig. 5). Moreover, two additional FHF invariant residues are in the proximity of this interface (Figs. 4, 7C, and supplemental Fig. 5). These observations made it likely that sequence divergence at this surface contributes to the functional divergence of FHFs from FGFs.
FIGURE 7.
The crystal structure of FHF2A unveils a conserved surface region implicated in channel binding. A, molecular surface and ribbon representation of the FHF2A dimer within the crystal asymmetric unit. FHF2A monomers are colored orange and cyan blue, respectively. NT and CT denote the N and C termini of the FHF2A core region. B, stereo view of the boxed region (panel A) showing some of the interactions taking place at the interface between the two FHF2A molecules of the dimer in the asymmetric unit. The hydrophobic patch formed by Tyr-151, Tyr-152, and Leu-195 of one molecule and Ile-69, Pro-198, and Val-201 of the other molecule is illustrated. Hydrogen bonding at the periphery of this patch between Lys-67 of one molecule and Glu-149 of the other is also shown (marked by a dashed black line). Water molecules are shown as red spheres. The blue mesh corresponds to the 2Fo − Fc electron density map contoured at σ = 1.0. C, molecular surface representation of one of the two FHF2A molecules of the asymmetric unit. The molecule has been rotated by about 40° relative to the orientation of one of the monomers shown in panel A. Channel binding residues buried in the FHF2A dimer interface are colored deep blue (compare this figure with panel B), and channel binding residues in the vicinity of the dimer interface are colored slate blue. Except for Asn-150, Tyr-152, and Leu-195, these residues have diverged from FGFs (see also Fig. 4). Residues mutated for in vitro/in vivo validation of the channel binding site are marked by a black box.
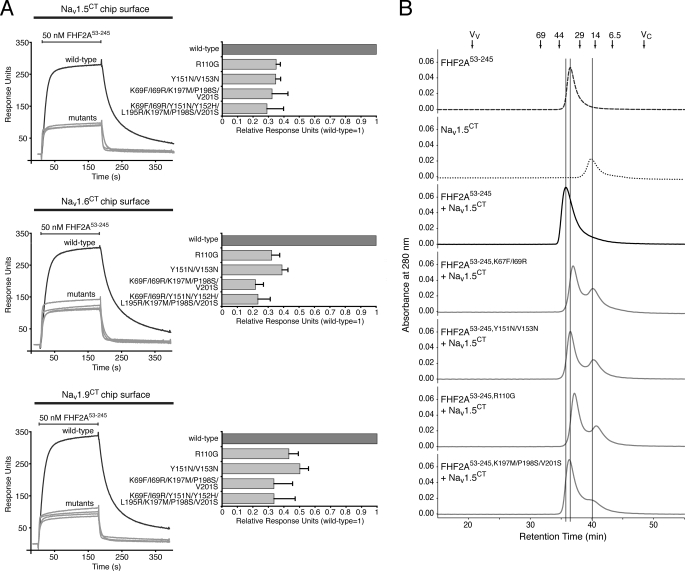
To test this possibility, we substituted residues on this surface in FHF2A and FHF1B with the corresponding residues of FGFs and examined the effect of the mutations on channel binding. In the case of FHF2A, we generated mutants carrying either one (R110G), two (K67F/I69R and Y151N/V153N), three (K197M/P198S/V201S), five (K67F/I69R/K197M/P198S/V201S), or eight (K67F/I69R/Y151N/Y152H/L195R/K197M/P198S/V201S; FHF2Aocta-mutant) mutations. In the case of FHF1B, five single mutants (K9F, I11R, R52G, Y93N, and V95N) were made. Compared with wild-type FHF2A, all FHF2A mutants had a reduced ability to interact with the channel C-terminal domain, as judged by 2–5-fold reduced SPR responses for FHF2A mutant interaction with Nav1.5CT, Nav1.6CT, and Nav1.9CT (Fig. 8A). Similarly, all five FHF1B point mutants exhibited reduced binding affinity for Nav1.6CT, varying from 4–30-fold, compared with wild-type FHF1B (KD = 19 nm; supplemental Fig. 6). Consistent with the SPR results, gel filtration analysis also showed that none of the FHF2A mutants formed a stable complex with Nav1.5CT (Fig. 8B). Together, these data demonstrate that the conserved FHF surface revealed by our FHF2A crystal structure indeed functions as a Nav-binding site.
FIGURE 8.
Structure-based mutagenesis identifies FHF residues that mediate FHF binding to the C-terminal domain of Navs. A, representative SPR sensorgrams illustrating interaction of wild-type and mutant FHF2A proteins with the C-terminal (CT) fragments of Nav1.5, Nav1.6, and Nav1.9. Channel C-terminal fragments were immobilized on a biosensor chip, and increasing concentrations of either wild-type or mutant FHF2A protein were passed over the chip. Maximal binding responses of FHF2A mutants relative to wild-type protein were plotted. Note the reduction in mutant FHF binding to channels (2–5-fold) compared with wild-type FHF-channel interaction. B, representative stack plot of size-exclusion chromatograms of FHF2A53–245 alone, Nav1.5CT alone, and 1:1 mixtures of Nav1.5CT with either wild-type or mutant FHF2A53–245. Vertical lines indicate the retention times of FHF2A53–245, Nav1.5CT, and FHF2A53–245-Nav1.5CT complex. Arrows indicate the retention times of molecular size standards, the void volume (Vv), and the column volume (Vc).
In Vivo Validation of the Nav-binding Site Revealed by the FHF2A Crystal Structure
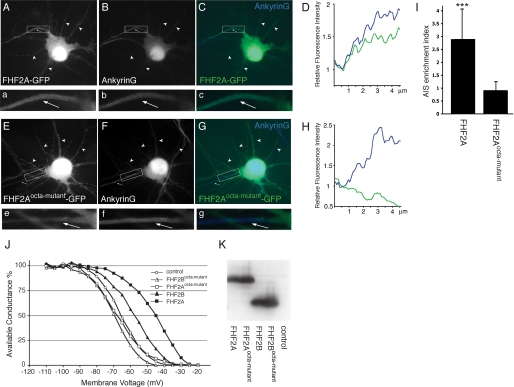
We next investigated whether this conserved channel binding surface on FHFs also mediates channel binding and modulation of channel fast inactivation in cultured neurons. These experiments were limited to only a few FHFs and FHF-channel combinations and were intended to demonstrate the physiological importance of the conserved FHF-channel interface. In one set of experiments, we expressed wild-type FHF2A and octa-mutant FHF2A as GFP fusion proteins in rat hippocampal neurons and examined co-localization of these proteins with Navs at the AIS. As illustrated in Fig. 9, Aa–Cc, neurons expressing wild-type FHF2A showed prominent fluorescence in the AIS, as judged by co-staining with the AIS marker ankyrin G. Quantitative analysis of fluorescence intensities revealed that wild-type FHF2A-GFP was nearly 2-fold more concentrated in the AIS than in the more proximal axon hillock (Fig. 9D) and nearly 3-fold more concentrated in the AIS compared with the brightest dendrite (Fig. 9I). In contrast, octa-mutant FHF2A-GFP did not display AIS enrichment over axon hillock or dendrites (Fig. 9, Ee–I).
FIGURE 9.
Effects of mutations in the Nav-binding site of FHF2 on subcellular targeting in hippocampal neurons and modulation of channel fast inactivation in Neuro2A cells. Shown are representative images of rat hippocampal neurons transfected with FHF2A-GFP (panels A–D) or FHF2Aocta-mutant-GFP (panels E–H) and processed for GFP immunofluorescence (panels A and E) and ankyrin G immunofluorescence (panels B and F). Co-fluorescence images pseudo-colored green (GFP) and blue (ankyrin G) are shown in panels C and G. Axons (arrows) and dendrites (arrowheads) are indicated. Boxed regions containing axon hillock and initial segment (AIS) are shown enlarged (images a–c, e–g). Panels d and h show immunofluorescence intensity line scans for GFP (green) and ankyrin G (blue) along a 5-micron distance spanning the transition from the axon hillock to the AIS. Relative immunofluorescence was plotted (fluorescence at the junction between hillock and AIS set to unity). I, AIS enrichment index (AIS:dendrite fluorescence intensity ratio) was calculated for neurons expressing either FHF2A-GFP (n = 8) or FHF2Aocta-mutant-GFP (n = 5). ***, p < 0.001 compared with FHF2Aocta-mutant-GFP. J, voltage dependence of channel fast inactivation was recorded in Neuro2A cells expressing wild-type FHF2A (filled squares, n = 16), FHF2Aocta-mutant (open squares, n = 12), wild-type FHF2B (filled triangles, n = 8), FHF2Bocta-mutant (open triangles, n = 10), or no FHF (open circles, n = 15). For each of the five groups, the mean channel availability following a preconditioning 60-ms pulse at each voltage is shown. K, anti-FHF2 immunoblot demonstrates equally robust expression of wild-type and mutant FHF2A and FHF2B proteins in transfected Neuro2A cells.
We next compared the abilities of wild-type FHF2A and FHF2B with those of the octa-mutant variants of FHF2A and FHF2B to modulate fast inactivation of sodium channels endogenously expressed in the neuroblastoma cell line Neuro2A (15). Octa-mutant FHF2B harbored mutations equivalent to those of octa-mutant FHF2A (see the section above and “Experimental Procedures”). Untagged wild-type FHF2A, wild-type FHF2B, and their octa-mutant variants were expressed together with GFP by transfection with bicistronic vectors, and green fluorescent cells were selected for analysis of sodium channel gating by whole cell voltage clamp (see “Experimental Procedures”). In untransfected cells, the average V1/2 and k values of Boltzmann fits of channel inactivation were −65.7 ± 6.5 and −6.0 ± 1.3 mV, respectively (n = 15). Similar to previous analyses of wild-type FHF4 proteins (15, 38), wild-type FHF2A caused a 21-mV depolarizing shift in the voltage dependence of channel inactivation (V1/2 = −44.7 ± 7.8 mV, p < 4 × 10⁻⁹ versus control; k = −7.7 ± 1.5 mV; n = 16) (Fig. 9J). By contrast, octa-mutant FHF2A had lost the ability to affect channel inactivation (V1/2 = −68.1 ± 7.5 mV; k = −5.5 ± 5.0 mV; n = 12) (Fig. 9J). Wild-type FHF2B induced a smaller 8-mV depolarizing shift in voltage dependence of inactivation (V1/2 = −57.4 ± 5.4 mV, p < 4 × 10⁻³ versus control; k = −8.5 ± 1.5 mV; n = 8) (Fig. 9J). As observed for the octa-mutant of FHF2A, octa-mutant FHF2B also had lost the ability to modulate channel inactivation (V1/2 = −70.4 ± 8.5 mV; k = −5.5 ± 0.8 mV; n = 10) (Fig. 9J). These data show that the channel binding surface in the FHF homology core domain is essential for FHF2A recruitment to the AIS and for the ability of FHF2 to modulate channel inactivation.
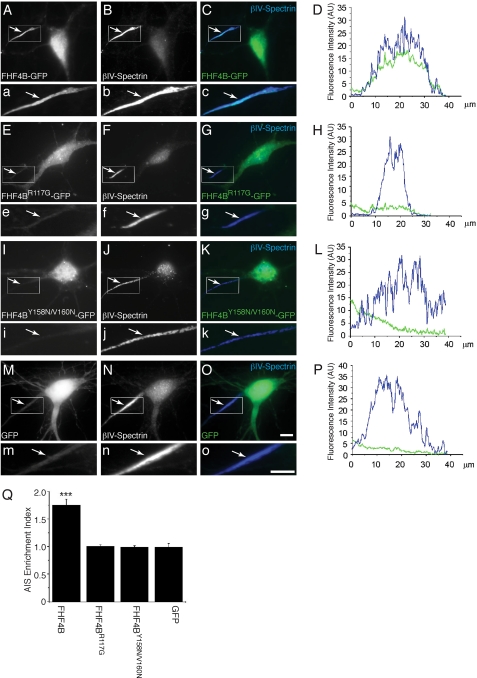
To further substantiate that the conserved Nav-binding site revealed by the FHF2A crystal structure mediates channel binding of all FHFs in vivo, we introduced mutations into the corresponding Nav-binding site of FHF4B and analyzed the impact of the mutations on the ability of FHF4B to co-localize with channels at the AIS of hippocampal neurons. Wild-type FHF4B and mutant FHF4B carrying a single mutation (R117G; FHF4BR117G) or double mutations (Y158N/V160N; FHF4BY158N/V160N) were expressed as GFP fusion proteins in rat hippocampal neurons, and the subcellular distribution of these proteins was examined by immunofluorescence microscopy. Similar to neurons expressing wild-type FHF2A (Fig. 9, Aa–D), neurons expressing wild-type FHF4B showed prominent fluorescence in the AIS, as judged by co-staining with the AIS marker βIV-spectrin (Fig. 10, Aa–D). Quantitative analysis of fluorescence intensities revealed that, similar to wild-type FHF2A-GFP (Fig. 9I), wild-type FHF4B-GFP was enriched in the AIS (Fig. 10Q). In contrast, FHF4B bearing the single substitution R117G or the double substitution Y158N/V160N showed a homogeneously diffuse distribution (Fig. 10, E/e–L) similar to GFP alone (Fig. 10, Mm–Q). Taken together, our data show that FHFs share a common binding site for the C-terminal domain of multiple Navs.
FIGURE 10.
Impact of mutations in the Nav-binding site of FHF4B on subcellular targeting in hippocampal neurons. Panels A, E, and I show FHF4 staining visualized as GFP fluorescence, and panels B, F, J, and N show βIV-spectrin labeling visualized as Alexa350 fluorescence. FHF4/βIV-spectrin double labeling (GFP/Alexa350 co-fluorescence) is shown in panels C, G, and K. Panels a–o are magnifications of the boxed AIS regions in each of the panels A–O. AU, absorbance units. White arrows mark the AIS. White scale bars (images O and o) correspond to 10 μm. Panels D, H, L, and P show fluorescence intensity line scans for GFP (green) and βIV-spectrin (blue) over distance from the cell soma of the neurons shown to the left. Q, AIS enrichment index (AIS:dendrite fluorescence intensity ratio) was calculated for neurons expressing FHF4B-GFP (n = 4), FHF4BR117G-GFP (n = 3), FHF4BY158N/V160N-GFP (n = 6), and GFP alone (n = 5). ***, p < 0.001 compared with GFP.
Conclusion
In this study we have presented the crystal structure of the FHF homology core domain of FHF2A. The structure enabled us to define a conserved surface on FHFs, which mediates FHF interaction with multiple Navs. We have shown that high affinity 1:1 stoichiometric binding of FHF to the C-terminal domain of channel α subunits accounts for co-localization of FHFs and sodium channels in neurons and modulation of channel inactivation. Hence, we propose that FHFs constitute auxiliary subunits for Navs.
How might direct channel binding enable FHFs to mediate a depolarizing shift in voltage-dependent channel inactivation? We envision two mechanisms, both of which are consistent with documented voltage-dependent widening of the cytoplasmic face of the channel pore (45). FHF interaction with the C-terminal tail of the channel may partially occlude the inner face of the pore, thereby interfering with the ability of the DIII–DIV loop to fold over the pore and inactivate the channel. Only a greater widening of the channel inner face by further depolarization would overcome this occlusion. The greater shift in voltage dependence of inactivation mediated by FHF2A in comparison to FHF2B described here and previously (16, 20) may reflect the possibility that the alternatively spliced N terminus of FHF2A is more effective in occluding the channel pore. Alternatively, FHF may delay inactivation by restricting the mobility of the DIII-DIV loop, potentially by enhancing a documented interaction of the loop with the channel C-terminal tail (5). The results reported here offer a framework for investigation of these proposed regulatory mechanisms.
Supplementary Material
Acknowledgments
We are grateful to Dr. J. Nathans (Departments of Molecular Biology and Genetics, Neuroscience, and Ophthalmology and the Howard Hughes Medical Institute, John Hopkins University School of Medicine) for providing several FHF cDNAs, Dr. H. Chen for help with preparing the structure figures, and Dr. F. Zhang (Rensselaer Polytechnic Institute) and J. Kalinina for advice on SPR data analysis. We also thank Drs. R. Abramowitz and J. Schwanof for assistance at beam line X4A at the National Synchrotron Light Source, a Department of Energy facility. Beam line X4A is supported by the New York Structural Biology Center.
This work was supported, in whole or in part, by National Institutes of Health Grants DE13686 (to M. M.), NS39906 (to M. G.), R03 NS62431 (to D. M. O.), and S10 RR017990 and P30 NS050276 (to T. A. N.). This work was also supported by the Washington University Hope Center for Neurological Disorders (to D. M. O.) and the National Ataxia Foundation (to D.M.O.).

The on-line version of this article (available at http://www.jbc.org) contains supplemental Table 1 and Figs. 1–6.
The atomic coordinates and structure factors (code 3HBW) have been deposited in the Protein Data Bank, Research Collaboratory for Structural Bioinformatics, Rutgers University, New Brunswick, NJ (http://www.rcsb.org/).
- Nav
- voltage-gated sodium channel
- FGF
- fibroblast growth factor
- FGFR
- FGF receptor
- FHF
- FGF homologous factor
- AIS
- axon initial segment
- SPR
- surface plasmon resonance
- GFP
- green fluorescent protein.
REFERENCES
- 1.Catterall W. A. ( 2000) Neuron 26, 13– 25 [DOI] [PubMed] [Google Scholar]
- 2.Catterall W. A., Goldin A. L., Waxman S. G. ( 2005) Pharmacol. Rev. 57, 397– 409 [DOI] [PubMed] [Google Scholar]
- 3.Patton D. E., West J. W., Catterall W. A., Goldin A. L. ( 1993) Neuron 11, 967– 974 [DOI] [PubMed] [Google Scholar]
- 4.West J. W., Patton D. E., Scheuer T., Wang Y., Goldin A. L., Catterall W. A. ( 1992) Proc. Natl. Acad. Sci. U.S.A. 89, 10910– 10914 [DOI] [PMC free article] [PubMed] [Google Scholar]
- 5.Motoike H. K., Liu H., Glaaser I. W., Yang A. S., Tateyama M., Kass R. S. ( 2004) J. Gen. Physiol. 123, 155– 165 [DOI] [PMC free article] [PubMed] [Google Scholar]
- 6.George A. L., Jr. ( 2005) J. Clin. Invest. 115, 1990– 1999 [DOI] [PMC free article] [PubMed] [Google Scholar]
- 7.Abriel H., Kass R. S. ( 2005) Trends Cardiovasc. Med. 15, 35– 40 [DOI] [PubMed] [Google Scholar]
- 8.Olsen S. K., Garbi M., Zampieri N., Eliseenkova A. V., Ornitz D. M., Goldfarb M., Mohammadi M. ( 2003) J. Biol. Chem. 278, 34226– 34236 [DOI] [PubMed] [Google Scholar]
- 9.Smallwood P. M., Munoz-Sanjuan I., Tong P., Macke J. P., Hendry S. H., Gilbert D. J., Copeland N. G., Jenkins N. A., Nathans J. ( 1996) Proc. Natl. Acad. Sci. U.S.A. 93, 9850– 9857 [DOI] [PMC free article] [PubMed] [Google Scholar]
- 10.Itoh N., Ornitz D. M. ( 2004) Trends Genet. 20, 563– 569 [DOI] [PubMed] [Google Scholar]
- 11.Ornitz D. M., Itoh N. ( 2001) Genome Biology 2, REVIEWS3005 [DOI] [PMC free article] [PubMed] [Google Scholar]
- 12.Itoh N., Ornitz D. M. ( 2008) Dev. Dyn. 237, 18– 27 [DOI] [PubMed] [Google Scholar]
- 13.Goldfarb M. ( 2005) Cytokine Growth Factor Rev. 16, 215– 220 [DOI] [PMC free article] [PubMed] [Google Scholar]
- 14.Munoz-Sanjuan I., Smallwood P. M., Nathans J. ( 2000) J. Biol. Chem. 275, 2589– 2597 [DOI] [PubMed] [Google Scholar]
- 15.Lou J. Y., Laezza F., Gerber B. R., Xiao M., Yamada K. A., Hartmann H., Craig A. M., Nerbonne J. M., Ornitz D. M. ( 2005) J. Physiol. 569, 179– 193 [DOI] [PMC free article] [PubMed] [Google Scholar]
- 16.Rush A. M., Wittmack E. K., Tyrrell L., Black J. A., Dib-Hajj S. D., Waxman S. G. ( 2006) Eur. J. Neurosci. 23, 2551– 2562 [DOI] [PubMed] [Google Scholar]
- 17.Hartung H., Feldman B., Lovec H., Coulier F., Birnbaum D., Goldfarb M. ( 1997) Mech. Dev. 64, 31– 39 [DOI] [PubMed] [Google Scholar]
- 18.Muñoz-Sanjuán I., Fallon J. F., Nathans J. ( 2000) Mech. Dev. 95, 101– 112 [DOI] [PubMed] [Google Scholar]
- 19.Goldfarb M., Schoorlemmer J., Williams A., Diwakar S., Wang Q., Huang X., Giza J., Tchetchik D., Kelley K., Vega A., Matthews G., Rossi P., Ornitz D. M., D'Angelo E. ( 2007) Neuron 55, 449– 463 [DOI] [PMC free article] [PubMed] [Google Scholar]
- 20.Wittmack E. K., Rush A. M., Craner M. J., Goldfarb M., Waxman S. G., Dib-Hajj S. D. ( 2004) J. Neurosci. 24, 6765– 6775 [DOI] [PMC free article] [PubMed] [Google Scholar]
- 21.Brusse E., de Koning I., Maat-Kievit A., Oostra B. A., Heutink P., van Swieten J. C. ( 2006) Movement Disorders 21, 396– 401 [DOI] [PubMed] [Google Scholar]
- 22.Dalski A., Atici J., Kreuz F. R., Hellenbroich Y., Schwinger E., Zühlke C. ( 2005) Eur. J. Hum. Genet. 13, 118– 120 [DOI] [PubMed] [Google Scholar]
- 23.van Swieten J. C., Brusse E., de Graaf B. M., Krieger E., van de Graaf R., de Koning I., Maat-Kievit A., Leegwater P., Dooijes D., Oostra B. A., Heutink P. ( 2003) Am. J. Hum. Genet. 72, 191– 199 [DOI] [PMC free article] [PubMed] [Google Scholar]
- 24.Ferrero G. B., Gebbia M., Pilia G., Witte D., Peier A., Hopkin R. J., Craigen W. J., Shaffer L. G., Schlessinger D., Ballabio A., Casey B. ( 1997) Am. J. Hum. Genet. 61, 395– 401 [DOI] [PMC free article] [PubMed] [Google Scholar]
- 25.Gecz J., Baker E., Donnelly A., Ming J. E., McDonald-McGinn D. M., Spinner N. B., Zackai E. H., Sutherland G. R., Mulley J. C. ( 1999) Hum. Genet. 104, 56– 63 [DOI] [PubMed] [Google Scholar]
- 26.Gedeon A. K., Glass I. A., Connor J. M., Mulley J. C. ( 1996) Am. J. Med. Genet. 64, 121– 124 [DOI] [PubMed] [Google Scholar]
- 27.Malmgren H., Sundvall M., Dahl N., Gustavson K. H., Annerén G., Wadelius C., Steén-Bondeson M. L., Pettersson U. ( 1993) Am. J. Hum. Genet. 52, 1046– 1052 [PMC free article] [PubMed] [Google Scholar]
- 28.Shiloh Y., Litvak G., Ziv Y., Lehner T., Sandkuyl L., Hildesheimer M., Buchris V., Cremers F. P., Szabo P., White B. N. ( 1990) Am. J. Hum. Genet. 47, 20– 27 [PMC free article] [PubMed] [Google Scholar]
- 29.Nishimoto S., Nishida E. ( 2007) J. Biol. Chem. 282, 24255– 24261 [DOI] [PubMed] [Google Scholar]
- 30.Wang Q., Bardgett M. E., Wong M., Wozniak D. F., Lou J., McNeil B. D., Chen C., Nardi A., Reid D. C., Yamada K., Ornitz D. M. ( 2002) Neuron 35, 25– 38 [DOI] [PubMed] [Google Scholar]
- 31.Wozniak D. F., Xiao M., Xu L., Yamada K. A., Ornitz D. M. ( 2007) Neurobiol. Dis. 26, 14– 26 [DOI] [PMC free article] [PubMed] [Google Scholar]
- 32.Shakkottai V. G., Xiao M., Xu L., Wong M., Nerbonne J. M., Ornitz D. M., Yamada K. A. ( 2009) Neurobiol. Dis. 33, 81– 88 [DOI] [PMC free article] [PubMed] [Google Scholar]
- 33.Xiao M., Xu L., Laezza F., Yamada K., Feng S., Ornitz D. M. ( 2007) Mol. Cell. Neurosci. 34, 366– 377 [DOI] [PubMed] [Google Scholar]
- 34.Otwinowski Z., Minor W. ( 1997) Methods Enzymol. 276, 307– 326 [DOI] [PubMed] [Google Scholar]
- 35.Navaza J., Saludjian P. ( 1997) Methods Enzymol. 276, 581– 594 [DOI] [PubMed] [Google Scholar]
- 36.Jones T. A., Zou J. Y., Cowan S. W., Kjeldgaard M. ( 1991) Acta Crystallogr. A 47, 110– 119 [DOI] [PubMed] [Google Scholar]
- 37.Brünger A. T., Adams P. D., Clore G. M., DeLano W. L., Gros P., Grosse-Kunstleve R. W., Jiang J. S., Kuszewski J., Nilges M., Pannu N. S., Read R. J., Rice L. M., Simonson T., Warren G. L. ( 1998) Acta Crystallogr. D Biol. Crystallogr. 54, 905– 921 [DOI] [PubMed] [Google Scholar]
- 38.Laezza F., Gerber B. R., Lou J. Y., Kozel M. A., Hartman H., Craig A. M., Ornitz D. M., Nerbonne J. M. ( 2007) J. Neurosci. 27, 12033– 12044 [DOI] [PMC free article] [PubMed] [Google Scholar]
- 39.Liu C. J., Dib-Hajj S. D., Waxman S. G. ( 2001) J. Biol. Chem. 276, 18925– 18933 [DOI] [PubMed] [Google Scholar]
- 40.Liu C. J., Dib-Hajj S. D., Renganathan M., Cummins T. R., Waxman S. G. ( 2003) J. Biol. Chem. 278, 1029– 1036 [DOI] [PubMed] [Google Scholar]
- 41.Dill K. A. ( 1985) Biochemistry 24, 1501– 1509 [DOI] [PubMed] [Google Scholar]
- 42.Lawrence M. C., Colman P. M. ( 1993) J. Mol. Biol. 234, 946– 950 [DOI] [PubMed] [Google Scholar]
- 43.Boehm M. K., Corper A. L., Wan T., Sohi M. K., Sutton B. J., Thornton J. D., Keep P. A., Chester K. A., Begent R. H., Perkins S. J. ( 2000) Biochem. J. 346, 519– 528 [PMC free article] [PubMed] [Google Scholar]
- 44.Loll P. J., Swain E., Chen Y., Turner B. T., Zhang J. F. ( 2008) Acta Crystallogr. Sect. F Struct. Biol. Cryst. Commun. 64, 243– 246 [DOI] [PMC free article] [PubMed] [Google Scholar]
- 45.Pathak M. M., Yarov-Yarovoy V., Agarwal G., Roux B., Barth P., Kohout S., Tombola F., Isacoff E. Y. ( 2007) Neuron 56, 124– 140 [DOI] [PubMed] [Google Scholar]
Associated Data
This section collects any data citations, data availability statements, or supplementary materials included in this article.


