Abstract
False positives that arise when MS/MS data are used to search protein sequence databases remain a concern in proteomics research. Here we present five types of false positives identified when aligning sequences to MS/MS spectra by Mascot database searching software. False positives arise because of 1) enzymatic digestion at abnormal sites; 2) misinterpretation of charge states; 3) misinterpretation of protein modifications; 4) incorrect assignment of the protein modification site; and 5) incorrect use of isotopic peaks. We present examples, clearly identified as false positives by manual inspection, that nevertheless were assigned high scores by Mascot sequence alignment algorithm. In some examples, the sequence assigned to the MS/MS spectrum explains more than 80% of the fragment ions present. Because of high sequence similarity between the false positives and their corresponding true hits, the false positive rate cannot be evaluated by the common method of using a reversed or scrambled sequence database. A common feature of the false positives is the presence of unmatched peaks in the MS/MS spectra. Our studies highlight the importance of using unmatched peaks to remove false positives and offer direction to aid development of better sequence alignment algorithms for peptide and PTM identification.
Keywords: protein identification, manual verification, automated database search
Introduction
Tandem mass spectrometry (MS/MS) is the method of choice for identifying and quantifying proteins, largely due to its unparalleled sensitivity and the speed at which fragment mass fingerprints can be generated.1 In a typical experiment, a proteolytic digest of interest is subjected to LC/MS/MS analysis to generate MS/MS spectra of individual peptides. The resulting MS/MS data are used in an automated search of a protein sequence database to find the peptide that most closely matches each observed spectrum. During the sequence alignment, the experimentally generated MS/MS spectrum is compared to the theoretical MS/MS spectrum of each peptide in the database and a score, representing the degree of correlation, is calculated for each peptide. Several algorithms have been developed for protein sequence alignment and are currently in widespread use, including SEQUEST,2 PepSea,3 Mascot,4 Sonar,5 ProbID,6 Popitam,7 and Tandem.8 In addition to the 20 ribosomally encoded amino acids, information about protein modification and isotopic labeling (e.g., ICAT or I-DIRT/SILAC/AACT) can be included into the database search for protein quantification and protein modification sites mapping.9–15
A major problem associated with these automated search algorithms is the appearance of false positive hits caused by random matching between the experimental and theoretical data.5, 16–21 To reduce the number of false positives, different statistical strategies have been developed.19, 22–24 Unfortunately, the reliability of these strategies has not been critically evaluated, as could be done, for example, by testing them with highly stringent manual verification, or with MS/MS of synthetic peptides, the gold standard for confirming peptide identification. Accordingly, despite efforts to reduce their incidence, false positives remain a concern in shotgun proteomics. The problem is more serious when non-restrictive sequence alignment is carried out to identify all possible modifications in a substrate protein.
We argue that a true peptide identification should explain all major peaks in the MS/MS spectrum.25 Based on this rationale, we developed systematic manual verification rules to remove false positives.25 A common feature of false positives is the presence of unmatched peaks in the MS/MS spectra. During the course of our routine work of manually verifying protein identifications obtained from protein sequence database searches by Mascot software, we have encountered several recurring types of false positives. Here we report five types of false positives that cannot be easily eliminated by statistical methods in Mascot software or evaluated by reversing or scrambling the sequence database, as their sequences share with the true peptide identifications. Our case studies provide insights into false positives of peptide and PTM identification, highlight the importance of careful inspection of MS/MS spectra to ensure accuracy of peptide identification, and offer direction for development of better methods for removing false positives. Our results also suggest that emphasis should be placed on the unmatched peaks in MS/MS spectra to identify the false positives during protein sequence database searching.
Materials and Methods
In-gel and in-solution digestion of proteins
Proteins of interests were digested in-gel or in-solution. Briefly, for in-gel digestion, protein bands from SDS-PAGE were cut into small pieces and washed with 25 mM ammonium bicarbonate buffer (ethanol:water = 50:50, v/v) three times for 10 min each time. Then the gel pieces were washed with acetic acid buffer (acetic acid:ethanol:water = 10:50:40, v/v/v) three times for 1 hour each time, followed by washing with water twice for 20 min each time. Gel pieces were then dehydrated by acetonitrile and dried in Speed-vac (ThermoFisher, Waltham, MA). About 100 ng of modified porcine trypsin (Promega, Madison, WI) in 50 mM ammonium bicarbonate solution was added to each sample, followed by overnight incubation at 37°C. Tryptic peptides were extracted by acetonitrile buffer 1 (TFA:acetonitrile:water = 5:50:45, v/v/v) and buffer 2 (TFA:acetonitrile:water = 0.1:75:24.9, v/v/v) sequentially. The pooled extracts were dried in Speed-vac and desalted using Ziptip (Millipore, Bedford, MA) prior to HPLC/MS/MS analysis. For in-solution digestion, proteins of interest were dissolved in 50 mM ammonium bicarbonate solution and trypsin was added at 1:50 enzyme-to-substrate ratio (w/w) for overnight incubation at 37°C. Tryptic peptides were dried in Speed-vac and desalted prior to HPLC/MS/MS analysis.
HPLC/MS/MS analysis
Solution-digested or in-gel-digested proteins were used in the described experiments. HPLC/MS/MS analysis of tryptic peptides was performed using an integrated system that includes an Agilent 1100 series nanoflow LC system (Agilent, Palo Alto, CA) and an LTQ 2D trap mass spectrometer (Thermo Electron, Waltham, MA) equipped with a nanoelectrospray ionization source. Tryptic peptides in buffer A (97.9% water/2% acetonitrile/0.1% acetic acid) (v/v/v) were separated after manual injection into a capillary HPLC column (11 mm length × 75 µm I.D.) packed in-house with Luna C18 resin (5 µm particle size, 100 Å pore diameter) or Jupiter C12 resin (4 µm particle size, 90 Å pore diameter) (Phenomenex, Torrance, CA). Peptides were eluted from the column with a gradient of 2% to 90% buffer B (90% acetonitrile/9.9% water/0.1% acetic acid) (v/v/v) in a 2 h LC/MS/MS analysis. The eluted peptides were electrosprayed directly into the LTQ ion trap mass spectrometer. LC/MS/MS was operated in a data-dependent mode such that the ten strongest ions in each MS scan were subjected to collisionally activated dissociation (CAD) with a normalized CAD energy of 32%.
Protein sequence database searching and manual verification
All tandem mass spectra were searched against the NCBI-nr database with the Mascot search engine (version 2.1, Matrix Science, London, U.K.). Trypsin was specified as the proteolytic enzyme and up to 6 missing cleavages were allowed. Oxidation of methionine and one or more of the following modifications were set as variables: acetylation, propionylation and butyrylation of lysine; phosphorylation of serine, threonine and tyrosine; methylation of aspartic acid and glutamic acid; and deamidation of asparagine and glutamine. Charge states of +1, +2 or +3 were considered for parent ions. Mass tolerance was set to ±4.0 Da for parent ion masses and ±0.6 Da for fragment ion masses. Peptides identified with a Mascot score of 30 or above were manually verified by the method previously described.25
Results
We argue that a true peptide identification should explain all major fragment peaks in an MS/MS spectrum. Based on this rationale, false positives can be easily identified by manual inspection of MS/MS spectra. We routinely identify false positives that were given high statistical scores by the search algorithm. Here we present five types of commonly observed false positives identified by the Mascot algorithm with high statistical scores.
Enzymatic digestion at abnormal sites
In shotgun proteomics, a protein mixture of interest is usually digested with trypsin. Preparations of trypsin will not only have canonical tryptic activity, cleaving a protein at the C-terminal side of lysine and arginine residues, but will also have weak chymotryptic activity, resulting in cleavage of the peptide bond C-terminal to aromatic or hydrophobic residues such as phenylalanine, tryptophan, tyrosine, leucine and methionine. The chymotryptic activity of trypsin can increase during the course of the incubation, as the enzyme is auto-digested. Accordingly, digestion with trypsin usually generates chymotryptic peptides, the abundance of which depends on trypsin quality, amount of trypsin used, trypsin-to-substrate ratio, and digestion time. When chymotrypsin is not included as a digestion enzyme during a protein sequence database search, the algorithm can assign a high statistical score to a tryptic peptide from the database matched with the MS/MS spectrum of a peptide that arose because of chymotryptic digestion at one or both ends.
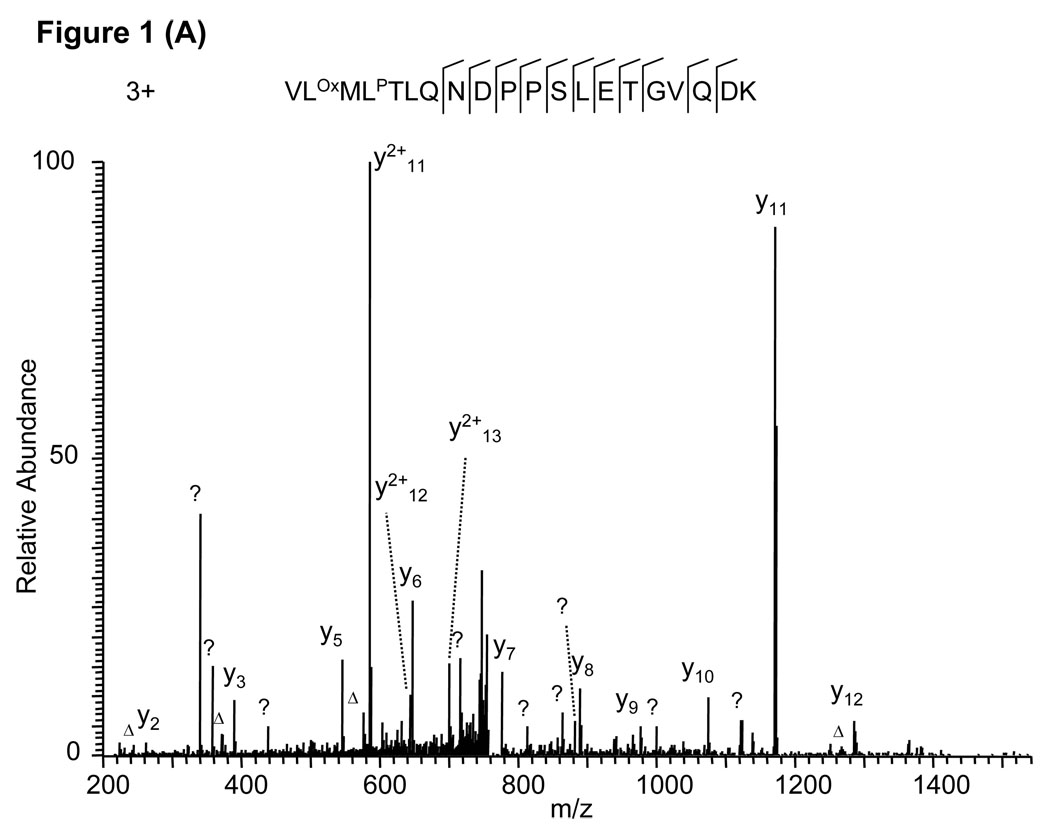
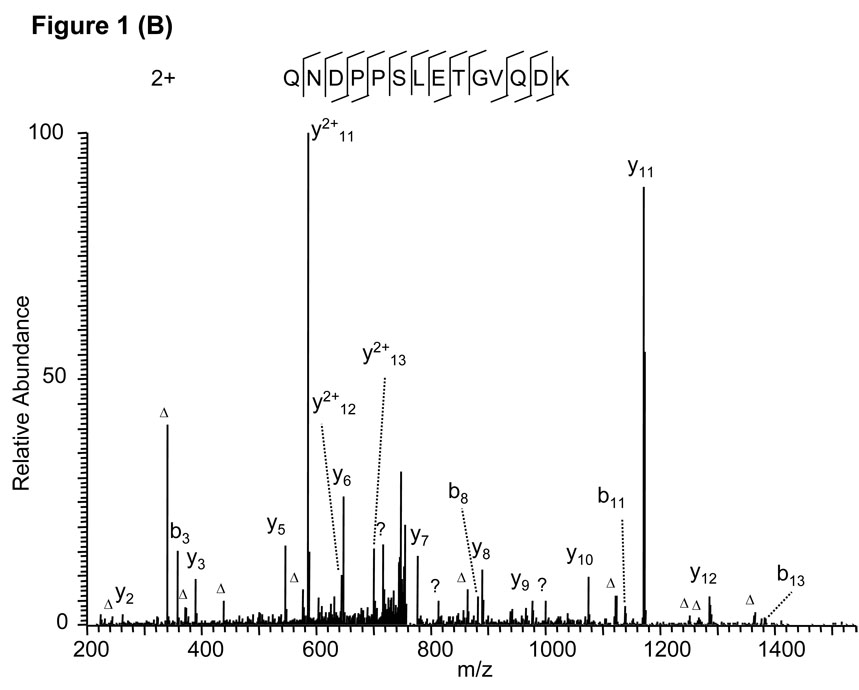
As an example, protein sequence database searching using the MS/MS spectrum in Fig. 1A identified the triply charged tryptic peptide VLOxMLPTLQNDPPSLETGVQDK with Mascot score 36. Careful inspection of the spectrum discovered three problems with the peptide identification. First, the b series of fragment ions are completely missing, which does not usually happen for a tryptic peptide with a lysine residue at the C-terminus. Second, one of the major ions (at m/z 340) could not be assigned. Third, a triply charged peptide was assigned, even though only one basic amino acid residue (K) is present in the peptide sequence. When chymotryptic digestion was considered, the molecular weight matched a doubly charged peptide, QNDPPSLETGVQDK. The peptide could explain all fragment ions in the spectrum (Fig. 1B). Accordingly, the second peptide should be considered the correct identification for the MS/MS spectrum.
Figure 1.
False peptide identification caused by enzymatic digestion at an abnormal site. (A) Assignment of an MS/MS spectrum with a triply charged peptide, VLOxMLPTLQNDPPSLETGVQDK, which was identified by Mascot with Mascot score of 36. (B) Assignment of the same MS/MS spectrum with a doubly charged peptide, QNDPPSLETGVQDK, identified by manual inspection. The labels b and y designate the N- and C-terminal fragment ions, respectively, of the peptide produced by breakage at the peptide bond in the mass spectrometer. The label a designates N-terminal fragments produced by breakage at the backbone C-C bond adjacent to the peptide bond. The subscripted number in each label represents the number of N- or C-terminal residues present in the peptide fragment. The label Δ designates b, y or a ions with loss of water, ammonia or both. All unassigned peaks with relative intensity more than 5% of the base peak are labeled with a question mark. The same nomenclature system is used for all the other figures.
Assignment of incorrect charge states for peptide ions
The second common type of false positive in peptide identification is assigning the wrong charge state to peptide ions. Low-resolution mass spectrometers generate MS and MS/MS spectra with low mass accuracy, which sometimes prevents identification of the proper charge state of peptide ions, possibly leading to incorrect peptide identification.
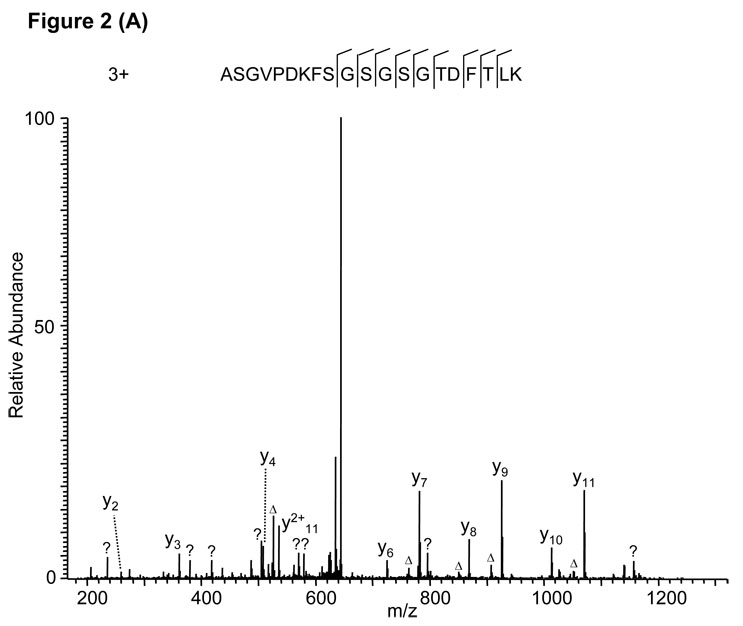
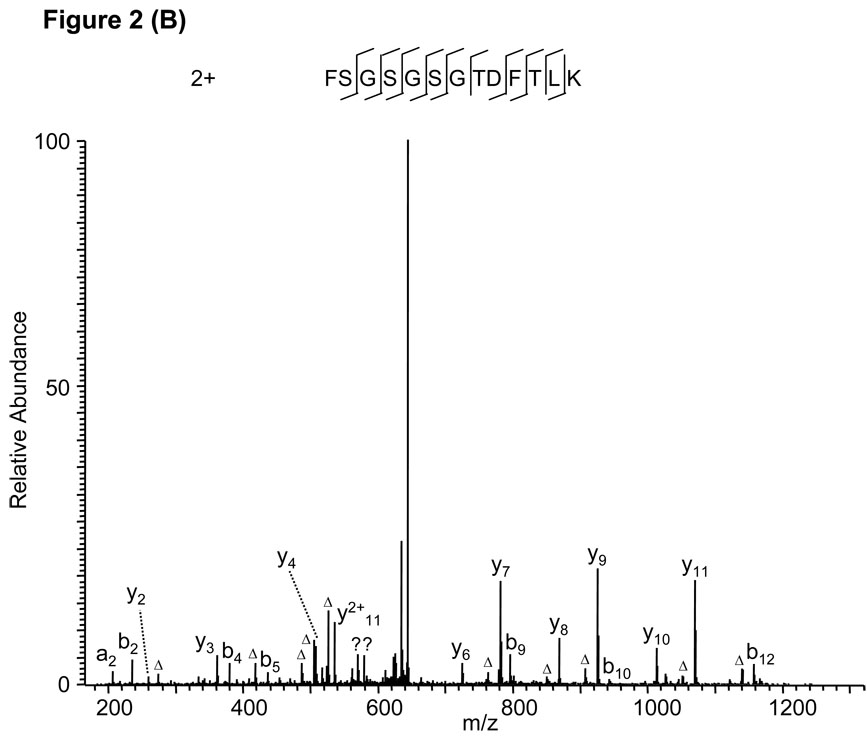
Protein sequence alignment of the MS/MS spectrum in Fig. 2A led to the identification of a triply charged peptide, ASGVPDKFSGSGSGTDFTLK, with a Mascot score of 39. Careful inspection of the MS/MS spectrum suggested two problems with the peptide identification. First, no b ions are present, and second, several significant peaks in the high mass range (between m/z 560 and 1160) were not assigned. Repetition of the sequence alignment with Mascot after adjustment of the charge state from +3 to +2 led to identification of a doubly charged peptide, FSGSGSGTDFTLK, which can explain all major peaks in the MS/MS spectrum (Fig. 2B), and the identification was confirmed by the fragmentation of the synthetic peptide (Supplemental Figure S1A).
Figure 2.
False peptide identification due to misinterpretation of charge states. (A) Assignment of MS/MS spectrum with a triply charged peptide, ASGVPDKFSGSGSGTDFTLK, identified by the Mascot algorithm with a Mascot score of 39. (B) Assignment of the same MS/MS spectrum with a doubly charged peptide, FSGSGSGTDFTLK by the Mascot algorithm with Mascot score of 71.
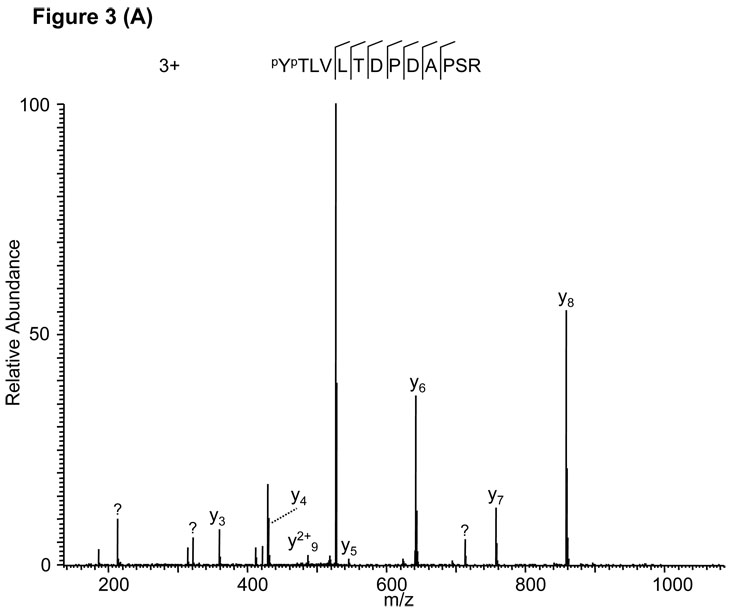
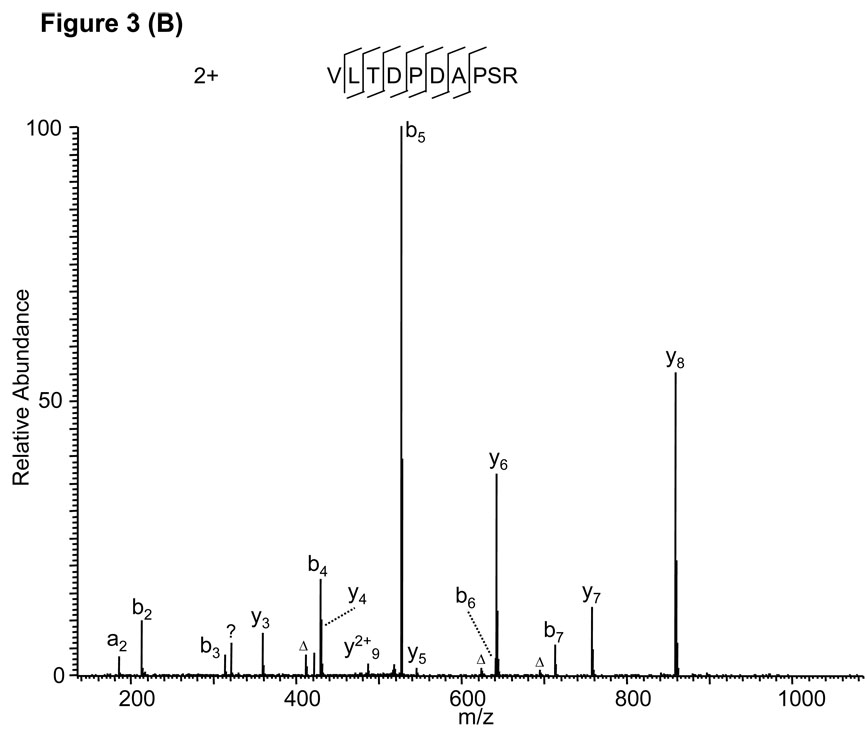
Likewise, a Mascot search assigned a triply charged peptide, PYPTLVLTDPDAPSR, to the MS/MS spectrum in Fig. 3A. Adjustment of the charge state from +3 to +2 led to identification of the doubly charged peptide VLTDPDAPSR (Fig. 3B) which was also confirmed by the fragmentation of the synthetic peptide (Supplemental Figure S1B). An additional example of this type of false positive is presented in Supplemental Figure S2 and Figure S1C.
Figure 3.
False peptide identification caused by misinterpretation of charge state and modifications. (A) Assignment of an MS/MS spectrum with a triply charged peptide, PYPTLVLTDPDAPSR, by the Mascot algorithm with a Mascot score of 32. (B) Assignment of the same MS/MS spectrum with a doubly charged unmodified VLTDPDAPSR with a Mascot score of 51.
Assignment of false protein modifications
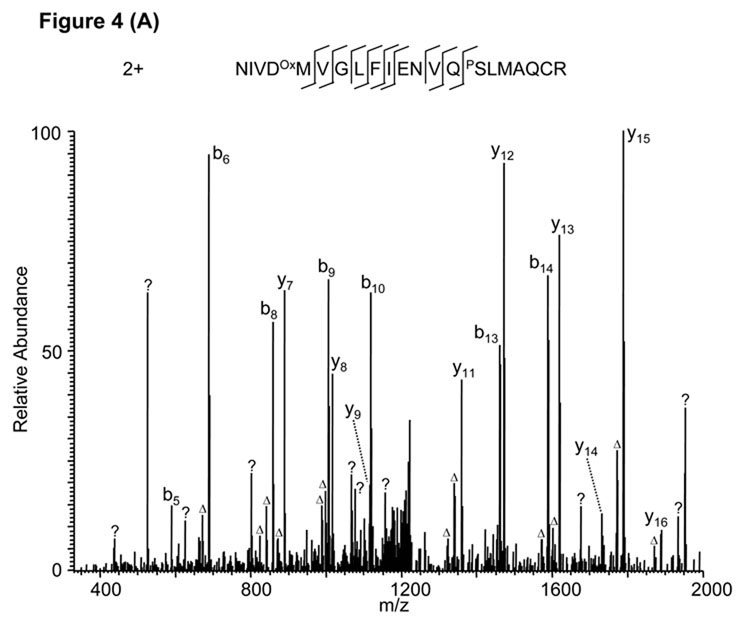
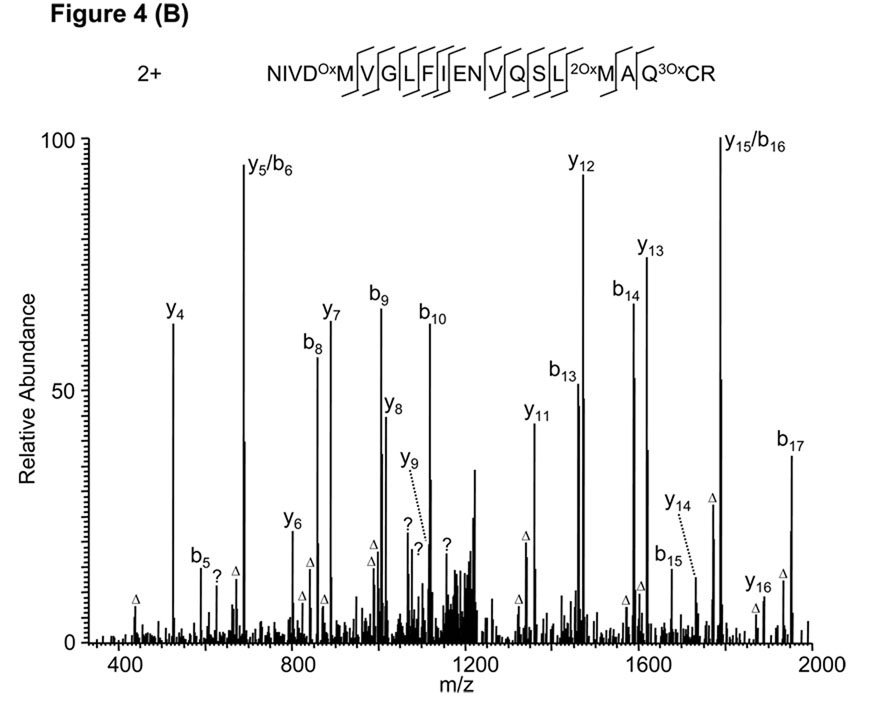
A protein can potentially be modified by more than 300 different types of post-translational modifications, some of which have similar mass shifts.26 In addition, the mass shift caused by a single protein modification can be similar to the sum of the shifts caused by two or more smaller modifications. As an example, a Mascot search of an MS/MS spectrum identified a doubly charged tryptic peptide, NIVDOxMVGLFIENVQPSLMAQCR (Fig. 4A), with a Mascot score of 35. Nevertheless, the peptide sequence cannot explain two major peaks (m/z 525 and 1952.8) and several minor ones in the MS/MS spectrum. Careful manual inspection and some calculations led to identification of a doubly charged peptide, NIVDOxMVGLFIENVQSL2OxMAQ3OxCR (Fig. 4B). The false alignment was caused by the two unexpected modifications of double oxidation at methionine and sulfation at cysteine. The two oxygen atoms added to Met-17 and the three oxygen atoms added to Cys-20 add a total of 80 units to the peptide’s mass, the same value as the mass shift of a phosphate group. This example demonstrates that a large number of matched daughter ions (28 ions in Fig. 4A) does not necessarily indicate a true peptide identification if unmatched peaks with high intensities exist in the spectrum.
Figure 4.
False peptide identification caused by false protein modification assignment. (A) Assignment of an MS/MS spectrum with a doubly charged peptide, NIVDOxMVGLFIENVQPSLMAQCR, identified by Mascot with a score of 35. (B) Assignment of the same MS/MS spectrum with a doubly charged peptide, NIVDOxMVGLFIENVQSL2OxMAQ3OxCR, identified by manual inspection.
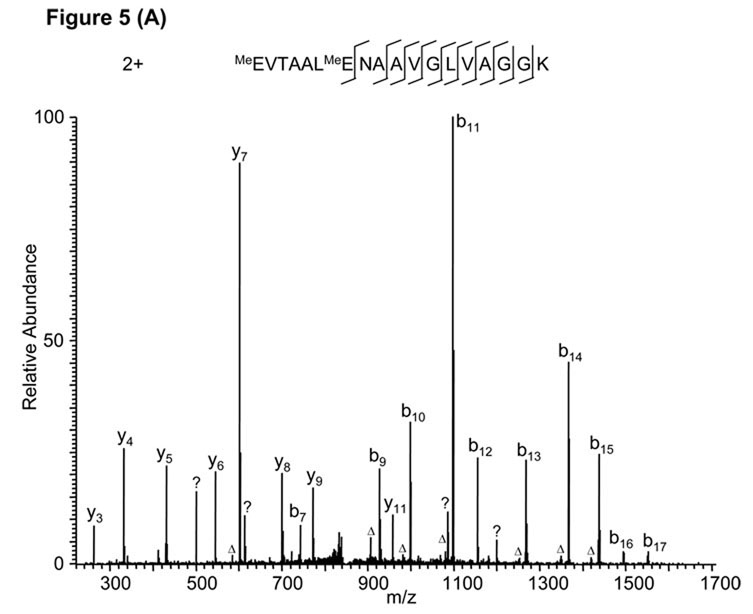
In another example, a Mascot search using the MS/MS spectrum in Fig. 5A identified a doubly charged peptide, MeEVTAALMeENAAVGLVAGGK, when D/E protein methylation was specified. Though most of the daughter ions in the spectrum could be explained by the peptide sequence, a series of minor peaks remained unassigned. In addition, no fragment ions (either b or y ions) related to the sequence were found between the modified residues (Glu-1 and Glu-7). Careful inspection of the mass spectrum suggested an unexpected modification, ethylation at the side chain of the first Glu residue. The new peptide sequence, EtEVTAALENAAVGLVAGGK, explained almost all the peaks in the MS/MS spectrum (Fig. 5B). In addition, a series of b ions (b3 to b6) emerged in the N-terminal region of the peptide, and two more y ions (y12, y13) were assigned to the first six amino acid residues. Therefore, the correct peptide identification is EtEVTAALENAAVGLVAGGK. Ethylation of the Glu side chain likely occurred during gel staining, which involved incubation in the presence of ethanol.
Figure 5.
False peptide identification caused by false modification assignment and unexpected modification. (A) Assignment of an MS/MS spectrum with a doubly charged peptide, MeEVTAALMeENAAVGLVAGGK, identified by Mascot with a score of 57. (B) Assignment of the same MS/MS spectrum with a doubly charged peptide, EtEVTAALENAAVGLVAGGK, identified by manual inspection.
Assignment of ambiguous protein modification sites
Precise mapping of the sites of modification within a modified peptide can be challenging, because peptides that differ only by the modification site give highly similar theoretical fragmentation patterns and lead to similar statistical scores. Moreover, some types of protein modification can occur on different amino acid side chains. For example, protein methylation can be present at eight of the twenty ribosomally encoded amino acid residues (K, R, D, E, H, D, N, C); together these residues account for almost 50% of the residues in a typical peptide.27
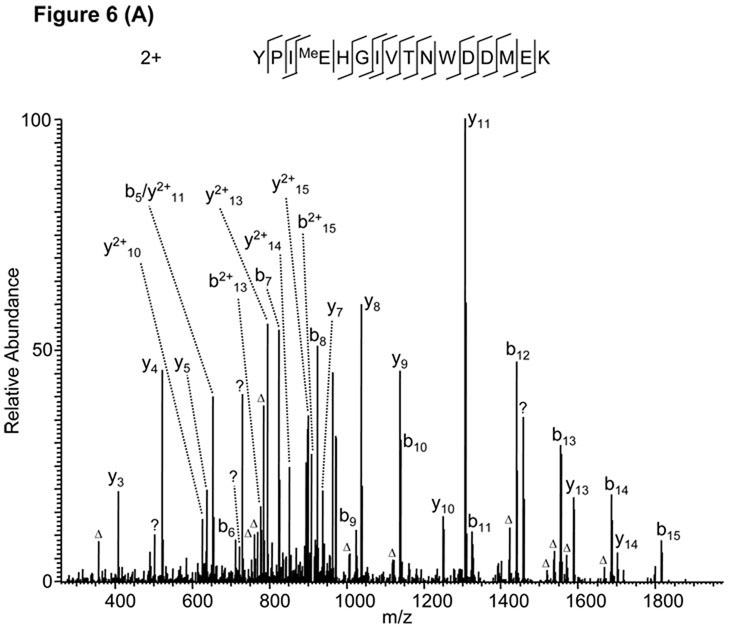
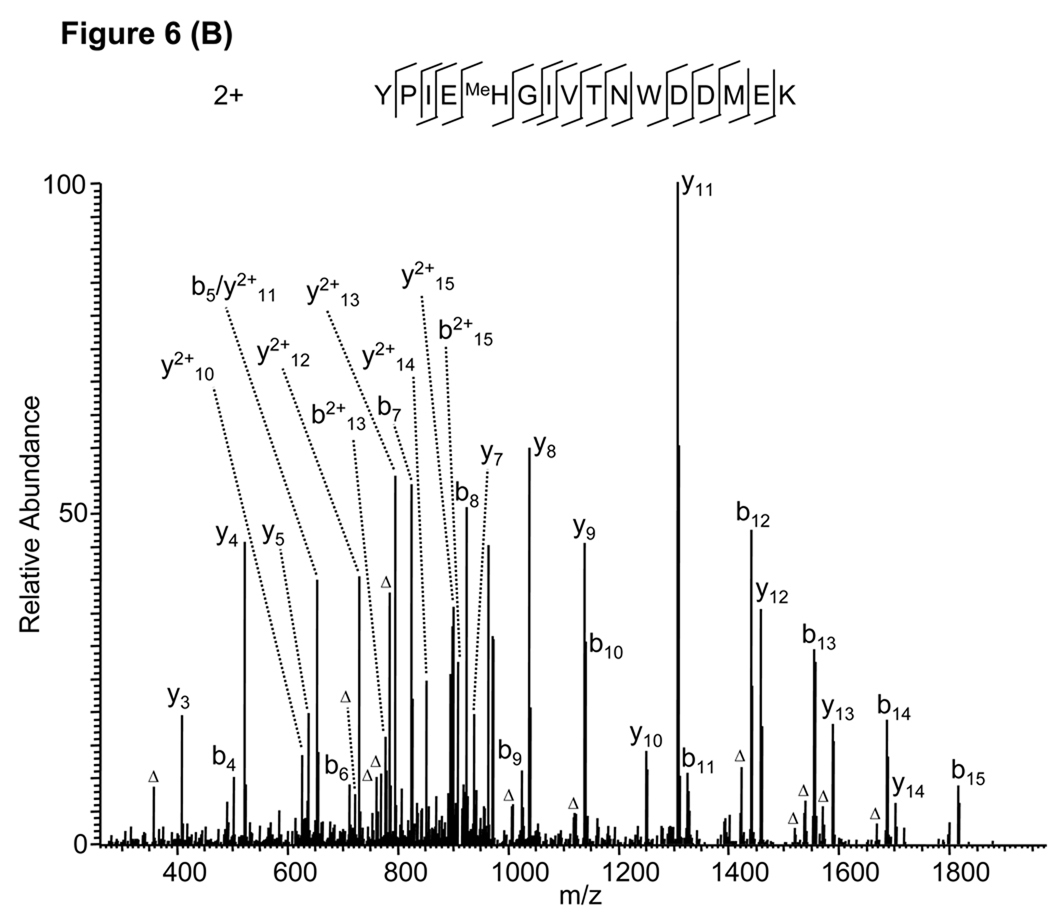
In one analysis, Mascot identified an MS/MS spectrum as an E-methylated peptide “YPIMeEHGIVTNWDDMEK” from human actin (gi|14250401) (Fig. 6A) when D, E methylation were specified as variable modifications. Almost all the major peaks (~90%) can be assigned by the software with the exception of only three peaks. Such high-quality sequence alignment lead to very confident identification with Mascot score of 54. However, after careful examination of the peptide sequence and the MS/MS spectrum, we realized that the MS/MS spectrum cannot exclusively localize the +14 Da mass shift on the E-4 residue raising the possibility that the PTM assignment was false positive due to misassignment of PTM site. Indeed, manual verification suggested that the MS/MS spectrum comes from the peptide isoform “YPIEMeHGIVTNWDDMEK” with methylation on H-5 instead of E-4, which can fully explain all the three unassigned peaks with significant intensity (Fig. 6B).
Figure 6.
False peptide identification caused by misassignment of modification site. (A) Assignment of an MS/MS spectrum with a doubly charged peptide, YPIMeEHGIVTNWDDMEK, identified by Mascot with a score of 54. (B) Assignment of the same MS/MS spectrum with a doubly charged peptide, YPIEMeHGIVTNWDDMEK, identified by manual inspection.
Incorrect use of isotopic peaks
For peptide identification, all protein sequence database search algorithms use monoisotopic peaks, which are one or two Da different from other peaks in the associated isotopic distribution. Unfortunately, some protein modifications only result in a mass shift of one or two Da, which cannot be distinguished from isotopic peaks in low-resolution mass spectrometers. For example, deamidation of asparagine and glutamine are common protein modifications, which result in a one-Da increase in the mass of the residues. In addition, some amino acid pairs differ in mass by only one or two Da. Accordingly, mistaking a peak within the isotopic distribution for the monoisotopic peak can lead to incorrect identification of protein modifications or peptide sequences.
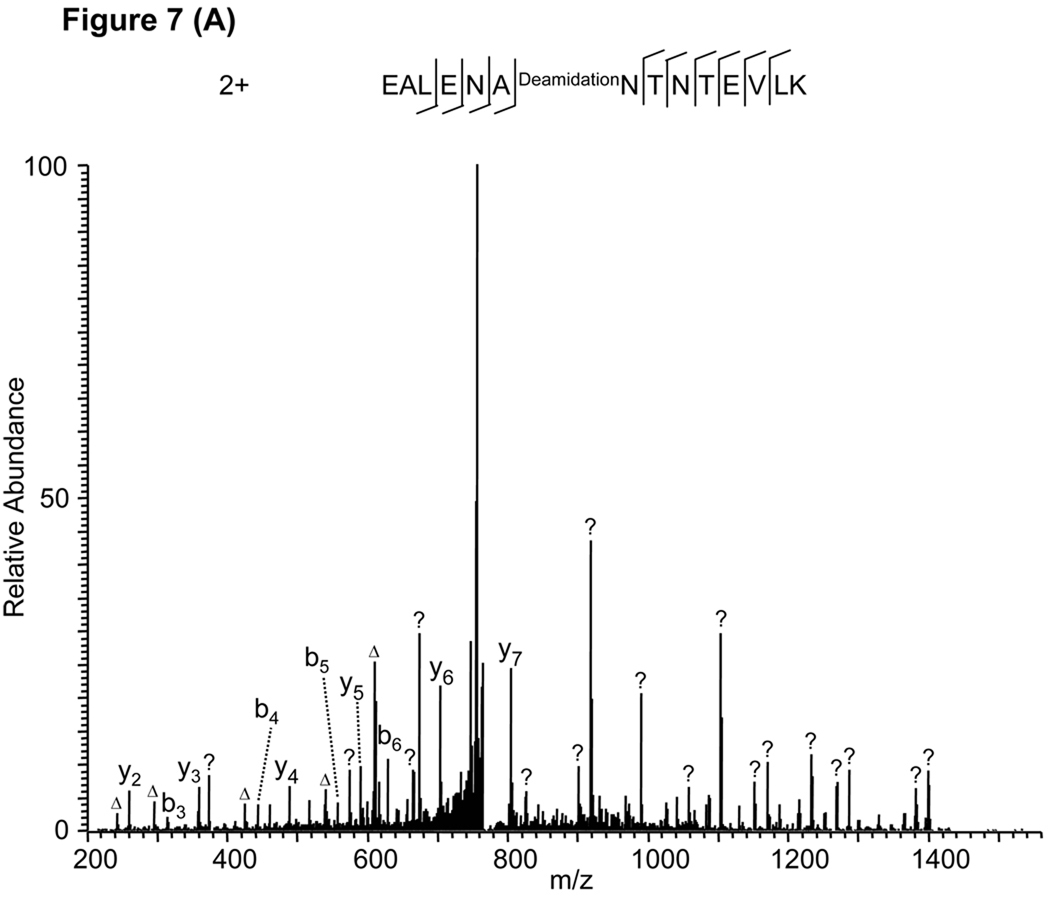
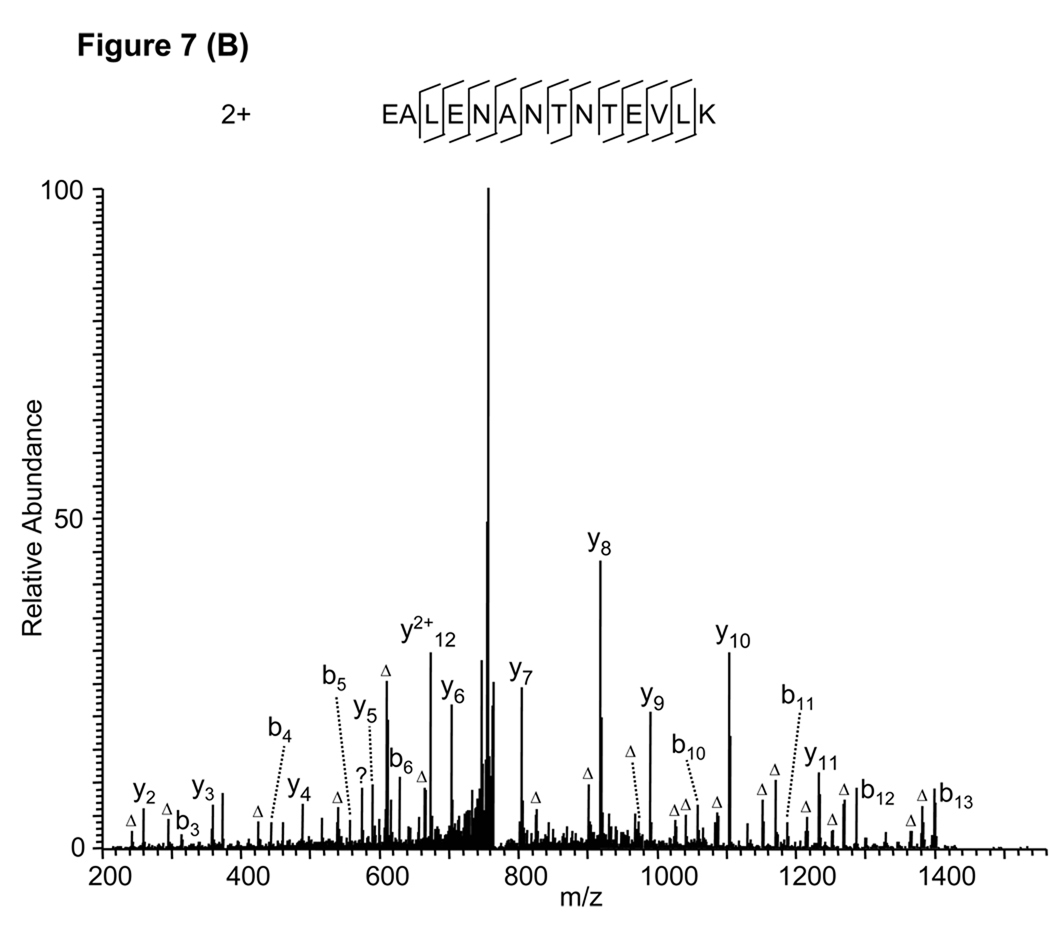
As an example, a Mascot sequence alignment using the MS/MS spectrum in Figure 7A and allowing deamidation of N and Q residues identified a deaminated peptide, EALENADeamidationNTNTEVLK (Fig. 7A) with a Mascot score of 70. However, manual verification found that the peptide sequence could explain almost none of the peaks in the high mass region, unless the isotopic peaks were used (Fig. 7A). This observation suggests that the algorithm incorrectly used higher isotopic peaks instead of monoisotopic peaks during the peptide identification. All the peaks in the MS/MS spectrum can be explained by the unmodified peptide, EALENANTNTEVLK (Fig. 7B), and the identification was confirmed by the synthetic peptide (Supplemental Figure S1D). A similar example is provided in Supplemental Figure S3.
Figure 7.
False peptide identification caused by use of peaks from the isotopic distribution. (A) Assignment of an MS/MS spectrum with a doubly charged peptide, EALENADeamidationNTNTEVLK, by Mascot with a score of 70. (B) Assignment of the same MS/MS spectrum with a doubly charged unmodified peptide, EALENANTNTEVLK, identified by manual inspection.
Summary
We present five common types of false positive peptide and PTM identifications that arise during sequence alignment of MS/MS data using Mascot search engine, one of the most popular sequence alignment software. Our case studies by careful manual analysis suggest that these false positive can have a high statistical score, but cannot be completely eliminated by Mascot algorithm. In all the cases shown, the incorrectly identified peptide sequences share significant sequence similarity to the correct peptide sequences. Accordingly, these misidentifications are not random events and their incidences cannot be estimated by the methods commonly used to evaluate false positive rates, such as reversing or scrambling protein sequence databases. It is important to note that although the analysis was performed on the data generated by Mascot software, it is possible that the similar false positive identifications can also be found in the data generated by other sequence alignment softwares.
A feature common to all the incorrect peptide assignments is the existence of unmatched peaks with significant intensities. In each example presented here (except the last isotopic case), a significant proportion of fragment ions could be assigned by the false positive peptide (Table 1). Such high numbers of assigned daughter ions usually lead to high scores in the statistics-based methods used for protein identification. Nevertheless, a correctly identified peptide should be able to explain almost all the peaks in the MS/MS spectrum, except in special instances when irregular fragmentations occur. Therefore, we argue that it is more logical to use unmatched peaks rather than matched peaks as an objective matrix to remove false positives.
Table 1.
Frequencies of matched and unmatched ions for the peptides identified by Mascot. All the fragment ions with relative intensity of more than 5% are counted.
Some have used reversed or scrambled protein sequence databases as controls to determine the false positive rate of peptide identification. While useful, these methods are unlikely to reflect the true positive rates. Among all the five types of false positives described here, the peptide sequences of the false positives are over 50% identical to the sequences of the corresponding true hits. These false positives would not be included in the false positive rate calculated by searching a reversed or scrambled protein sequence database. Therefore, false positive rates determined by searching such control databases should be much lower than the actual false positive rate. We believe that this gap will be more significant for searches that include the possibility of protein modifications.
Sequence alignment in which the mass of possible protein modifications is unrestricted has been used to comprehensively map sites of modification.12, 13, 28 Aligning sequences in this way can easily increase the size of the protein sequence database 1,000- to 10,000-fold, which will in turn lead to exponentially increased false positive rates. Establishing a high standard for verifying peptide identifications will be critical to raising the quality of proteomics data. This is especially important when mapping multiple protein modifications.
Our case studies highlight a few future directions for improving algorithms for protein sequence database searching. First, unmatched peaks should be emphasized when evaluating the accuracy of peptide identification. Second, MS/MS spectra should be processed prior to sequence alignment to remove isotope peaks and noise signals with low intensity that are irrelevant to peptide sequence. Third, careful charge state screening of parent and daughter ions are necessary to avoid certain types of false positive identifications from low-resolution MS and MS/MS spectra. Fourth, the identification of post-translational modifications should require the modification site to be completely mapped in a restricted or unrestricted database search. When the fragmentation pattern is not sufficient to accurately localize the site of modification, the sequence alignment score should be reduced accordingly. Incorporation of these features into search algorithms will improve the accuracy of peptide identification and mapping modification sites.
Supplementary Material
Acknowledgements
YZ is supported by NIH (CA 126832).
References
- 1.Aebersold R, Mann M. Mass spectrometry-based proteomics. Nature. 2003;422(6928):198–207. doi: 10.1038/nature01511. [DOI] [PubMed] [Google Scholar]
- 2.Eng JK, McCormack AL, Yates JR., 3rd J. Am. Soc. Mass Spectrom. 1994;5:976–989. doi: 10.1016/1044-0305(94)80016-2. [DOI] [PubMed] [Google Scholar]
- 3.Mann M, Wilm M. Error-tolerant identification of peptides in sequence databases by peptide sequence tags. Anal Chem. 1994;66(24):4390–4399. doi: 10.1021/ac00096a002. [DOI] [PubMed] [Google Scholar]
- 4.Perkins DN, Pappin DJ, Creasy DM, Cottrell JS. Probability-based protein identification by searching sequence databases using mass spectrometry data. Electrophoresis. 1999;20(18):3551–3567. doi: 10.1002/(SICI)1522-2683(19991201)20:18<3551::AID-ELPS3551>3.0.CO;2-2. [DOI] [PubMed] [Google Scholar]
- 5.Field HI, Fenyo D, Beavis RC. RADARS, a bioinformatics solution that automates proteome mass spectral analysis, optimises protein identification, and archives data in a relational database. Proteomics. 2002;2(1):36–47. [PubMed] [Google Scholar]
- 6.Zhang N, Aebersold R, Schwikowski B. ProbID: a probabilistic algorithm to identify peptides through sequence database searching using tandem mass spectral data. Proteomics. 2002;2(10):1406–1412. doi: 10.1002/1615-9861(200210)2:10<1406::AID-PROT1406>3.0.CO;2-9. [DOI] [PubMed] [Google Scholar]
- 7.Hernandez P, Gras R, Frey J, Appel RD. Popitam: towards new heuristic strategies to improve protein identification from tandem mass spectrometry data. Proteomics. 2003;3(6):870–878. doi: 10.1002/pmic.200300402. [DOI] [PubMed] [Google Scholar]
- 8.Craig R, Beavis RC. A method for reducing the time required to match protein sequences with tandem mass spectra. Rapid Commun Mass Spectrom. 2003;17(20):2310–2316. doi: 10.1002/rcm.1198. [DOI] [PubMed] [Google Scholar]
- 9.Bae W, Chen X. Proteomic study for the cellular responses to Cd2+ in Schizosaccharomyces pombe through amino acid-coded mass tagging and liquid chromatography tandem mass spectrometry. Mol Cell Proteomics. 2004;3(6):596–607. doi: 10.1074/mcp.M300122-MCP200. [DOI] [PubMed] [Google Scholar]
- 10.Tackett AJ, DeGrasse JA, Sekedat MD, Oeffinger M, Rout MP, Chait BT. I-DIRT, a general method for distinguishing between specific and nonspecific protein interactions. J Proteome Res. 2005;4(5):1752–1756. doi: 10.1021/pr050225e. [DOI] [PubMed] [Google Scholar]
- 11.Yates JR, 3rd, Eng JK, McCormack AL, Schieltz D. Method to correlate tandem mass spectra of modified peptides to amino acid sequences in the protein database. Anal Chem. 1995;67(8):1426–1436. doi: 10.1021/ac00104a020. [DOI] [PubMed] [Google Scholar]
- 12.Pevzner PA, Mulyukov Z, Dancik V, Tang CL. Efficiency of database search for identification of mutated and modified proteins via mass spectrometry. Genome Res. 2001;11(2):290–299. doi: 10.1101/gr.154101. [DOI] [PMC free article] [PubMed] [Google Scholar]
- 13.Liebler DC, Hansen BT, Davey SW, Tiscareno L, Mason DE. Peptide sequence motif analysis of tandem MS data with the SALSA algorithm. Anal Chem. 2002;74(1):203–210. doi: 10.1021/ac0155512. [DOI] [PubMed] [Google Scholar]
- 14.Gygi SP, Rist B, Gerber SA, Turecek F, Gelb MH, Aebersold R. Quantitative analysis of complex protein mixtures using isotope-coded affinity tags. Nat Biotechnol. 1999;17(10):994–999. doi: 10.1038/13690. [DOI] [PubMed] [Google Scholar]
- 15.Ong SE, Blagoev B, Kratchmarova I, Kristensen DB, Steen H, Pandey A, Mann M. Stable isotope labeling by amino acids in cell culture, SILAC, as a simple and accurate approach to expression proteomics. Mol Cell Proteomics. 2002;1(5):376–386. doi: 10.1074/mcp.m200025-mcp200. [DOI] [PubMed] [Google Scholar]
- 16.MacCoss MJ, Wu CC, Yates JR., 3rd Probability-based validation of protein identifications using a modified SEQUEST algorithm. Anal Chem. 2002;74(21):5593–5599. doi: 10.1021/ac025826t. [DOI] [PubMed] [Google Scholar]
- 17.Eriksson J, Chait BT, Fenyo D. A statistical basis for testing the significance of mass spectrometric protein identification results. Anal Chem. 2000;72(5):999–1005. doi: 10.1021/ac990792j. [DOI] [PubMed] [Google Scholar]
- 18.Eriksson J, Fenyo D. A model of random mass-matching and its use for automated significance testing in mass spectrometric proteome analysis. Proteomics. 2002;2(3):262–270. doi: 10.1002/1615-9861(200203)2:3<262::aid-prot262>3.0.co;2-w. [DOI] [PubMed] [Google Scholar]
- 19.Eriksson J, Fenyo D. Probity: a protein identification algorithm with accurate assignment of the statistical significance of the results. J Proteome Res. 2004;3(1):32–36. doi: 10.1021/pr034048y. [DOI] [PubMed] [Google Scholar]
- 20.Resing KA, Meyer-Arendt K, Mendoza AM, Aveline-Wolf LD, Jonscher KR, Pierce KG, Old WM, Cheung HT, Russell S, Wattawa JL, Goehle GR, Knight RD, Ahn NG. Improving reproducibility and sensitivity in identifying human proteins by shotgun proteomics. Anal Chem. 2004;76(13):3556–3568. doi: 10.1021/ac035229m. [DOI] [PubMed] [Google Scholar]
- 21.Moore RE, Young MK, Lee TD. Qscore: an algorithm for evaluating SEQUEST database search results. J Am Soc Mass Spectrom. 2002;13(4):378–386. doi: 10.1016/S1044-0305(02)00352-5. [DOI] [PubMed] [Google Scholar]
- 22.Keller A, Nesvizhskii AI, Kolker E, Aebersold R. Empirical statistical model to estimate the accuracy of peptide identifications made by MS/MS and database search. Anal Chem. 2002;74(20):5383–5392. doi: 10.1021/ac025747h. [DOI] [PubMed] [Google Scholar]
- 23.Elias JE, Gibbons FD, King OD, Roth FP, Gygi SP. Intensity-based protein identification by machine learning from a library of tandem mass spectra. Nat Biotechnol. 2004;22(2):214–219. doi: 10.1038/nbt930. [DOI] [PubMed] [Google Scholar]
- 24.Choi H, Ghosh D, Nesvizhskii AI. Statistical validation of peptide identifications in large-scale proteomics using the target-decoy database search strategy and flexible mixture modeling. J Proteome Res. 2008;7(1):286–292. doi: 10.1021/pr7006818. [DOI] [PubMed] [Google Scholar]
- 25.Chen Y, Kwon SW, Kim SC, Zhao Y. Integrated approach for manual evaluation of peptides identified by searching protein sequence databases with tandem mass spectra. J Proteome Res. 2005;4(3):998–1005. doi: 10.1021/pr049754t. [DOI] [PubMed] [Google Scholar]
- 26.Witze ES, Old WM, Resing KA, Ahn NG. Mapping protein post-translational modifications with mass spectrometry. Nat Methods. 2007;4(10):798–806. doi: 10.1038/nmeth1100. [DOI] [PubMed] [Google Scholar]
- 27.Sprung R, Chen Y, Zhang K, Cheng D, Zhang T, Peng J, Zhao Y. Identification and validation of eukaryotic aspartate and glutamate methylation in proteins. J Proteome Res. 2008;7(3):1001–1006. doi: 10.1021/pr0705338. [DOI] [PMC free article] [PubMed] [Google Scholar]
- 28.Savitski MM, Nielsen ML, Zubarev RA. ModifiComb, a new proteomic tool for mapping substoichiometric post-translational modifications, finding novel types of modifications, and fingerprinting complex protein mixtures. Mol Cell Proteomics. 2006;5(5):935–948. doi: 10.1074/mcp.T500034-MCP200. [DOI] [PubMed] [Google Scholar]
Associated Data
This section collects any data citations, data availability statements, or supplementary materials included in this article.


