

Abstract
Development of hematopoietic stem cells (HSCs) and their immediate progeny is maintained by the interaction with cells in the microenvironment. We found that hematopoiesis was dysregulated in Id1−/− mice. Although the frequency of HSCs in Id1−/− bone marrow was increased, their total numbers remained unchanged as the result of decreased bone marrow cellularity. In addition, the ability of Id1−/− HSCs to self-renew was normal, suggesting Id1 does not affect HSC function. Id1−/− progenitors showed increased cycling in vivo but not in vitro, suggesting cell nonautonomous mechanisms for the increased cycling. Id1−/− HSCs developed normally when transplanted into Id1+/+ mice, whereas the development of Id1+/+ HSCs was impaired in Id1−/− recipients undergoing transplantation and reproduced the hematologic features of Id1−/− mice, indicating that the Id1−/− microenvironment cannot support normal hematopoietic development. Id1−/− stromal cells showed altered production of cytokines in vitro, and cytokine levels were deregulated in vivo, which could account for the Id1−/− hematopoietic phenotypes. Thus, Id1 is required for regulating the hematopoietic progenitor cell niche but is dispensable for maintaining HSCs.
Introduction
Hematopoiesis occurs in the bone marrow (BM) of adult mammals, where developing hematopoietic cells are found in close association with cells that constitute the microenvironment or niche. It is known that hematopoiesis is regulated by both cell-autonomous and -nonautonomous mechanisms. For example, cells within the BM microenvironment produce soluble or membrane-bound cytokines, integrins, extracellular matrix, and other proteins that regulate the survival, self-renewal, and development of hematopoietic cells (extrinsic or cell-nonautonomous).1–9 In addition, the growth and differentiation of hematopoietic stem cells (HSCs)/hematopoietic progenitor cells (HPCs) is controlled by specific gene-expression programs within hematopoietic cells (intrinsic or cell-autonomous).10,11 Together, these mechanisms ensure that the BM microenvironment maintains a constant output of hematopoietic cells and allows for increased HPC proliferation in response to increased demand. However, the precise mechanism(s) by which the microenvironment maintains hematopoiesis are not completely known
The Id proteins are helix-loop-helix transcription factors that regulate several developmental processes, including neurogenesis, myogenesis, and hematopoiesis.12–16 Id1 protein expression is increased during the early stages of myeloid development, and overexpression of Id1 enhances the proliferation of HSCs/HPCs while inhibiting their differentiation, suggesting that Id1 intrinsically regulates hematopoiesis.14,17,18 However, Id1 is widely expressed in other tissues and can affect the proliferation and differentiation of cells that constitute the hematopoietic microenvironment, including osteoblasts, endothelial cells (ECs), adipocytes, fibroblasts, osteoclasts, and macrophages.19–24 In addition, Id1 protein is a downstream mediator of bone morphogenetic protein– and Wnt-induced signaling in mesenchymal stem cells and regulates the differentiation of osteoblasts and adipocytes in vitro, suggesting that Id1 could regulate hematopoiesis in a cell-nonautonomous manner by regulating the development of stromal cells in vivo.25–29 Furthermore, defects in bone formation and angiogenesis have been reported in Id1/Id3 mutant mouse model systems.15,30
On the basis of these reports, we hypothesized that Id1 also may regulate normal hematopoietic development via cell-nonautonomous mechanisms. We demonstrate here that Id1−/− mice show impaired hematopoietic development, including increased numbers of neutrophils and monocytes and decreased numbers of lymphocytes and platelets in peripheral blood (PB). In addition, we observed decreased BM cellularity and increased HPC cycling. By using BM transplantation assays, we discovered that Id1−/− BM cells (BMCs) develop normally when transplanted into Id1+/+ recipients, whereas Id1+/+ BMCs have an impaired ability to repopulate irradiated Id1−/− recipients. Thus, the loss of Id1 expression in the BM microenvironment impairs normal hematopoietic development, demonstrating that Id1 is critical for BM microenvironment function.
Methods
Experimental mice
Id1−/− mice were generously provided by Dr Robert Benezra (Memorial Sloan-Kettering Cancer Center). C57BL/6-Ly5.2 (CD45.1) mice were obtained for experiments from the animal production area at NCI-Frederick. Animal care was provided in accordance with the procedures outlined in the “Guide for Care and Use of Laboratory Animals” (National Institutes of Health, 1996). All animal studies were approved by the Animal Care and Use Committee at the National Cancer Institute.
PB and BM analysis
Freshly harvested PB cells (PBCs) were analyzed by the use of a CDC Technologies Hemavet blood counter calibrated exclusively for mouse and by differential analysis of blood smears. Total nucleated BMs and spleen cell cellularity was determined by hemacytometer counting. For flow cytometry analysis, single-cell suspensions were prepared from PB, BM, and spleens in Dulbecco phosphate-buffered saline supplemented with 0.1% fetal bovine serum. Cells were stained with the monoclonal antibodies that recognize specific-lineage Gr-1 and Mac-1 for myeloid cells, B220 and CD43 for B cells, and TER119 and CD71 for erythroid cells (all lineage-specific antibodies were purchased from BD Pharmingen) and analyzed by FACS-LSRII, CellQuest software (BD Biosciences). Mouse HSC/HPCs were purified from the BMCs of 12- to 14-week-old mice by lineage depletion of BMCs with lineage-specific antibodies obtained from BD Pharmingen, followed by flow cytometry cell sorting with antibodies directed against interleukin (IL)–7 receptor, c-Kit, Sca-1, CD34, and anti-FcγRII/III by the use of FACSAria (BD Biosciences) as previously described.31
In vitro assays for HPC growth
HPC growth was determined by plating PB, BM, and spleen cells in colony-formation assays (CFU-c) at the indicated densities and growth factors as previously described.31 For limiting dilution analysis, Lin−IL7Rα−Sca-1+c-Kit+ (LSK) and Lin−IL7Rα−Sca-1−c-Kit+ (LS−K) cells were sorted directly into individual wells of a flat-bottomed 96-well plate containing 100 μL of complete Iscove modified Dulbecco media with the indicated cytokine cocktail. After 10 days, the number of negative wells or those wells containing no cells or smaller clusters of less than 10 cells were counted and plotted against the number of cells plated per well. For long-term culture-initiating cell (LTC-IC) assays, feeder layers were established according to a protocol provided by StemCell Technologies, after which the cells were irradiated. Purified Lin−Sca-1+ cells were seeded at limiting dilution onto the feeder layers. The contents of individual wells were removed after 4 weeks, plated into CFU-c assays, and then scored for wells with positive growth (≥ 1 CFU-c) and wells negative for CFU-c. The frequencies were estimated from the slope of the regression line generated from the limit dilution analysis data.
BM transplants
BMCs from Id1−/− and Id1+/+ (Lu5.1) mice were transplanted alone in serial transplantation assays or with competitor BMCs (C/57BL6-Ly5.2) in competitive repopulation assays at the indicated cell doses into C/57BL6-Ly5.2 recipient mice. For reverse transplantation and homing assay, Id1−/− and Id1+/+ (Ly5.1) mice also were used as recipients. Recipient mice were irradiated with 11 Gy whole-body irradiation. BMCs were injected intravenously into the lateral tail vein of recipient mice. Animals were monitored daily for signs of morbidity and killed 4 months after transplantation for competitive repopulation assays and at the indicated times for serial transplantation assays.
Cytokine/chemokine quantitation
Serum samples were collected from Id1−/− and Id1+/+ mice for chemokine/cytokine quantitation. Specific proteins were quantified by a commercial enzyme-linked immunosorbent assay kit (Quantikine immunoassay stromal cell–derived factor [SDF]–1α and stem cell factor [SCF]; R&D Systems) or Multiplex analysis kit (Milliplex mouse cytokine/chemokine immunoassay granulocyte colony-stimulating factor [G-CSF], granulocyte-macrophage colony-stimulating factor [GM-CSF], IL-3, IL-6, tumor necrosis factor-α, vascular endothelial growth factor [VEGF], and macrophage colony-stimulating factor [M-CSF]; Millipore) in accordance with the manufacturer's instructions. The optical density in the 96-well plates was determined by the use of an enzyme-linked immunosorbent assay microplate reader at 450 nm/595 nm. The Bio-Plex array reader and Bio-Plex manager (Bio-Rad Laboratories) was used to measure and analyze the multiplex analysis kit. Results were reported as the concentration of each cytokine, using a minimum of 50 counted beads.
Real-time RT-PCR
Primary BMCs were harvested 4 weeks after they were established according to the protocol provided by StemCell Technologies. Total RNA was isolated by the use of RNeasy Quick spin columns (QIAGEN). Eluted RNA samples were reverse-transcribed with the SuperScript III First-Strand Synthesis System (Invitrogen) for reverse-transcription polymerase chain reaction (RT-PCR). For PCR, 12.5 μL of quantitative PCR master mix (Superarray) was mixed with 1 μL of primers (see supplemental Table 1, available on the Blood website; see the Supplemental Materials link at the top of the online article). The following parameters were used for real-time PCR: 95°C for 5 minutes, followed by 45 cycles of 95°C for 1 minute, 58°C for 40 seconds, and 72°C for 1 minute. All experiments were performed in triplicate, the relative expression differences were determined, and cDNA input was compensated by normalization to the expression of glyceraldehyde-3-phosphate dehydrogenase.
Statistical analysis
Statistical analyses were performed by the use of Microsoft Excel and GraphPad Prism software. The significance of the difference between groups in the experiments was evaluated by analysis of variance and the Student t test. Mouse survival was compared by Kaplan-Meier survival curves and the log rank test.
Results
Hematopoiesis is dysregulated in Id1−/− mice
Id1 mRNA expression is increased during myeloid differentiation and is mainly expressed in immature myeloid progenitors.12,14 In addition, overexpression of Id1 in HSC promotes myeloid development while inhibiting lymphoid and erythroid cell differentiation, suggesting that Id1 may regulate the early stages of a myeloid cell's fate.17,18 To test this hypothesis, we evaluated myeloid development in Id1−/− mice. Complete blood counts revealed that granulocytes and monocytes counts in PBs were significantly increased in Id1−/− mice, whereas lymphocytes and platelets counts were decreased (Table 1). No statistical differences in hemoglobin levels and the total leukocyte count were observed between Id1−/− and Id1+/+ mice. These results were confirmed by immunophenotypic analysis of PB by the use of antibodies directed against lineage-specific antigens, which showed increased percentages of Gr-1+/Mac-1+ granulocytes and F4/80+ macrophages and decreased percentages of B220+ and CD4+ lymphocytes (Figure 1A).
Table 1.
Peripheral blood profile of Id1+/+ and Id1−/− mice
| Hematologic parameter | Id1+/+ | Id1−/− |
|---|---|---|
| Hb, g/dL | 13 ± 0.2 | 13 ± 0.2 |
| WBC count, ×103/μL | 8010 ± 683 | 7545 ± 360 |
| Granulocyte | 1200 ± 110 | 2200 ± 180* |
| Monocyte | 290 ± 25 | 420 ± 26* |
| Lymphocyte | 6400 ± 560 | 4900 ± 280* |
| Platelet count, ×103/μL | 690 ± 31 | 540 ± 25* |
Peripheral blood samples were obtained from age- and sex-matched Id1−/− (n = 31) and Id1+/+ (n = 25) mice. Results are presented as the mean ± SEM. Hb indicates hemoglobin; and WBC, white blood cell count.
P < .05, Student t test.
Figure 1.

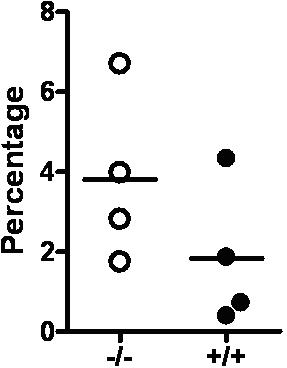
Id1−/− mice show decreased BM cellularity with fewer myeloid, erythroid, and lymphoid cells but increased neutrophils and monocytes in the PB. (A) PBCs obtained from Id1−/− (n = 5) and Id1+/+ (n = 5) mice were analyzed with lineage-specific monoclonal antibodies. The horizontal bars indicate the mean percentage (*P < .01). Data were obtained from 2 independent experiments. (B) Total BM (Id1−/−, n = 30; Id1+/+, n = 32) and spleen (Id1−/−, n = 9; Id1+/+, n = 8) cells were enumerated by the use of a hemacytometer (*P < .01). (C) Left panel shows the flow cytometric analysis for granulocytes/monocytes (Gr-1 × Mac-1) and erythroid cells (TER119 × CD71) in Id1−/− and Id1+/+ BMC. The numbers in each quadrant indicate the percentage of each cell type among the total analyzed cells. Right panel shows percentages of Gr-1+/Mac-1+ or TER119+ BMC from all Id1−/− (n = 9) and Id1+/+ (n = 6) mice analyzed (*P = .01). (D) The absolute number of Gr-1+, B220+, and TER119+ BMC was calculated by multiplying the fraction of positive cells to total BMC (*P < .01). Data were obtained from 3 independent experiments, and the horizontal bars indicate the mean cell counts.
Analysis of PBCs revealed that hematopoietic development may be impaired in Id1−/− mice; therefore, we analyzed developing hematopoietic cells in BM from Id1−/− mice. We found that the total nucleated BMC numbers were decreased by 29% in Id1−/− mice (Figure 1B). In comparison, the total cell number of splenocytes was not statistically different between Id1−/− and Id1+/+ mice; however, a tendency toward decreased cellularity was observed in Id1−/− mice (Figure 1B). Because Id1 can promote cell proliferation and inhibit cell differentiation, the decreased BM cellularity in Id1−/− mice could be attributable to a defect in the proliferation or differentiation of HSC/HPCs. Therefore, we evaluated hematopoietic development in Id1−/− BM by immunophenotypic analysis. The percentage of Gr-1+/Mac-1+-cell granulocytes was increased in Id1−/− BM, whereas the percentage of TER119+ erythroid or B220+ B cells was decreased compared with Id1+/+ BM (Figure 1C; supplemental Figure 1A), suggesting that Id1 is required for the maintenance of tri-lineage development in the BM. Because BMCs are reduced by 29% in Id1−/− mice, we determined total cell numbers for specific cell lineages and found that TER119+ erythroid and B220+ B cells were markedly decreased and that Gr-1+ cells were also decreased in Id1−/− BM, indicating that the hematopoietic output was deregulated (Figure 1D). Finally, no significant differences in the expression of CD4 and CD8 antigens were observed on thymocytes by flow cytometry, suggesting that T-lymphocyte development was not affected in Id1−/− mice (supplemental Figure 1B). Collectively, myeloid, lymphoid, and erythroid development is dysregulated in Id1−/− mice, suggesting that Id1 is required for normal hematopoiesis.
Id1 is not required for HSC self-renewal or maintenance
Hematopoietic output is sustained by HSC/HPCs present in the BM; therefore, we evaluated whether defects in the HSC/HPC compartment could explain the decreased BM cellularity and dysregulated hematopoietic development in Id1−/− mice. The HSC/HPC compartment was analyzed by immunophenotype to determine whether the percentage and absolute numbers of long-term HSCs (CD34loLSK; CD34lo/−Lin− IL7Rα−Sca-1+cKit+), LSK, common myeloid progenitors (CMP; Lin−IL7Rα−cKit+Sca-1−CD34+Fcγ RII/III−), granulocyte monocyte progenitors (GMP; Lin−IL7Rα−cKit+Sca-1−CD34+Fcγ RII/III+), and megakaryocyte erythroid progenitors (MEP; Lin−IL7Rα−cKit+Sca-1−CD34−FcγRII/III−) in Id1−/− and Id1+/+ BM were normal. We found that the percentage of CD34loLSK, LSK, and CMP was increased in Id1−/− BM (Figure 2A; supplemental Figure 2). However, the absolute number of CD34loLSK and LSK in BM were not statistically different between Id1−/− and Id1+/+ mice (Figure 2A), suggesting that the increased percentage of HSC was caused by the altered development of differentiated cells in BM and decreased BM cellularity. In comparison, there was a decrease in the absolute number of MEPs and GMPs of Id1−/− BM, whereas the absolute number of CMPs was preserved (Figure 2A). In addition, Id1−/− BM showed increased numbers of myeloid CFU-c compared with Id1+/+ BM, which is likely attributable to the increased percentage of LSKs and CMPs in Id1−/− BM (Figure 2B).
Figure 2.

HSCs are maintained in Id1−/− mice. (A) The percentages and absolute numbers of LSK, CD34loLSK, CMP, MEP, and GMP were determined by flow cytometry of BMC obtained from 12- to 14-week-old Id1−/− (n = 5) and Id1+/+ (n = 6) mice in 3 separate experiments (*P < .05). The percentage of each population among total Lin−IL-7Rα− BMC (top panel), and the absolute counts to total Lin−IL-7Rα− BMC of each group of mice (bottom panel) is shown. (B) Myeloid colony assays were performed on BM, spleen, and PB cells from Id1−/− and Id1+/+ mice. BMCs were cultured in methylcellulose semisolid media with cytokines (mouse GM-CSF, 100 ng/mL; mouse IL-3, 30 ng/mL; mouse SCF, 100 ng/mL). The results depict data from triplicate plates (*P ≤ .001). (C) Mice were irradiated (n = 10 per group) and then serially transplanted with 2 × 10⁶ Id1−/− or Id1+/+ BMC. The percentage of donor BMC were determined in recipient mice 70 days after transplantation by the use of antibodies specific for donor and host cells (Ly5.1 and Ly5.2). Survival data of recipient mice were plotted as Kaplan-Meier curves and analyzed by log rank test (P = .13). (D) The percentage of donor-derived BMC versus the serial transplant number was plotted (P = .30). Data are representative of 1 of 2 independent experiments. (E) BMC (106) from Id1−/− or Id1+/+ mice were mixed with BM competitor cells (106) and were transplanted into irradiated recipient mice. Donor cell chimerism in recipient BMs was evaluated 4 months after transplantation. Left panel graph shows competitive repopulation unit (CRU) of 106 BMC of each group (*P = .03), whereas right panel graph shows CRU data that was normalized by use of the mean total BMC for each group (P = .15). The data are presented as the mean ± SEM (n = 6).
To determine whether the function of HSC/HPCs could explain the hematopoietic phenotypes observed in Id1−/− mice, Id1−/− and Id1+/+ BMC were compared in serial transplantation and competitive repopulation assays. To examine HSC self-renewal, BMCs (Ly5.1, 106) from Id1−/− or Id1+/+ mice were transplanted to irradiated (11 Gy) recipient (Ly5.2) mice. At 10 weeks after transplantation, the same number of BMCs from primary recipients was injected into secondary, tertiary, and quaternary recipients at 10-week intervals. The survival of transplanted recipients and the percentages of donor cells were measured in every transplantation. Id1−/− and Id1+/+ BMC repopulated equally in serially transplanted mice until the fourth transplantation, when the donor cell–repopulating ability from both groups was lost, and mice did not survive (Figure 2C-D). In support of these data, Id1−/− and Id1+/+ mice have the same life span in our animal facility (supplemental Figure 3). These data suggest that loss of Id1 does not significantly affect the self-renewal of HSC.
To determine whether HSC activity was preserved in Id1−/− mice, equal numbers (106) of donor and host BMCs were transplanted into irradiated recipient mice in competitive repopulation assays. Analysis of Id1−/− and Id1+/+ donor repopulation 4 months after transplantation demonstrated increased percentages of Id1−/− donor cells in comparison with Id1+/+ BM (Figure 2E left panel), suggesting that Id1−/− BM has increased HSC activity. This finding might be anticipated because Id1−/− BMCs have increased percentages of HSC by immunophenotypic analysis. However, normal HSC activity was observed when BM cellularity was considered. Therefore, when we combined the HSC repopulation ability with BM cellularity, we determined that Id1−/− and Id1+/+ mice had equivalent HSC activity (Figure 2E right panel). Thus, Id1−/− BM have immunophenotypically and functionally intact HSCs.
Increased proliferation of Id1−/− hematopoietic progenitors is extrinsically regulated in vivo
Id1 promotes the proliferation of many cell types, in part, by decreasing the expression of Cdk inhibitors, including p16 and p21.23,32 Therefore, we hypothesized that the loss of Id1−/− in HPCs may result in decreased cell cycling, which could contribute to decreased BM cellularity in Id1−/− mice. Therefore, we compared the proliferation of HSC (LSK) and committed myeloid progenitors (LS−K) in Id1−/− BM by labeling BMCs with 5-bromodeoxyuridine (BrdU) during the course of 3 days in vivo. Contrary to our expectations, there were increased percentages of Id1−/− LS−K cells in the S phase compared with Id1+/+ BMCs in vivo (Figure 3A).
Figure 3.

Increased cell cycling of myeloid progenitors in Id1−/− mice. (A) Mice received an intraperitoneal injection of 3 mg BrdU and then 1 mg/mL BrdU in the drinking water for 2 days. BMC were isolated from treated mice, depleted of lineage-positive cells, and then stained with IL7Rα, c-Kit, and Sca-1 antibodies to detect LSK and LS−K progenitors. BrdU incorporation was measured by use of the APC BrdU flow cytometry kit (Becton Dickinson). Data are presented as the mean ± SEM of 3 mice for each genotype (*P = .002). (B) Cell proliferation was measured by sorting the indicated number of LS−K or LSK cells from Id1−/− and Id1+/+ mice into 96-well plates (24 replicates per cell concentration) with cIMDM media containing cytokines (mouse SCF, 100 ng/mL; human IL-6, 50 ng/mL; human Flt3, 100 ng/mL; and human Tpo, 100 ng/mL for LSK and mouse SCF,100 ng/mL; mouse IL-3, 30 ng/mL; and mouse GM-CSF, 100 ng/mL for LS−K). Cell proliferation, including colonies (> 50 cells) and clusters (> 10 and < 50 cells), was determined after 10 days of culture, and then the log of the percentage of negative wells was plotted against the number of cells per well. The frequency of a positive colony or cluster is defined as the inverse of the number of seeded cells that corresponds to 37% negative cells.
To evaluate whether the enhanced cell cycling of Id1−/− HPC was cell autonomous in vivo, we purified LSK and LS−K progenitors from Id1−/− and Id1+/+ BM and compared their proliferation in response to multiple cytokines in limiting dilution analysis assays in vitro. For these experiments, the frequency of wells negative for the presence of cell colonies or clusters was plotted against the number of cells seeded. We found no difference in proliferation of Id1−/− and Id1+/+ BMC in response to cytokines, with the frequency of LSK being 1/1.0 cell plated for Id1−/− and 1/1.1 cell for Id1+/+ cells and the frequency of LS−K being 1/26 cells plated for Id1−/− and 1/25 cells for Id1+/+ cells (Figure 3B). Thus, the loss of Id1 enhances HPC proliferation in vivo but does not affect their ability to proliferate ex vivo, suggesting that the increased cell cycling of Id1−/− HPC in vivo might be the result of altered extrinsic signals.
Id1−/− mice have defects in the hematopoietic microenvironment
Id1 is widely expressed in many cell types, including cells that constitute the BM microenvironment, and thus could affect their development or function. Therefore, the loss of Id1 in the BM microenvironment could contribute to the dysregulated hematopoiesis in Id1−/− mice. To test this hypothesis, we evaluated the repopulating ability of Id1−/− and Id1+/+ BMCs in Id1−/− or Id1+/+ microenvironment by using BM transplantation assays. Hematopoietic cells from Id1−/− and Id1+/+ mice (Ly5.1) were transplanted into irradiated Id1+/+ recipient (Ly5.2) mice. At 4 months after transplantation, Id1−/− and Id1+/+ HSC repopulated myeloid and erythroid lineages to the same extent in the Id1+/+ recipients (Figure 4A). Therefore, loss of Id1 in hematopoietic cells did not confer a functional defect to the ability of HSC to repopulate the hematopoietic cells in the Id1+/+ recipient BM environment.
Figure 4.

Id1 is required for proper hematopoietic microenvironment function. (A) BMCs were harvested 4 months after Id1−/− or Id1+/+ BMC were transplanted into irradiated Id1+/+ recipient mice and then analyzed for donor hematopoietic reconstitution by flow cytometry. Flow cytometric data are representative data from individual mice. The left panel shows donor myeloid (Gr-1 × Mac-1) and erythroid (TER119 × CD71) reconstitution in Id1−/− and Id1+/+ recipient mice. The numbers indicate the percentage of donor cells in each quadrant. The right panel shows percentages of Gr-1+/Mac-1+ or TER119+ BMC in all the mice analyzed (each genotype, n = 3). (B) Repopulation of Id1+/+ BMC in irradiated Id1−/− or Id1+/+ recipient. Total BMC of recipient mice were enumerated 4 months after transplantation (n = 6, *P = .04). (C) BMC were harvested 4 months after Id1+/+ BMC were transplanted into irradiated Id1+/+ and Id1−/− recipient mice and then analyzed for donor hematopoietic reconstitution by flow cytometry. Left panel shows myeloid and erythroid repopulation of representative mice, whereas the right panel shows percentages of Gr-1+/Mac-1+ myeloid or TER119+ erythroid BMC in all the mice analyzed (each genotype, n = 6, *P < .001).
To examine the contribution of Id1 in the hematopoietic microenvironment, the repopulation capacity of Id1+/+ hematopoietic cells in irradiated Id1−/− or Id1+/+ recipient mice was evaluated. Total BMCs (Ly5.2) from Id1+/+ mice were injected into irradiated recipients (Id1−/− or Id1+/+, Ly5.1). All mice showed engraftment and survived for more than 4 months. However, donor BMCs (Ly5.2) transplanted into Id1−/− recipients showed impaired hematopoietic development that was similar to the hematologic phenotype of Id1−/− mice, including decreased BM cellularity (Figure 4B), increased percentages of myeloid cells, and decreased erythropoiesis (Figure 4C) compared with Id1+/+ recipients. Collectively, these results indicate that loss of Id1 expression in the BM microenvironment leads to deregulated hematopoietic development and contributes to the hematopoietic phenotypes observed in the Id1−/− mice.
Given that Id1 has been implicated in regulating expression of genes for cell adhesion, we hypothesized that Id1 deletion might diminish the ability of BMCs to home into the BM compartment after transplantation and contribute to the dysregulated repopulation of Id1−/− BMCs to Id+/+ irradiated hosts. To rule out this possibility, we evaluated the homing ability of Id1−/− BMCs to Id1+/+ recipient mice, and Id1+/+ BMCs to Id1−/− recipient mice were compared. Donor BMCs (Id1−/− or Id1+/+ BMCs) were labeled with carboxyfluorescein diacetate succinimidyl ester (CFSE; Molecular Probes) and then transplanted into mice to measure the homing of BMCs to the BM and spleen of recipient mice (Id1−/− or Id1+/+) at 24 hours after transplantation. The results showed no difference in the percentages of CSFE-labeled Id1+/+ and Id1−/− donor BMCs that homed to the spleen and the BM of Id1−/− or Id1+/+ (Figure 5A left panel), suggesting that loss of Id1 did not affect homing. These results were confirmed in experiments comparing CFSE+-labeled purified Lin− hematopoietic progenitors (Figure 5A right panel). Therefore, the data indicate that Id1 is a physiologic regulator of proper BM microenvironment function and required for normal hematopoiesis.
Figure 5.

Role of Id1 in the formation of the BM microenvironment. (A) The homing efficiency of Id1−/− and Id1+/+ BMC was assayed by the labeling of cells with CFSE. Staining was performed by incubating cells for 10 minutes in 37°C with 1 μmol/L concentration of CSFE. Then, 1.5 × 10⁷ cells were injected into irradiated recipient mice. At 24 hours, recipient BM and spleen cells were harvested, and CSFE-positive cells were analyzed by flow cytometry (n = 2 for each genotype, P = .56). Lineage-negative (Lin−) hematopoietic cell homing was determined by transplanting 8.5 × 10⁶ Lin− cells per mouse (n = 3 for each genotype, P = .46). (B) LTC-IC assays of mouse hematopoietic cells using primary BM stromal cells and limiting dilution analysis was used to compare the supportive function of Id1−/− (○—○) and Id1+/+ (●—●) BM-derived stromal cells. Wells containing clonogenic cell colonies were scored after 10 days of culture of Id1+/+ Lin−Sca-1+ BM progenitors with established stromal cells from Id1−/− or Id1+/+ and plotted as the number of wells that showed no growth for each cell dilution. The data are presented as representative data from 2 separate experiments. (C) Serum chemokine and cytokine concentrations (expressed as picograms per milliliter except SDF-1α, which is nanograms per milliliter) were measured and compared between 2 groups of age- and sex-matched mice (n = 21 for Id1−/−, n = 18 for Id1+/+, *P < .05). (D) Total RNA was isolated from cultured bone marrow–derived stromal cells and real-time PCR was used to measure mRNA. Relative mRNA units were normalized to glyceraldehydes-3-phosphate dehydrogenase levels. Data shown are the mean ± SEM in triplicate (*P < .05).
Loss of Id1 leads to altered cytokine and chemokine production in vitro and in vivo
Osteoblasts, osteoclasts, and ECs are essential components of hematopoietic microenvironment, and Id proteins are important regulators for EC, osteoblasts, and osteoclast development.24,30,33 Therefore, we hypothesized that loss of Id1 may affect the development of bone or blood vessels in Id1−/− mice. However, we found no differences in osteogenesis in Id1−/− mice in vivo and in vitro when comparing (1) femoral and tibial bone areas in hematoxylin and eosin–stained bone sections (supplemental Figure 4A), (2) picrosirius red–stained femur and tibia sections (supplemental Figure 4B), and (3) osteogenic activity of BMC (supplemental Figure 4C) between Id1−/− and Id1+/+ mice. In addition, there were no differences in Masson trichrome staining for collagen production and tartrate-resistant acid phosphatase staining for osteoclasts between the 2 groups of mice (supplemental Figure 4B). Finally, we found no difference in blood-vessel formation between Id1−/− and Id1+/+ BM sections that were stained with VEGF receptor 2 and antiplatelet/endothelial cell adhesion molecule-1 (CD31) antibodies (supplemental Figure 5). These data suggest that loss of Id1 does not affect bone or blood-vessel formation in the hematopoietic microenvironment, which could account for the impaired microenvironment function in Id1−/− mice.
To confirm that Id1 is required for normal stromal cell function, primary stromal cell cultures were established from Id1−/− and Id1+/+ BMC after 4 weeks. The stromal cultures were irradiated and then tested for their ability to support the growth of purified Lin−Sca-1+ hematopoietic progenitors in LTC-IC assays. Id1−/− stromal cells supported enhanced proliferation of Lin−Sca-1+ hematopoietic progenitors as measured by increased numbers of CFU-c and increased cell numbers in wells containing Id1−/− stroma compared with Id1+/+ stromal cells. Specifically, the frequency of Lin−Sca-1+ progenitor growth on Id1−/− stroma was increased from 1 in 226.3 cells plated for Id1+/+ to 1 in 129.5 cells plated for Id1−/− cells (Figure 5C). Thus, loss of Id1 expression in primary stromal cell cultures promotes HPC proliferation, which also was observed in Id1−/− mice in vivo. Therefore, these stromal cultures are representative of cells found in the Id1−/− microenvironment and could be used to further understand how loss of Id gene expressions impairs proper BM microenvironment function.
The development of hematopoietic cells is affected by hematopoietic growth factors, cytokines, extracellular matrix, and chemokines secreted by BM stromal cells. Therefore, to determine which genes were affected by the loss of Id1 and could contribute to the Id1−/− hematopoietic phenotype, we used quantitative RT-PCR to evaluate the expression of genes produced by 4-week primary stromal cell cultures (Figure 5C). We found that SCF, M-CSF, osteopontin, fibroblast growth fadctor-1, transforming growth factor-α, and SDF-1 mRNA expression were decreased in Id1−/− stromal cells relative to Id1+/+ stromal cells. However, G-CSF, and GM-CSF mRNA levels were significantly increased. Thus, these PCR data indicate that loss of Id1 affects the production of stromal cell–derived cytokines, which could contribute to impaired hematopoiesis Id1−/− mice. These data suggested that cytokine/chemokine production might be altered in vivo; therefore, we assayed serum samples from Id1−/− and Id1+/+ mice for cytokine levels. We observed that serum levels of IL-6, tumor necrosis factor-α, VEGF, GM-CSF, SCF, and M-CSF were decreased, whereas the serum levels of IL-3, G-CSF, and SDF-1α were unaffected (Figure 5D). Although it was anticipated that cytokine RNA expression levels in stromal cell cultures in vitro might be different from serum levels in vivo, we found that M-CSF and SCF were decreased from both sources. Collectively, we found that the production of stromal cell–derived cytokines was altered in vitro and in vivo in Id1−/− mice.
Discussion
Id1 is expressed in hematopoietic cells and BM stromal cells known to support hematopoiesis, suggesting that Id1 may regulate hematopoiesis by cell-autonomous and cell-nonautonomous mechanisms.12,14 We discovered that Id1 is physiologically required for normal hematopoietic microenvironment function in vivo, using Id1−/− mice. Specifically, we found that Id1−/− mice have a novel hematopoietic phenotype, including (1) increased neutrophils and monocytes and decreased B cells and platelets in PB; (2) decreased BM cellularity, which resulted in decreased absolute numbers of erythroid, myeloid, and B cells in the BM; (3) increased percentages of HSC, whereas their absolute numbers and function were normal; and (4) increased numbers of HPC in S phase. In addition, we determined that the Id1−/− HPC have the same proliferation potential as Id1+/+ HPC in vitro, suggesting that the enhanced cycling of Id1−/− HPC in vivo was the result of extrinsic or cell-nonautonomous mechanisms. In agreement with this hypothesis, Id1+/+ HSC/HPC showed impaired hematopoietic development in Id1−/− mice, whereas the Id1−/− BMCs developed normally in an Id1+/+ microenvironment. Thus, Id1 is required for the proper function of the hematopoietic microenvironment.
Although the authors of previous studies34,35 showed that Id1 is required for myeloid differentiation, HSC maintenance, and self-renewal by intrinsic effects, our studies indicate that the Id1−/− mice phenotypes, including enhanced myeloid development and increased progenitor cycling, were not intrinsic to the cells but rather caused by deregulated cytokine production and MSC development in the microenvironment of ID1−/− mice. In addition, the HSC compartment was unaffected in our experiments. In this regard, Id1−/− mice continue to produce hematopoietic cells during the normal life span of the animal, suggesting that HSC can function normally in the absence of Id1. Therefore, the loss of Id1 expression does not affect the self-renewal or ability of HSC/HPC to undergo myeloid differentiation.
Loss of Id1 in fibroblasts results in premature cell senescence, and decreased expression of Id1 in MSC is associated with senescence during passage in vitro.23,36,37 Thus, MSCs may undergo accelerated senescence in Id1−/− BM, resulting in decreased frequencies and total numbers in BM. It has been proposed that the transplanted MSCs induce tissue regeneration via the production of cytokines, which promotes the differentiation and growth of endogenous tissue-specific stem/progenitor cells.38 Furthermore, cells undergoing senescence secret numerous cytokines/chemokines that could affect neighboring cells.39,40 In this regard, we determined that primary BM stromal cell cultures derived from Id1−/− mice showed altered cytokine and chemokine production, including increased levels of G-CSF and GM-CSF expression, and decreased levels of SCF, M-CSF, SDF-1, and osteopontin expression in comparison with Id1+/+ stromal cell cultures. We also found that cytokine levels in the serum of Id1−/− mice also were deregulated, suggesting that they could explain, in part, the hematopoietic phenotypes of Id1−/− mice. For example, increased production of G-CSF and GM-CSF in BM microenvironment could promote HPC proliferation, increased granulocytes and monocytes, and increased mobilization of cells from the BM,41 which could result in a decrease in BM cellularity and an increase in PB granulocytes and monocytes (Figure 6). However, it is difficult to determine whether the observed hematopoietic defects are caused by the direct or indirect effects of these and other cytokines. Therefore, several questions remain to be addressed, including the location of the progenitor specific niches(s) affected by the loss of Id1 and the precise mechanisms(s) or genes affected within each cell type. It is difficult to answer these questions using Id1−/− mice because more than 1 cell type is involved in the formation of the BM niche, and distinctive stromal cells produce different combinations of cytokines. Therefore, to precisely understand the mechanism(s) for the hematopoietic phenotypes in the Id1−/− mice, Id1 conditional mouse models are needed to evaluate loss of Id1 in specific stromal cell lineages.
Figure 6.

Summary of Id1−/− hematopoietic phenotypes. Id1−/− mice show decreased BM cellularity, which results in decreased absolute numbers of B cells and erythroid cells, while myeloid cell development is enhanced. Id1−/− LSK and LS−K progenitor cell cycling is increased in vivo but not in vitro. Cytokine and chemokine production is dysregulated in stroma cultures in vitro and in vivo, suggesting that Id1 is required for proper microenvironment function. As a result of dysregulated growth factor production, Id1−/− mice show enhanced myeloid proliferation and differentiation, increased egress of myeloid cells from the BM, and increased neutrophil and monocyte numbers in the PB.
Vascular endothelium provides a hematopoietic microenvironment for HSC/HPC development.9,42,43 However, we did not detect any defect in vessel formation in Id1−/− mice BM by immunohistochemical staining of BM section. However, it has been reported that Id1+/−Id3−/− mice show decreased numbers of endothelial progenitor cells (EPCs), which was correlated with their resistance to tumor formation in vivo.15,30 It is possible that Id genes compensate with each other to regulate the development of hematopoietic microenvironment. Therefore, conditional deletion of id1 and id3 genes may show more severe microenvironmental defects. In support of this hypothesis, deletion of any 2 Id genes results in embryonic lethality.44 Recently Gao et al45 showed that Id1 knockdown in EPC resulted in decreased metastasis of melanoma. Therefore, it would also be interesting to study MSCs in comparison with EPCs in conditional Id1−/−Id3−/− mice to determine whether resistance to tumor metastasis is caused by the lack of EPC or MSC.
Several genes, including Rb and p27, are required for proper function of hematopoietic cells and BM stromal cells, although the precise mechanism(s) are not currently known.46,47 Therefore, when evaluating hematopoietic phenotypes in knockout mouse models, it is possible that any observed hematopoietic phenotype could be the result of loss of gene function in hematopoietic cells or loss of gene function in the BM microenvironment (or both). In this study, we showed that Id1 was not required for HSC/HPC development but for BM stromal cells supporting hematopoiesis. Id1 does not play a role in maintaining the HSC pool during steady-state hematopoiesis but appears to be critically involved in the HPC development through a cell-nonautonomous mechanism.
In summary, it is anticipated that future studies of Id proteins will lead to improved understanding of the BM microenvironment and how the niche contributes to the regulation of normal hematopoiesis. A further mechanistic understanding of how specific genes contribute to proper BM microenvironment function could lead to new therapies to enhance BM transplantation and a better understanding of the tumor microenvironment to treat leukemias.
Supplementary Material
Acknowledgments
We gratefully acknowledge the technical support of Steve Stull, Kathleen Noer, Roberta Matthai, and Samantha Bauchiero. We thank Dr Robert Benezra for his gift of Id1−/− mice. We also thank Drs Nancy Colburn, Sandra Ruscetti, Francis Ruscetti, Peter Johnson, Kristbjorn Gudmundsson, and the National Institutes of Health Fellows Editorial Board for their critical review of the manuscript.
This work was supported in part with federal funds from the National Cancer Institute, National Institutes of Health, under contract number NO1-CO-12 400.
Footnotes
The online version of this article contains a data supplement.
The publication costs of this article were defrayed in part by page charge payment. Therefore, and solely to indicate this fact, this article is hereby marked “advertisement” in accordance with 18 USC section 1734.
Authorship
Contributions: H.C.S. designed and performed research, analyzed data, and wrote the paper; M.J., J.G., M.L., and K.D.K. performed research and analyzed data; and J.R.K. designed research, analyzed data, and wrote the paper.
Conflict-of-interest disclosure: The authors declare no competing financial interests.
Correspondence: Jonathan R. Keller, Basic Research Program, SAIC-Frederick Inc, Center For Cancer Research, National Cancer Institute-Frederick, Bldg 560, Rm 12-03, Frederick, MD 21702-1201; e-mail: kellerj@ncifcrf.gov.
References
- 1.McCulloch EA, Siminovitch L, Till JE, Russell ES, Bernstein SE. The cellular basis of the genetically determined hemopoietic defect in anemic mice of genotype Sl-Sld. Blood. 1965;26(4):399–410. [PubMed] [Google Scholar]
- 2.Dickson MC, Martin JS, Cousins FM, Kulkarni AB, Karlsson S, Akhurst RJ. Defective haematopoiesis and vasculogenesis in transforming growth factor-beta 1 knock out mice. Development. 1995;121(6):1845–1854. doi: 10.1242/dev.121.6.1845. [DOI] [PubMed] [Google Scholar]
- 3.Oshima M, Oshima H, Taketo MM. TGF-beta receptor type II deficiency results in defects of yolk sac hematopoiesis and vasculogenesis. Dev Biol. 1996;179(1):297–302. doi: 10.1006/dbio.1996.0259. [DOI] [PubMed] [Google Scholar]
- 4.Kimura S, Roberts AW, Metcalf D, Alexander WS. Hematopoietic stem cell deficiencies in mice lacking c-Mpl, the receptor for thrombopoietin. Proc Natl Acad Sci U S A. 1998;95(3):1195–1200. doi: 10.1073/pnas.95.3.1195. [DOI] [PMC free article] [PubMed] [Google Scholar]
- 5.McKenna HJ, Stocking KL, Miller RE, et al. Mice lacking flt3 ligand have deficient hematopoiesis affecting hematopoietic progenitor cells, dendritic cells, and natural killer cells. Blood. 2000;95(11):3489–3497. [PubMed] [Google Scholar]
- 6.Zhang J, Niu C, Ye L, et al. Identification of the haematopoietic stem cell niche and control of the niche size. Nature. 2003;425(6960):836–841. doi: 10.1038/nature02041. [DOI] [PubMed] [Google Scholar]
- 7.Duncan AW, Rattis FM, DiMascio LN, et al. Integration of Notch and Wnt signaling in hematopoietic stem cell maintenance. Nat Immunol. 2005;6(3):314–322. doi: 10.1038/ni1164. [DOI] [PubMed] [Google Scholar]
- 8.Calvi LM, Adams GB, Weibrecht KW, et al. Osteoblastic cells regulate the haematopoietic stem cell niche. Nature. 2003;425(6960):841–846. doi: 10.1038/nature02040. [DOI] [PubMed] [Google Scholar]
- 9.Kiel MJ, Yilmaz OH, Iwashita T, Yilmaz OH, Terhorst C, Morrison SJ. SLAM family receptors distinguish hematopoietic stem and progenitor cells and reveal endothelial niches for stem cells. Cell. 2005;121(7):1109–1121. doi: 10.1016/j.cell.2005.05.026. [DOI] [PubMed] [Google Scholar]
- 10.Iwasaki H, Akashi K. Myeloid lineage commitment from the hematopoietic stem cell. Immunity. 2007;26(6):726–740. doi: 10.1016/j.immuni.2007.06.004. [DOI] [PubMed] [Google Scholar]
- 11.Laiosa CV, Stadtfeld M, Graf T. Determinants of lymphoid-myeloid lineage diversification. Annu Rev Immunol. 2006;24:705–738. doi: 10.1146/annurev.immunol.24.021605.090742. [DOI] [PubMed] [Google Scholar]
- 12.Cooper CL, Brady G, Bilia F, Iscove NN, Quesenberry PJ. Expression of the Id family helix-loop-helix regulators during growth and development in the hematopoietic system. Blood. 1997;89(9):3155–3165. [PubMed] [Google Scholar]
- 13.Jen Y, Weintraub H, Benezra R. Overexpression of Id protein inhibits the muscle differentiation program: in vivo association of Id with E2A proteins. Genes Dev. 1992;6(8):1466–1479. doi: 10.1101/gad.6.8.1466. [DOI] [PubMed] [Google Scholar]
- 14.Leeanansaksiri W, Wang H, Gooya JM, et al. IL-3 induces inhibitor of DNA-binding protein-1 in hemopoietic progenitor cells and promotes myeloid cell development. J Immunol. 2005;174(11):7014–7021. doi: 10.4049/jimmunol.174.11.7014. [DOI] [PubMed] [Google Scholar]
- 15.Lyden D, Young AZ, Zagzag D, et al. Id1 and Id3 are required for neurogenesis, angiogenesis and vascularization of tumour xenografts. Nature. 1999;401(6754):670–677. doi: 10.1038/44334. [DOI] [PubMed] [Google Scholar]
- 16.Bai G, Sheng N, Xie Z, et al. Id sustains Hes1 expression to inhibit precocious neurogenesis by releasing negative autoregulation of Hes1. Dev Cell. 2007;13(2):283–297. doi: 10.1016/j.devcel.2007.05.014. [DOI] [PubMed] [Google Scholar]
- 17.Buitenhuis M, van Deutekom HW, Verhagen LP, et al. Differential regulation of granulopoiesis by the basic helix-loop-helix transcriptional inhibitors Id1 and Id2. Blood. 2005;105(11):4272–4281. doi: 10.1182/blood-2004-12-4883. [DOI] [PubMed] [Google Scholar]
- 18.Lister J, Forrester WC, Baron MH. Inhibition of an erythroid differentiation switch by the helix-loop-helix protein Id1. J Biol Chem. 1995;270(30):17939–17946. doi: 10.1074/jbc.270.30.17939. [DOI] [PubMed] [Google Scholar]
- 19.Kawaguchi N, DeLuca HF, Noda M. Id gene expression and its suppression by 1,25-dihydroxyvitamin D3 in rat osteoblastic osteosarcoma cells. Proc Natl Acad Sci U S A. 1992;89(10):4569–4572. doi: 10.1073/pnas.89.10.4569. [DOI] [PMC free article] [PubMed] [Google Scholar]
- 20.Ogata T, Wozney JM, Benezra R, Noda M. Bone morphogenetic protein 2 transiently enhances expression of a gene, Id (inhibitor of differentiation), encoding a helix-loop-helix molecule in osteoblast-like cells. Proc Natl Acad Sci U S A. 1993;90(19):9219–9222. doi: 10.1073/pnas.90.19.9219. [DOI] [PMC free article] [PubMed] [Google Scholar]
- 21.Volpert OV, Pili R, Sikder HA, et al. Id1 regulates angiogenesis through transcriptional repression of thrombospondin-1. Cancer Cell. 2002;2(6):473–483. doi: 10.1016/s1535-6108(02)00209-x. [DOI] [PubMed] [Google Scholar]
- 22.Nishiyama K, Takaji K, Kataoka K, et al. Id1 gene transfer confers angiogenic property on fully differentiated endothelial cells and contributes to therapeutic angiogenesis. Circulation. 2005;112(18):2840–2850. doi: 10.1161/CIRCULATIONAHA.104.516898. [DOI] [PubMed] [Google Scholar]
- 23.Ohtani N, Zebedee Z, Huot TJ, et al. Opposing effects of Ets and Id proteins on p16INK4a expression during cellular senescence. Nature. 2001;409(6823):1067–1070. doi: 10.1038/35059131. [DOI] [PubMed] [Google Scholar]
- 24.Lee J, Kim K, Kim JH, et al. Id helix-loop-helix proteins negatively regulate TRANCE-mediated osteoclast differentiation. Blood. 2006;107(7):2686–2693. doi: 10.1182/blood-2005-07-2798. [DOI] [PMC free article] [PubMed] [Google Scholar]
- 25.Ying QL, Nichols J, Chambers I, Smith A. BMP induction of Id proteins suppresses differentiation and sustains embryonic stem cell self-renewal in collaboration with STAT3. Cell. 2003;115(3):281–292. doi: 10.1016/s0092-8674(03)00847-x. [DOI] [PubMed] [Google Scholar]
- 26.Hollnagel A, Oehlmann V, Heymer J, Ruther U, Nordheim A. Id genes are direct targets of bone morphogenetic protein induction in embryonic stem cells. J Biol Chem. 1999;274(28):19838–19845. doi: 10.1074/jbc.274.28.19838. [DOI] [PubMed] [Google Scholar]
- 27.Nakashima A, Katagiri T, Tamura M. Cross-talk between Wnt and bone morphogenetic protein 2 (BMP-2) signaling in differentiation pathway of C2C12 myoblasts. J Biol Chem. 2005;280(45):37660–37668. doi: 10.1074/jbc.M504612200. [DOI] [PubMed] [Google Scholar]
- 28.Liu Z, Tang Y, Qiu T, Cao X, Clemens TL. A dishevelled-1/Smad1 interaction couples WNT and bone morphogenetic protein signaling pathways in uncommitted bone marrow stromal cells. J Biol Chem. 2006;281(25):17156–17163. doi: 10.1074/jbc.M513812200. [DOI] [PubMed] [Google Scholar]
- 29.Valdimarsdottir G, Goumans MJ, Rosendahl A, et al. Stimulation of Id1 expression by bone morphogenetic protein is sufficient and necessary for bone morphogenetic protein-induced activation of endothelial cells. Circulation. 2002;106(17):2263–2270. doi: 10.1161/01.cir.0000033830.36431.46. [DOI] [PubMed] [Google Scholar]
- 30.Ruzinova MB, Schoer RA, Gerald W, et al. Effect of angiogenesis inhibition by Id loss and the contribution of bone-marrow-derived endothelial cells in spontaneous murine tumors. Cancer Cell. 2003;4(4):277–289. doi: 10.1016/s1535-6108(03)00240-x. [DOI] [PubMed] [Google Scholar]
- 31.Suh HC, Gooya J, Renn K, Friedman AD, Johnson PF, Keller JR. C/EBPalpha determines hematopoietic cell fate in multipotential progenitor cells by inhibiting erythroid differentiation and inducing myeloid differentiation. Blood. 2006;107(11):4308–4316. doi: 10.1182/blood-2005-06-2216. [DOI] [PMC free article] [PubMed] [Google Scholar]
- 32.Prabhu S, Ignatova A, Park ST, Sun XH. Regulation of the expression of cyclin-dependent kinase inhibitor p21 by E2A and Id proteins. Mol Cell Biol. 1997;17(10):5888–5896. doi: 10.1128/mcb.17.10.5888. [DOI] [PMC free article] [PubMed] [Google Scholar]
- 33.Maeda Y, Tsuji K, Nifuji A, Noda M. Inhibitory helix-loop-helix transcription factors Id1/Id3 promote bone formation in vivo. J Cell Biochem. 2004;93(2):337–344. doi: 10.1002/jcb.20154. [DOI] [PubMed] [Google Scholar]
- 34.Jankovic V, Ciarrocchi A, Boccuni P, DeBlasio T, Benezra R, Nimer SD. Id1 restrains myeloid commitment, maintaining the self-renewal capacity of hematopoietic stem cells. Proc Natl Acad Sci U S A. 2007;104(4):1260–1265. doi: 10.1073/pnas.0607894104. [DOI] [PMC free article] [PubMed] [Google Scholar]
- 35.Perry SS, Zhao Y, Nie L, Cochrane SW, Huang Z, Sun XH. Id1, but not Id3, directs long-term repopulating hematopoietic stem-cell maintenance. Blood. 2007;110(7):2351–2360. doi: 10.1182/blood-2007-01-069914. [DOI] [PMC free article] [PubMed] [Google Scholar]
- 36.Alani RM, Young AZ, Shifflett CB. Id1 regulation of cellular senescence through transcriptional repression of p16/Ink4a. Proc Natl Acad Sci U S A. 2001;98(14):7812–7816. doi: 10.1073/pnas.141235398. [DOI] [PMC free article] [PubMed] [Google Scholar]
- 37.Wagner W, Horn P, Castoldi M, et al. Replicative senescence of mesenchymal stem cells: a continuous and organized process. PLoS ONE. 2008;3(5):e2213. doi: 10.1371/journal.pone.0002213. [DOI] [PMC free article] [PubMed] [Google Scholar]
- 38.Prockop DJ. “Stemness” does not explain the repair of many tissues by mesenchymal stem/multipotent stromal cells (MSCs). Clin Pharmacol Ther. 2007;82(3):241–243. doi: 10.1038/sj.clpt.6100313. [DOI] [PubMed] [Google Scholar]
- 39.Shelton DN, Chang E, Whittier PS, Choi D, Funk WD. Microarray analysis of replicative senescence. Curr Biol. 1999;9(17):939–945. doi: 10.1016/s0960-9822(99)80420-5. [DOI] [PubMed] [Google Scholar]
- 40.Coppé JP, Kauser K, Campisi J, Beausejour CM. Secretion of vascular endothelial growth factor by primary human fibroblasts at senescence. J Biol Chem. 2006;281(40):29568–29574. doi: 10.1074/jbc.M603307200. [DOI] [PubMed] [Google Scholar]
- 41.Petit I, Szyper-Kravitz M, Nagler A, et al. G-CSF induces stem cell mobilization by decreasing bone marrow SDF-1 and up-regulating CXCR4. Nat Immunol. 2002;3(7):687–694. doi: 10.1038/ni813. [DOI] [PubMed] [Google Scholar]
- 42.Arai F, Hirao A, Ohmura M, et al. Tie2/angiopoietin-1 signaling regulates hematopoietic stem cell quiescence in the bone marrow niche. Cell. 2004;118(2):149–161. doi: 10.1016/j.cell.2004.07.004. [DOI] [PubMed] [Google Scholar]
- 43.Avecilla ST, Hattori K, Heissig B, et al. Chemokine-mediated interaction of hematopoietic progenitors with the bone marrow vascular niche is required for thrombopoiesis. Nat Med. 2004;10(1):64–71. doi: 10.1038/nm973. [DOI] [PubMed] [Google Scholar]
- 44.Fraidenraich D, Stillwell E, Romero E, et al. Rescue of cardiac defects in id knockout embryos by injection of embryonic stem cells. Science. 2004;306(5694):247–252. doi: 10.1126/science.1102612. [DOI] [PMC free article] [PubMed] [Google Scholar]
- 45.Gao D, Nolan DJ, Mellick AS, Bambino K, McDonnell K, Mittal V. Endothelial progenitor cells control the angiogenic switch in mouse lung metastasis. Science. 2008;319(5860):195–198. doi: 10.1126/science.1150224. [DOI] [PubMed] [Google Scholar]
- 46.Walkley CR, Shea JM, Sims NA, Purton LE, Orkin SH. Rb regulates interactions between hematopoietic stem cells and their bone marrow microenvironment. Cell. 2007;129(6):1081–1095. doi: 10.1016/j.cell.2007.03.055. [DOI] [PMC free article] [PubMed] [Google Scholar]
- 47.Chien WM, Rabin S, Macias E, et al. Genetic mosaics reveal both cell-autonomous and cell-nonautonomous function of murine p27Kip1. Proc Natl Acad Sci U S A. 2006;103(11):4122–4127. doi: 10.1073/pnas.0509514103. [DOI] [PMC free article] [PubMed] [Google Scholar]
Associated Data
This section collects any data citations, data availability statements, or supplementary materials included in this article.