Abstract
DDK syndrome is the polar-lethal embryonic death that occurs at the morula-blastocyst transition when female mice of the DDK strain are mated with males from many other inbred strains (so-called alien males). Embryonic death is caused by incompatibility between a DDK oocyte factor and an alien male gene, both of which map to the Om locus on mouse chromosome 11. We compared global transcription patterns of DDK × DDK embryos (high viability) and DDK × C57BL/6 embryos (low viability) at the morula stage, approximately 24 h before any morphological manifestations of DDK syndrome are observed. Of the transcripts that are differentially more abundant in the DDK × C57BL/6 embryos, many are the products of genes induced by the “unfolded protein response.” We confirmed by quantitative RT-PCR that a number of genes in this pathway are upregulated in the DDK × C57BL/6 embryos. Immunostaining of the endoplasmic reticulum (ER) marker BIP/GRP78 (immunoglobin-binding protein/glucose-regulated protein of 78 kDa), official symbol HSPA5, heat shock protein 5 revealed an accompanying abnormal HSPA5 accumulation and ER structure in the DDK × C57BL/6 embryos. Immunostaining for HERPUD1 (homocysteine-inducible, ER stress-inducible, ubiquitin-like domain member 1) and ATF4 (activating transcription factor 4) also revealed accumulation of these stress-response products. Our results indicate that the unfolded protein response is induced in embryos destined to die of DDK syndrome and that the embryonic death observed is associated with inability to resolve the associated ER stress.
Keywords: DDK syndrome, early development, embryo, epigenetics, unfolded protein response
The unfolded protein response contributes to embryonic death in the DDK syndrome.
INTRODUCTION
“DDK syndrome” is the term used to describe the embryonic death that occurs at the morula-blastocyst transition when female mice of the DDK strain are mated with males from many other inbred strains (“alien” males) [1–3]. The syndrome has attracted attention because of the combination of genetic factors and parental-origin effects that are required for embryonic death to occur. The embryos die because of incompatibility between an ooplasmic factor of DDK maternal origin and a paternal non-DDK (alien) gene [4–6]. Interactions between the ooplasm and the paternal pronucleus affect trophoblast function and blastocyst formation [4, 6], but the nature of the maternal-paternal factor interaction is unknown.
Several morphological and physiological abnormalities have been characterized in the dying embryos, including reduced gap junctional communication [7, 8], low intracellular pH [7, 8], and a tendency for compacted morula to “decompact” [3]. However, none of these morphological or physiological features suggests an obvious pathway by which lethality is induced.
The fact that the lethal phenotype is not fully penetrant, varies with a characteristic frequency (depending on the DDK and alien strain combination [3]), and requires both genetic (i.e., both DDK and alien strain-specific factors) and epigenetic (DDK maternal and alien strain paternal) factors suggests that the phenotype is caused by abnormal regulation of otherwise normal genes. In this context, DDK syndrome is an unusual “synthetic lethal” form [9]; in the context of each inbred strain, the lethal genes/gene products do not cause lethality. Synthetic lethality is explained most frequently as the result of individual gene defects in two parallel redundant pathways (disrupting both) or two defects in genes in a single pathway that are cumulative in their effect, resulting in disruption of the single essential pathway [10]. The DDK syndrome requirement for an epigenetic component (parental origin of the Om gene) suggests that the lethal phenotype, in this case, results from the abnormal regulation and interaction of genetically “different” but otherwise “normal” gene products.
Both the maternal and paternal genes responsible for DDK syndrome have been mapped to a 700-kb interval on chromosome 11 [11]. The compatible/incompatible paternal phenotype is in complete linkage disequilibrium with two single-nucleotide polymorphisms in the second intron of LOC435271 [11], a member of the schlafen gene family. Schlafen gene family members affect differentiation in the hematopoeitic lineage in vivo [12]. Schlafen family members also lead to G1 cell cycle arrest through repression of cyclin D1 in vitro [13], although there are conflicting reports on this point [14]. The paternal gene in the death of DDK syndrome embryos is a member of a gene family about which little is known (the family was first described by Schwartz et al. [12], and only 13 studies [11–23] have been published on schlafen family members. There is conflicting evidence about whether the expression of particular members results in cell cycle arrest or cell death; hence, it remains unclear what specific pathway links the schlafen gene family to the lethal phenotype. To discover what specific processes and pathways are altered in embryos destined to die of DDK syndrome, we compared global transcription patterns of DDK × DDK embryos (fully viable embryos, hereafter denoted as KK) and DDK × C57BL/6 embryos (90%-95% of these embryos die, hereafter denoted as KB). We compared the transcriptomes of morphologically normal KB embryos and healthy KK embryos at the morula stage, approximately 24 h before the appearance of any morphological manifestations of DDK syndrome using the mouse Affymetrix MOE430 v2.0 gene chip. We found a group of genes with higher transcript levels in the KB embryos, several of which are involved in the “unfolded protein response” (UPR) pathway. By real-time PCR, we confirmed independently that several genes in this pathway are upregulated in the KB embryos. Immunostaining of the endoplasmic reticulum (ER) marker HSPA5, heat shock protein A5 (also known as BIP/GRP78), confirmed abnormal accumulation and structure of the ER in the lethal embryos. Positive immunostaining for HERPUD1 (homocysteine-inducible, ER stress-inducible, ubiquitin-like domain member 1) and ATF4 (activating transcription factor 4) further demonstrated accumulation of these stress-response products. Pathway analysis of genes upregulated in KB embryos indicates that LOC435271 may transmit cell death signals through the UPR pathway and result in DDK syndrome embryonic death.
MATERIALS AND METHODS
Mouse Crosses and Collection of Mouse Embryos
The DDK inbred strain was a gift of Charles Babinet (Institute Pasteur, Paris, France) and has been maintained in a specific pathogen-free facility at Temple University Medical School since 1997. C57/BL6 mice were purchased from The Jackson Laboratory. Mice carrying the “40E” recombinant chromosome 11 were kindly provided by Fernando Pardo-Manuel de Villena (Carolina Center for Genome Sciences, Chapel Hill, NC). All studies adhered to procedures consistent with the National Research Council Guide for the Care and Use of Laboratory Animals.
All mice are maintained in a constant environment with 12L:12D. Morula-stage embryos were collected from 3- to 10-mo-old females after mating within the natural estrous cycle without hormone induction. Two types of embryos were collected: the KK group (DDK female mated with DDK male) and the KB group (DDK female mated with C57/BL6 male). For immunofluorescent staining, 40E mice were used instead of DDK inbred mice. The 40E mice are homozygous for DDK alleles at the Om locus and were used instead of the DDK inbred strain because of greater availability. The reproductive performance of 40E animals, with respect to DDK syndrome, is identical to that of the DDK inbred strain [11, 24]. Mice were checked for copulation plugs each morning, and the embryos were flushed from the reproductive tract on the morning of Day 4 (day of copulation plug denoted as Day 1) using M2 medium (Sigma).
RNA Extraction, Labeling, and Hybridization
For each KK and KB group, three pools of 30 embryos were collected and transferred to 20 μl of extraction buffer (Picopure kit; Molecular Devices). The tube was incubated at 42°C for 30 min and then stored at −70°C. RNA extraction was performed with the Picopure RNA extraction kit according to the manufacturer's instructions for small sample preparation. For each sample, the mRNA population was reverse transcribed. The cDNA was used for a first round of in vitro transcription, followed by random priming and a second round of reverse transcription and in vitro transcription to achieve a linear amplification (Small Sample Technical Bulletin; Affymetrix), with the following minor modifications: the initial volume for mRNA annealing was raised to 5 μl, and the conditions for reverse transcription were 30 min at 42°C, followed by 30 min at 45°C to increase the reaction efficiency in guanine-cytosine-rich regions of mRNA. The final yield of biotinylated cRNA was 30–80 μg. Twenty micrograms of cRNA per replicate was fragmented and 10 μg hybridized to Affymetrix MOE 430 2.0 Gene Chips, then washed and stained on fluidic stations, and then scanned according to the manufacturer's instructions.
Microarray Data Analysis
Microarray Analysis Suite 5.0 (Affymetrix) was used to quantify microarray signals with default analysis parameters and global scaling to target a mean signal equal to 150 U. The Microarray Analysis Suite 5.0 metric output was loaded into GeneSpring v7 (Silicon Genetics) with per-chip normalization to the 50th percentile and per-gene normalization to the median. To minimize false-positive signals, only genes “Present” in at least two of three replicates in one embryo kind/condition were used for further analysis with all statistical packages. The K-means hierarchical clustering of GeneSpring v7 was used to divide the data into groups based on expression patterns and to produce groups with a high degree of similarity within groups and a low degree of similarity between groups. Although the Affymetrix MOE430 v2.0 array interrogates one gene with every probe set, 14.7% of the genes present on the array are represented by more than one probe set. All analyses described were performed using the Affymetrix probe set lists.
The filtered Microarray Analysis Suite 5.0 metrics output was loaded into TIGR-MEV v3.0.3 [25]. The Statistical Analysis of Microarray algorithm [26] was applied to identify genes with significant differences among KB and KK embryos at the 5% false discovery rate.
Fold-changes of expression differences in KB and KK embryos were calculated after Statistical Analysis of Microarray analysis. The resulting lists of differentially expressed genes (Supplemental Table 1 available at www.biolreprod.org) were imported into Expression Analysis Systematic Explorer (EASE, version 2.0) to analyze gene ontology for overrepresentation [27]. EASE is an algorithm designed to analyze a list of candidate genes against a set population (in our case, the list of genes detected on the Gene Chip) and to report a score that is the expression of the likelihood of overrepresentation in the Gene Ontology Consortium (GO) annotation categories for biological process, molecular function, or cellular component. EASE score was calculated for likelihood of overrepresentation of annotation classes, and only GO biological processes with an EASE score of less than 5% are shown. A significant EASE score does not relate to an increased fold-change or overall expression significance but merely a higher than expected number of transcripts falling into a GO annotation category. The filtered list of transcripts overexpressed in KB embryos was further imported into Ingenuity Pathway Analysis (www.ingenuity.com) to detect networks detailing physical association or functional interaction among transcripts falling into different GO annotation categories.
Quantitative mRNA Expression Analysis
For each KK and KB group, three pools of seven morulae were collected. RNA was extracted using the Picopure RNA extraction kit. Reverse transcription and total cDNA amplification by PCR were performed as previously described [28–30]. The 3′ termini of the entire mRNA population are amplified quantitatively without altering relative sequence abundance. The RT-PCR method yields highly representative cDNA libraries [28, 31–33]. The amplified cDNA was then analyzed by real-time PCR using LightCycler DNA Master SYBR Green I (Roche Applied Science) according to the manufacturer's protocol. The cDNA was diluted 1:8, and 1 μl of the diluted cDNA was used in each 20-μl PCR reaction using primers listed in Table 1. The cytochrome c oxidase subunit VII (Cox7c) mRNA was assayed as an internal control to aid quantitation. This mRNA is induced and expressed at a high constitutive level from the eight-cell stage onward [34] and is therefore ideal as an internal standard for embryos collected after the eight-cell stage. All Cox7c probes present on the array detect similar amounts of Cox7c mRNA in both groups of embryos (see Supplemental Table 3). The differences in mRNA expression between the KB and KK groups were calculated using the 2−ΔΔCT method [35].
TABLE 1.
Primers for real-time PCR.
Immunofluorescent Staining
Embryos at the morula stage were fixed in 4% paraformaldehyde in PBS for 30 min and then washed three times in PBS and permeabilized with PBS-0.05% Triton X-100 for 30 min, followed by incubation in PBS-2% bovine serum albumin for 30 min. To detect HERPUD1 or ATF4 and HSPA5 simultaneously, 0.2 μg/ml of anti-HERPUD1 rabbit antibody (Protein Tech Group) or 2.5 μg/ml of anti-ATF4 rabbit antibody (Lifespan Biosciences), and 10 μg/ml of anti-KDEL mouse monoclonal antibody (Stressgen) were added to embryos for overnight incubation at 4°C. After washing three times in 0.01% Triton X-100 and 0.1% Tween-20 in PBS, embryos were incubated for 1 h with both Red-X goat anti-rabbit IgG (H+L) (20μg/ml; Invitrogen) and fluorescein isothiocyanate anti-mouse IgG (H+L) F(ab′)2 fragment (10 μg/ml; Kirkegaard & Perry Laboratories). After two washes in 0.01% Triton X-100 and 0.1% Tween-20 in PBS and one wash with PBS, embryos were placed on slides with Citifluor (AF1; Citifluor Products), covered with a coverslip, and sealed with nail polish. Fluorescence was visualized on an inverted Olympus microscope (Olympus America Inc.) equipped with Fluorview confocal laser scanning software (Olympus). The 488-nm (argon) and 568-nm (krypton) wavelengths of the laser were used for the excitation of fluorescein isothiocyanate and propidium iodide fluorescence, respectively. ImageJ software (National Institutes of Health) was used to quantify total embryo fluorescence.
RESULTS
Microarray Analysis
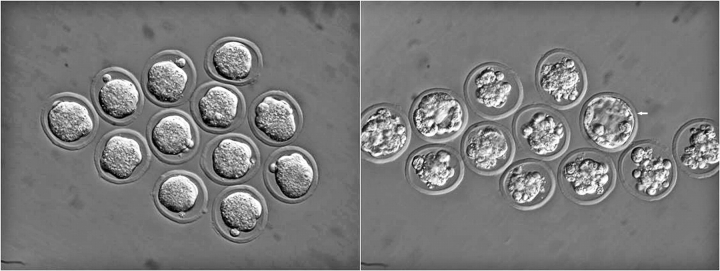
We compared mRNA expression profiles of KK morula-stage embryos with those of KB morula-stage embryos. This developmental stage was selected because both groups of embryos appear morphologically normal at this stage, but more than 90% of the KB embryos die within the next 24 h [2] (Fig. 1). We reasoned that only one or two cell divisions take place between the time at which the embryos appear morphologically normal and the time at which they are grossly abnormal/dying, so that any cell death pathway is likely to be induced around the time at which we collected embryo samples. We used three replicates of each group, with 30 embryos per replicate. RNA was extracted from each embryo pool, and cRNA was amplified and hybridized as described (see Materials and Methods) to the Affymetrix MOE 430 v.2 chip, which contains 49 000 different probes corresponding to approximately 35 000 different transcripts.
FIG. 1.
DDK syndrome preimplantation embryos from DDK females × C57BL/6 males. Left panel of embryos appears morphologically normal at the morula stage. Right panel shows same embryos degenerating after 1 day of additional culture. Arrow in right panel indicates one morphologically normal blastocyst. Original magnification ×200.
Among the six arrays, percentage present call ranged from 36.87% to 40.20% corresponding to 45 101 probe sets, which is well within the acceptable range [36, 37], and an overall presence call of 36.5% (1.9 × 10⁴ of 5.2 × 10⁴ probe sets). The other quality control parameters for all the samples were scale factor of 1.139 to 1.68 (accepted range, 0.5–5.0) and background of 37.04 to 46.29 (accepted range, 20–100). Tabular data for all samples are available at the Gene Expression Omnibus repository (www.ncbi.nlm.nih.gov/geo).
Hierarchical clustering of the replicates (Fig. 2) indicated that the KK replicates cluster together. It also indicated that their transcriptional profile is distinct from that of the KB replicates, which also clustered together.
FIG. 2.
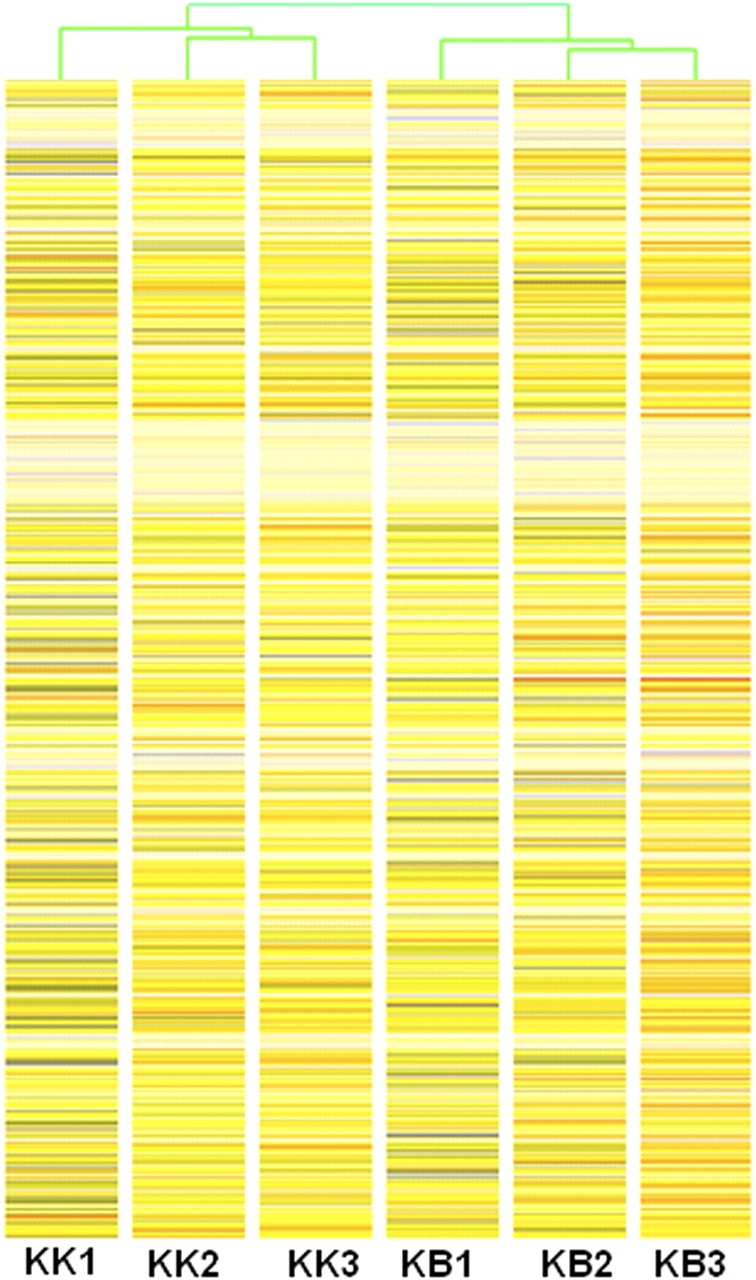
Hierarchical clustering analysis of sample replicates based on transcript levels in each of three replicates of 30 embryos each from the cross DDK × DDK (KK1, KK2, and KK3 on the left) and from the cross DDK × C57BL/6 (KB1, KB2, and KB3 on the right).
Comparison of the total transcript profiles using Statistical Analysis of Microarray at a 5% false discovery rate indicated that transcripts corresponding to 83 of the probes were present at significantly higher levels in KB embryos than in KK embryos, while five transcripts were present at lower levels in KB embryos. These results are summarized in Supplemental Table 1.
Messenger RNA Expression Analysis
To confirm differential transcript levels between the two types of embryos, we isolated RNA and quantitatively amplified the mRNA using a well-established protocol developed originally by Brady and Iscove [28] that amplifies the cDNA population, while preserving the individual sequence representation. The amplified cDNA was then analyzed by real-time PCR to compare expression of specific mRNAs. Of 11 genes tested for increased levels of mRNA in KB embryos, nine also seemed to be present at higher levels by real-time PCR (Fig. 3). These data thus confirm differential expression for most genes assayed.
FIG. 3.
Comparison between relative expression by microarray analysis (black bars) and relative expression by real-time PCR (white bars) for 11 genes estimated to be upregulated in KB embryos compared with KK embryos by transcriptional profiling (using Affymetrix MOE430 v2.0).
Although our results with KB morula-stage embryos should not be expected to be directly comparable to the transcriptional profiles of wild-type embryos of other inbred strain combinations, we note that 10 of 11 genes examined by real-time PCR also seem to be overexpressed in KB morulae compared with (CF1XB6D2F1) eight-cell embryos [38]. This does not seem to be the result of hybridization differences due to probe/target single-nucleotide polymorphisms or of comparisons between embryos of slightly different stages. The KK morulae showed almost expression compared with (CF1XB6D2F1) eight-cell embryos at six of 11 loci and slightly lower expression at the other five loci (data not shown).
Biological Functions of Differentially Expressed mRNAs
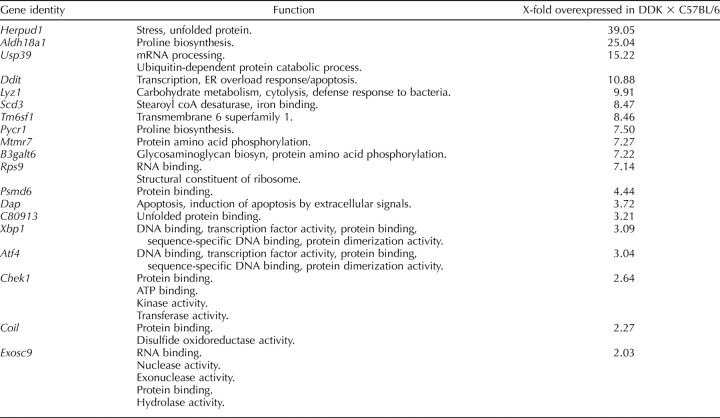
The first 10 genes whose transcripts were identified as differentially abundant in KB embryos are ranked in Table 2 (Supplemental Table 1 lists all 83 probes with a significant P value). In ranking the genes, multiple probes corresponding to the same gene have not been included nor have probes corresponding only to unannotated or poorly annotated genes (i.e., Riken cDNAs), as we are attempting to identify the pathway leading to the death of these embryos. Three of the first four genes in Table 2 are involved in the UPR. The UPR is an intracellular signaling pathway that transmits information about protein folding status in the ER to the cytoplasm and the nucleus [39]. The UPR includes transcriptional induction of a number of UPR genes, translational attenuation of global protein synthesis, and ER-associated degradation [40]. The UPR leads to apoptosis if the protein folding defect is not corrected [41].
TABLE 2.
Top 10 genes upregulated in DDK × C57BL/6 embryos and other upregulated genes.
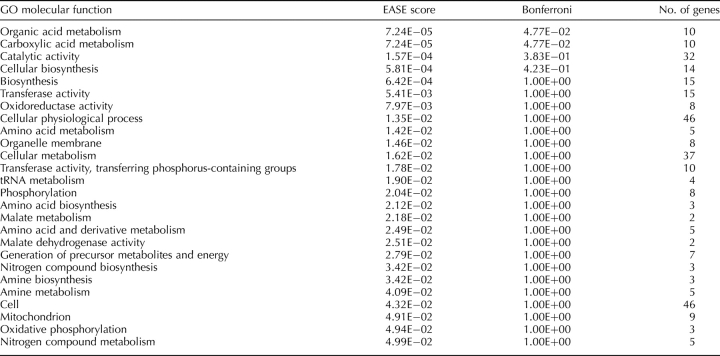
We also analyzed the list of genes that were differentially more abundant in KB embryos using EASE to analyze the gene ontology for overrepresentation [27]. EASE score was calculated for likelihood of overrepresentation of annotation classes, and only biological processes with an EASE score of less than 5% are given (Table 3). Among the transcripts overrepresented in KB morulae, EASE analysis identified two GO categories with a Bonferroni-corrected EASE score of less than 0.05 (Table 3). These two GO categories point to abnormal metabolism of organic and carboxylic acids, which may help to explain the observed abnormality in intracellular pH [7, 8]. In addition, GO categories with significant uncorrected EASE scores include those involving amino acid biosynthesis, amino acid metabolism, and tRNA metabolism. These pathways are also expected to be disrupted if the UPR is induced, leading to disruption of protein synthesis.
TABLE 3.
EASE analysis for genes upregulated in KB morulae compared with KK.
The five transcripts found to be present at lower levels in KB embryos than in KK embryos do not have any GO categories in common, and we were unable to confirm that catalase (Supplemental Table 2), stress 70 protein chaperone, or RNA-binding motif protein 39 (not shown in Supplemental Table 2 but for which lower transcript levels were observed on the array) was present at lower levels in KB embryos. We did not pursue these genes further.
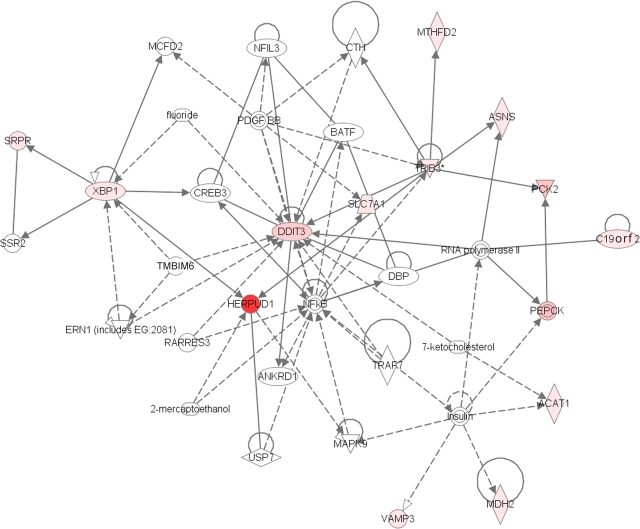
We also used Ingenuity Pathway Analysis to discover networks of genes that were expressed at higher levels in KB embryos and that may interact in the UPR pathway (Fig. 4). With respect to the map location of the genes responsible for DDK syndrome, one of the schlafen gene family members (Slfn1) (see Discussion) is found in the network, although it is not differentially abundant between the two classes of embryos.
FIG. 4.
HERPUD1 Ingenuity Pathway Analysis illustrates interactions between indicated proteins. The shaded symbols indicate proteins encoded by transcripts that are more abundant in KB embryos. The unshaded symbols were not identified as differentially expressed but were integrated into the computationally generated networks on the basis of evidence stored in the Ingenuity Pathway Analysis knowledge memory indicating relevance to this network. The symbol shapes denote enzymes (diamond), kinases (triangle), transcription factors (ellipse), transporters (trapezoid), and other (circle).
Examination of ER and ER Stress Response by Immunofluorescence
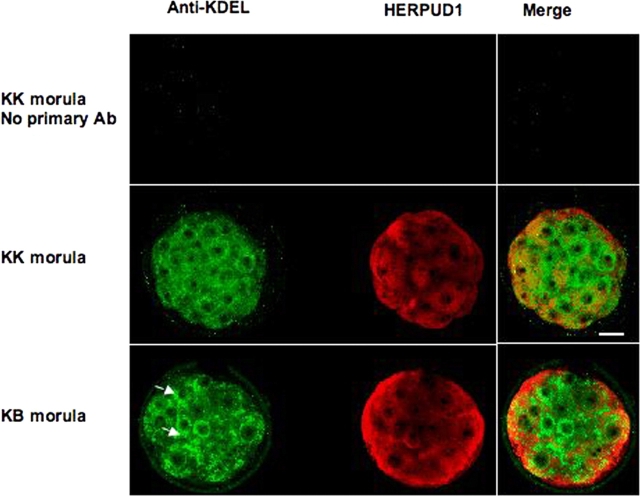
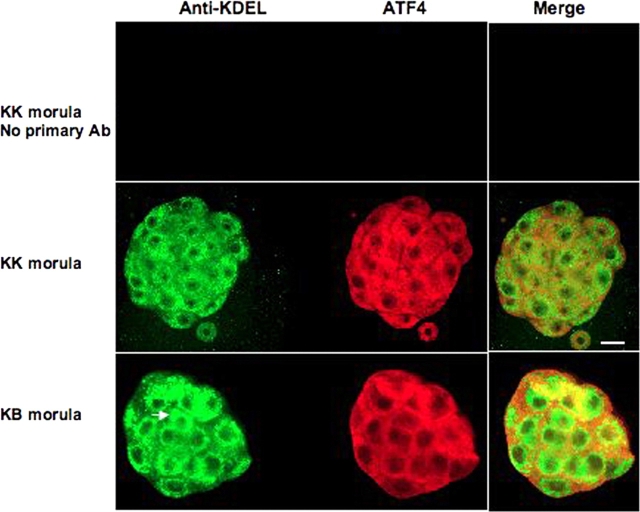
If KB embryos are dying as a result of inducing the UPR, one might expect abnormal amount or structure of the ER in embryos from the lethal cross. We examined KK and KB embryos by immunofluorescence using anti-KDEL antibodies specific to the ER marker HSPA5. We also performed immunofluorescence with antibodies against HERPUD1 and ATF4, both of which are involved in the UPR and show increased mRNA level in the KB embryos. Although the morphological differences between the two genotypic classes of embryos are not striking at this stage (both classes of embryos appear similar to the KB embryos in the left panel of Figure 1 (i.e., normal morulae), 90%–95% of the KB embryos die within 24 h (Fig. 1, right panel).
On immunostaining for HSPA5, the ER in KB embryos appears more prominent and seems less regular in shape and perinuclear location than the ER in KK embryos (Figs. 5 and 6). Although HERPUD1 does not colocalize with the ER in either class of embryos (nor in control embryos of other genotypes [data not shown]), by comparing merge images HERPUD1 appears to be more abundant in KB embryos (total fluorescence by ImageJ software [see Materials and Methods], 114 U for KK and 141 U for KB), and ATF4 appears more intense in KB embryos (total fluorescence, 90 U for KK and 124 U for KB).
FIG. 5.
Confocal images of immunofluorescence of KK and KB morula-stage embryos. Anti-KDEL recognizes HSPA5 (detected in green), which is an integral component of ER, and HERPUD1 is linked to ER stress. Ninety-five percent of KB embryos die within 24 h of the morula stage. Arrows in KB embryo indicate areas in which ER appears to be more prominent than in KK embryos. Red fluorescence (HERPUD1) also appears more intense in KB embryo (compare merge images and see text). Ab, antibody. Bar = 20 μm.
FIG. 6.
Confocal images of immunofluorescence of KK and KB morula-stage embryos. Anti-KDEL recognizes HSPA5 (detected in green), which is an integral component of ER, and ATF4 is linked to ER stress. Arrow in KB embryo indicates areas in which ER appears to be more prominent than in KK embryos. Red fluorescence (ATF4) also appears more intense in KB embryos (compare merge images and see text). Ab, antibody. Bar = 20 μm.
Transient “Rescue” of DDK Syndrome Embryos Reduces Abnormal ER Characteristics
Previous studies [7, 8] have shown that DDK syndrome embryos have a comparatively low intracellular pH of approximately 6.65 (compared with a pH of approximately 7.15 for control embryos). Artificially increasing intracellular pH by incubating the four- to 16-cell embryos in the weak base methylamine increases the rate of blastocyst formation dramatically [7]. If ER stress is associated with DDK syndrome embryo death, one might expect that treatments that increase embryo survival would also reduce abnormal ER accumulation and localization. We divided a group of KB embryos into two groups and treated one group with 10 μM methylamine for 6 h at the eight-cell stage. At the end of the treatment period, each group of embryos was fixed, and the ER amount and localization were examined by immunofluorescence using the same ATF4 and KDEL antibodies used in Figure 6. The merged images are shown in Figure 7 and indicate that the untreated embryos (first column) as a group have more abnormal localization of KDEL immunofluorescence than the treated embryos. We also quantified the KDEL fluorescence of each embryo (Fig. 8) using ImageJ software (see Materials and Methods). The mean fluorescence of the treated group is significantly lower than that of the untreated group (mean arbitrary fluorescence, 237.05 versus 304.35 U; P < 0.01). These results indicate that methylamine treatment of KB embryos decreases both amount and abnormal localization of ER.
FIG. 7.
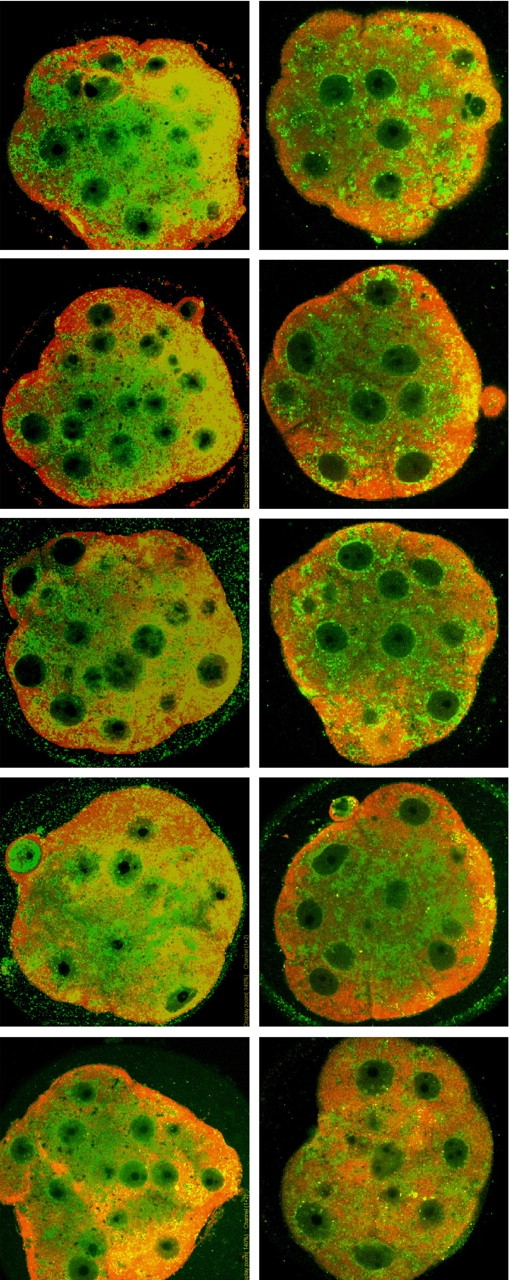
Merged confocal images of immunofluorescent staining. Anti-KDEL (recognizes HSPA5) detected in green; ATF4 detected in red. Left column: KB morulae without methylamine treatment; right column: KB morulae with methylamine treatment.
FIG. 8.

Confocal images of embryos in Figure 7 showing only anti-KDEL staining (recognizes HSPA5, detected in green). Left column: KB morulae without methylamine treatment; right column: KB morulae with methylamine treatment. Bar height in graph at base shows the mean ± SD fluorescence of each group (P < 0.01).
DISCUSSION
We examined the global transcription profile of preimplantation embryos that are destined to die as a result of DDK syndrome to identify the biochemical pathway that leads to embryonic death. Our analysis indicates that multiple genes in the UPR are upregulated before the appearance of the morphological abnormalities that are characteristic of DDK syndrome embryos. The so-called ER stress resulting from the accumulation of improperly folded proteins is known to lead to apoptotic cell death, if uncorrected, in multiple systems [40, 41].
Embryos that die of DDK syndrome have morphological characteristics of apoptotic death such as cell blebbing (Fig. 1, right panel). The morula-stage embryos we examined by transcriptional profiling appear morphologically normal and healthy (Fig. 1, left panel), and we find little evidence of upregulation of several genes central to apoptotic pathways (Supplemental Table 3). However, Dap mRNA levels are approximately 3.5-fold higher in KB embryos than in KK embryos. Gozuacik et al. [42] reported that DAP kinase is a key mediator of ER stress-induced caspase activation. We did not observe increased mRNA in KB embryos over that in KK embryos for caspase 3, 7, 8, or 9 on the microarray (Supplemental Table 3). We detected low levels of proapoptotic caspases 3 and 7 in both groups of embryos; however, normal eight-cell and blastocyst-stage embryos also express low to moderate levels of these mRNAs in an apparent stage-specific manner [43]. It is possible that caspase activity is not regulated at the level of transcription in preimplantation embryos, as mRNA levels of caspases 3 and 7 could not be used as a reliable indicator of apoptosis in bovine blastocysts [44]. Overall, the ER accumulation and abnormal localization seen in DDK syndrome embryos (Figs. 5 and 6) support the transcriptional profile of DDK syndrome embryos, indicating that embryonic death is associated with a failure to resolve ER stress.
Artificially increasing the intracellular pH of eight-cell DDK syndrome embryos by incubation in the weak base methylamine resulted in a significant decrease in amount and abnormal localization of ER in treated embryos (Fig. 6). Methylamine treatment is reported to increase intracellular pH by approximately 0.5 U and dramatically improves embryo development to the blastocyst stage [7]. The cause of the 0.5-U difference in pH between DDK syndrome and control embryos is unknown, but it is noteworthy that the two GO gene categories that remain significantly different between the two types of embryos after correction for multiple testing are the organic acid metabolism and the carboxylic acid metabolism categories (Table 3). In addition, many of the individual genes that appear upregulated in KB embryos are involved in the synthesis, transport, and modification of amino acids (Table 2 and Supplemental Table 1). Any large-scale disruption in amino acid metabolism is likely to affect cellular pH and many cellular processes, including defects in gap junctional communication [7, 8] and protein folding. It is unclear whether KB embryos might suffer from a general disruption in protein folding or whether a specific improperly folded protein accumulates and leads to the response.
The association between death of DDK syndrome embryos and induction of the UPR may result from the UPR being a default pathway that is implemented as a result of a primary defect in amino acid metabolism; alternatively, the ER stress may be caused by a primary defect in protein folding, and the resulting effects on protein synthesis may lead to disruption of amino acid metabolism. The fact that DDK syndrome is initiated at the one-cell stage [6] makes it difficult to conclude that the primary genetic or epigenetic defects affect the UPR directly. However, the identity of the paternal gene [11] as part of a gene family whose members have biochemical functions that could have such a role (see discussion herein) is suggestive. In any case, the dramatic increase in blastocyst formation after incubation in methylamine [7] or forskolin [8] and the fact that 5%–10% of KB embryos appear as morphologically normal blastocysts (and are capable of becoming viable and fertile adults [3]) suggest that one or both of the DDK ooplasmic factor and the factor provided by the alien paternal gene are not present or required after preimplantation development.
The lethally interacting paternal gene LOC435271 [11] is a member of the schlafen gene family, of which at least two members (Slfn1 and Slfn2) cause cell cycle arrest [12, 13]. Although LOC435271 is not present as a probe on the array, it is expressed during preimplantation development (data not shown), as is Slfn1 (data not shown). The identification of LOC435271 as the lethally interacting alien paternal gene in DDK syndrome suggests that expression of this member of the schlafen family leads to cell death, although the nature of the connection between LOC435271 and the UPR pathway is unknown. In this regard, another schlafen family member, Slfn1, is linked to several UPR genes that are upregulated in KB embryos (Table 2) by Ingenuity pathway analysis (e.g., Herpud1, Ddit3, and Xbp1 [Fig. 3]).
LOC435271 has a divergent “AAA domain,” as do all of the schlafen family members. Classical AAA domain-containing proteins bind and hydrolyze guanosine triphosphate and ATP and perform diverse cellular functions that require energy, including protein folding and degradation [45]. That the expression of alien alleles of LOC435271 from the paternal genome might lead to induction of the UPR and embryonic death only in conjunction with DDK ooplasm suggests that a protein-protein interaction may be disrupted. Because models for AAA domain-containing protein function are based on associations of protein oligomers [45], it is not unreasonable to speculate that the protein encoded by the DDK allele at this locus is incompatible with the alien version of this protein in oligomeric complexes. Under this model, the reason that (alien female × DDK male) embryos are viable and (DDK female × alien male) embryos are not is that the former may express only one allele (or no alleles) at this locus, while the latter are predicted to express both alleles during early embryogenesis. This “dominant-negative” mode of action speculation is a mirror image hypothesis of our original genetic model for DDK syndrome [46], in which we proposed that a gene expressed from only the maternal allele in alien strains became expressed from only the paternal allele in DDK syndrome, resulting in the expression of neither allele in (DDK female × alien male) embryos. The inactivation of an oligomeric complex by incompatible subunits is a biochemically distinct but formally similar mechanism. This scenario is capable of explaining the epigenetic requirements of DDK syndrome. However, the genetic composition of extant inbred strains, with respect to whether they carry DDK female-compatible or DDK female-incompatible alleles at the paternal gene, suggests that maternal and paternal components of DDK syndrome are encoded by different genes [11]. However, the published observations require only that the incompatible maternal and paternal factors are different mutations [11] and do not exclude the possibility that they are different mutations within the same gene. The predictions of this model are being tested.
Supplementary Material
Footnotes
1Supported in part by grants from the National Institutes of Health, National Institute of Child Health and Human Development (R01 HD41440 and RR18907 to K.E.L. and HD34508 to C.S.).
REFERENCES
- Tomita T.One-side cross sterility between inbred strains of mice. Jpn J Genet 1960; 35: 291.(abstract). [Google Scholar]
- Wakasugi N.Studies on fertility of DDK mice: reciprocal crosses between DDK and C57BL/6J strains and experimental transplantation of the ovary. J Reprod Fertil 1973; 33: 283–291. [DOI] [PubMed] [Google Scholar]
- Wakasugi N.A genetically determined incompatibility system between spermatozoa and eggs leading to embryonic death in mice. J Reprod Fertil 1974; 41: 85–96. [DOI] [PubMed] [Google Scholar]
- Babinet C, Richoux V, Guenet JL, Renard JP.The DDK inbred strain as a model for the study of interactions between parental genomes and egg cytoplasm in mouse preimplantation development. Dev Suppl 1990: 81–87. [PubMed]
- Mann JR.DDK egg-foreign sperm incompatibility in mice is not between the pronuclei. J Reprod Fertil 1986; 76: 779–781. [DOI] [PubMed] [Google Scholar]
- Renard JP, Babinet C.Identification of a paternal developmental effect on the cytoplasm of one-cell-stage mouse embryos. Proc Natl Acad Sci U S A 1986; 83: 6883–6886. [DOI] [PMC free article] [PubMed] [Google Scholar]
- Buehr M, Lee S, McLaren A, Warner A.Reduced gap junctional communication is associated with the lethal condition characteristic of DDK mouse eggs fertilized by foreign sperm. Development 1987; 101: 449–459. [DOI] [PubMed] [Google Scholar]
- Leclerc C, Becker D, Buehr M, Warner A.Low intracellular pH is involved in the early embryonic death of DDK mouse eggs fertilized by alien sperm. Dev Dyn 1994; 200: 257–267. [DOI] [PubMed] [Google Scholar]
- Dobzhansky T.Genetics of natural populations, XIII: recombination and variability in populations of Drosophila pseudoobscura. Genetics 1946; 31: 269–290. [DOI] [PMC free article] [PubMed] [Google Scholar]
- Tucker CL, Fields S.Lethal combinations. Nat Genet 2003; 35: 204–205. [DOI] [PubMed] [Google Scholar]
- Bell TA, de la Casa-Esperon E, Doherty HE, Ideraabdullah F, Kim K, Wang Y, Lange LA, Wilhemsen K, Lange EM, Sapienza C, de Villena FP.The paternal gene of the DDK syndrome maps to the Schlafen gene cluster on mouse chromosome 11. Genetics 2006; 172: 411–423. [DOI] [PMC free article] [PubMed] [Google Scholar]
- Schwarz DA, Katayama CD, Hedrick SM.Schlafen, a new family of growth regulatory genes that affect thymocyte development. Immunity 1998; 9: 657–668. [DOI] [PubMed] [Google Scholar]
- Brady G, Boggan L, Bowie A, O'Neill LA.Schlafen-1 causes a cell cycle arrest by inhibiting induction of cyclin D1. J Biol Chem 2005; 280: 30723–30734. [DOI] [PubMed] [Google Scholar]
- Zhao L, Neumann B, Murphy K, Silke J, Gonda TJ.Lack of reproducible growth inhibition by Schlafen1 and Schlafen2 in vitro. Blood Cells Mol Dis 2008; 41: 188–193. [DOI] [PubMed] [Google Scholar]
- Afonso CL, Tulman ER, Lu Z, Zsak L, Sandybaev NT, Kerembekova UZ, Zaitsev VL, Kutish GF, Rock DL.The genome of camelpox virus. Virology 2002; 295: 1–9. [DOI] [PubMed] [Google Scholar]
- Cohen-Tannoudji M, Vandormael-Pournin S, Le Bras S, Coumailleau F, Babinet C, Baldacci P.A 2-Mb YAC/BAC-based physical map of the ovum mutant (Om) locus region on mouse chromosome 11. Genomics 2000; 68: 273–282. [DOI] [PubMed] [Google Scholar]
- Fujikado N, Saijo S, Iwakura Y.Identification of arthritis-related gene clusters by microarray analysis of two independent mouse models for rheumatoid arthritis. Arthritis Res Ther 2006; 8: eR100 [DOI] [PMC free article] [PubMed] [Google Scholar]
- Geserick P, Kaiser F, Klemm U, Kaufmann SH, Zerrahn J.Modulation of T cell development and activation by novel members of the Schlafen (slfn) gene family harbouring an RNA helicase-like motif. Int Immunol 2004; 16: 1535–1548. [DOI] [PubMed] [Google Scholar]
- Gubser C, Goodbody R, Ecker A, Brady G, O'Neill LA, Jacobs N, Smith GL.Camelpox virus encodes a schlafen-like protein that affects orthopoxvirus virulence. J Gen Virol 2007; 88: 1667–1676. [DOI] [PMC free article] [PubMed] [Google Scholar]
- Lund S, Christensen KV, Hedtjarn M, Mortensen AL, Hagberg H, Falsig J, Hasseldam H, Schrattenholz A, Porzgen P, Leist M.The dynamics of the LPS triggered inflammatory response of murine microglia under different culture and in vivo conditions. J Neuroimmunol 2006; 180: 71–87. [DOI] [PubMed] [Google Scholar]
- Neumann B, Zhao L, Murphy K, Gonda TJ.Subcellular localization of the Schlafen protein family. Biochem Biophys Res Commun 2008; 370: 62–66. [DOI] [PubMed] [Google Scholar]
- Sohn WJ, Kim D, Lee KW, Kim MS, Kwon S, Lee Y, Kim DS, Kwon HJ.Novel transcriptional regulation of the schlafen-2 gene in macrophages in response to TLR-triggered stimulation. Mol Immunol 2007; 44: 3273–3282. [DOI] [PubMed] [Google Scholar]
- Zhang Y, Yang Z, Cao Y, Zhang S, Li H, Huang Y, Ding YQ, Liu X.The Hsp40 family chaperone protein DnaJB6 enhances Schlafen1 nuclear localization which is critical for promotion of cell-cycle arrest in T-cells. Biochem J 2008; 413: 239–250. [DOI] [PubMed] [Google Scholar]
- Pardo-Manuel De Villena F, de la Casa-Esperon E, Williams JW, Malette JM, Rosa M, Sapienza C.Heritability of the maternal meiotic drive system linked to Om and high-resolution mapping of the Responder locus in mouse. Genetics 2000; 155: 283–289. [DOI] [PMC free article] [PubMed] [Google Scholar]
- Saeed AI, Sharov V, White J, Li J, Liang W, Bhagabati N, Braisted J, Klapa M, Currier T, Thiagarajan M, Sturn A, Snuffin M, et al. TM4: a free, open-source system for microarray data management and analysis. Biotechniques 2003; 34: 374–378. [DOI] [PubMed] [Google Scholar]
- Tusher VG, Tibshirani R, Chu G.Significance analysis of microarrays applied to the ionizing radiation response. Proc Natl Acad Sci U S A 2001; 98: 5116–5121. [DOI] [PMC free article] [PubMed] [Google Scholar]
- Hosack DA, Dennis G, Jr, Sherman BT, Lane HC, Lempicki RA.Identifying biological themes within lists of genes with EASE. Genome Biol 2003; 4: eR70 [DOI] [PMC free article] [PubMed] [Google Scholar]
- Brady G, Iscove NN.Construction of cDNA libraries from single cells. Methods Enzymol 1993; 225: 611–623. [DOI] [PubMed] [Google Scholar]
- Latham KE, de la Casa-Esperon E, Schultz RM.Analysis of mRNA expression during preimplantation development. Methods Mol Biol 2000; 136: 315–331. [DOI] [PubMed] [Google Scholar]
- Rambhatla L, Patel B, Dhanasekaran N, Latham KE.Analysis of G protein alpha subunit mRNA abundance in preimplantation mouse embryos using a rapid, quantitative RT-PCR approach. Mol Reprod Dev 1995; 41: 314–324. [DOI] [PubMed] [Google Scholar]
- Brady G, Billia F, Knox J, Hoang T, Kirsch IR, Voura EB, Hawley RG, Cumming R, Buchwald M, Siminovitch K.Analysis of gene expression in a complex differentiation hierarchy by global amplification of cDNA from single cells. Curr Biol 1995; 5: 909–922. [DOI] [PubMed] [Google Scholar]
- Cano-Gauci DF, Lualdi JC, Ouellette AJ, Brady G, Iscove NN, Buick RN.In vitro cDNA amplification from individual intestinal crypts: a novel approach to the study of differential gene expression along the crypt-villus axis. Exp Cell Res 1993; 208: 344–349. [DOI] [PubMed] [Google Scholar]
- Iscove NN, Barbara M, Gu M, Gibson M, Modi C, Winegarden N.Representation is faithfully preserved in global cDNA amplified exponentially from sub-picogram quantities of mRNA. Nat Biotechnol 2002; 20: 940–943. [DOI] [PubMed] [Google Scholar]
- Mann M, Latham KE, Varmuza S.Identification of genes showing altered expression in preimplantation and early postimplantation parthenogenetic embryos. Dev Genet 1995; 17: 223–232. [DOI] [PubMed] [Google Scholar]
- Livak KJ, Schmittgen TD.Analysis of relative gene expression data using real-time quantitative PCR and the 2(-Delta Delta C(T)) Method. Methods 2001; 25: 402–408. [DOI] [PubMed] [Google Scholar]
- Pan H, O'Brien MJ, Wigglesworth K, Eppig JJ, Schultz RM.Transcript profiling during mouse oocyte development and the effect of gonadotropin priming and development in vitro. Dev Biol 2005; 286: 493–506. [DOI] [PubMed] [Google Scholar]
- Zeng F, Baldwin DA, Schultz RM.Transcript profiling during preimplantation mouse development. Dev Biol 2004; 272: 483–496. [DOI] [PubMed] [Google Scholar]
- Zheng P, Patel B, McMenamin M, Reddy SE, Paprocki AM, Schramm RD, Latham KE.The primate embryo gene expression resource: a novel resource to facilitate rapid analysis of gene expression patterns in non-human primate oocytes and preimplantation stage embryos. Biol Reprod 2004; 70: 1411–1418. [DOI] [PubMed] [Google Scholar]
- Bernales S, Papa FR, Walter P.Intracellular signaling by the unfolded protein response. Annu Rev Cell Dev Biol 2006; 22: 487–508. [DOI] [PubMed] [Google Scholar]
- Travers KJ, Patil CK, Wodicka L, Lockhart DJ, Weissman JS, Walter P.Functional and genomic analyses reveal an essential coordination between the unfolded protein response and ER-associated degradation. Cell 2000; 101: 249–258. [DOI] [PubMed] [Google Scholar]
- Liu CY, Kaufman RJ.The unfolded protein response. J Cell Sci 2003; 116: 1861–1862. [DOI] [PubMed] [Google Scholar]
- Gozuacik D, Bialik S, Raveh T, Mitou G, Shohat G, Sabanay H, Mizushima N, Yoshimori T, Kimchi A.DAP-kinase is a mediator of endoplasmic reticulum stress-induced caspase activation and autophagic cell death. Cell Death Differ 2008; 15: 1875–1886. [DOI] [PubMed] [Google Scholar]
- Exley GE, Tang C, McElhinny AS, Warner CM.Expression of caspase and BCL-2 apoptotic family members in mouse preimplantation embryos. Biol Reprod 1999; 61: 231–239. [DOI] [PubMed] [Google Scholar]
- Vandaele L, Goossens K, Peelman L, Van Soom A.mRNA expression of Bcl-2, Bax, caspase-3 and −7 cannot be used as a marker for apoptosis in bovine blastocysts. Anim Reprod Sci 2008; 106: 168–173. [DOI] [PubMed] [Google Scholar]
- Erzberger JP, Berger JM.Evolutionary relationships and structural mechanisms of AAA+ proteins. Annu Rev Biophys Biomol Struct 2006; 35: 93–114. [DOI] [PubMed] [Google Scholar]
- Sapienza C, Paquette J, Pannunzio P, Albrechtson S, Morgan K.The polar-lethal Ovum mutant gene maps to the distal portion of mouse chromosome 11. Genetics 1992; 132: 241–246. [DOI] [PMC free article] [PubMed] [Google Scholar]
Associated Data
This section collects any data citations, data availability statements, or supplementary materials included in this article.


