

Abstract
The earliest neural response to a mechanical perturbation, the short-latency stretch response (R1: 20–45 ms), is known to exhibit “automatic gain-scaling” whereby its magnitude is proportional to preperturbation muscle activity. Because gain-scaling likely reflects an intrinsic property of the motoneuron pool (via the size-recruitment principle), counteracting this property poses a fundamental challenge for the nervous system, which must ultimately counter the absolute change in load regardless of the initial muscle activity (i.e., show no gain-scaling). Here we explore the temporal evolution of gain-scaling in a simple behavioral task where subjects stabilize their arm against different background loads and randomly occurring torque perturbations. We quantified gain-scaling in four elbow muscles (brachioradialis, biceps long, triceps lateral, triceps long) over the entire sequence of muscle activity following perturbation onset—the short-latency response, long-latency response (R2: 50–75 ms; R3: 75–105 ms), early voluntary corrections (120–180 ms), and steady-state activity (750–1250 ms). In agreement with previous observations, we found that the short-latency response demonstrated substantial gain-scaling with a threefold increase in background load resulting in an approximately twofold increase in muscle activity for the same perturbation. Following the short-latency response, we found a rapid decrease in gain-scaling starting in the long-latency epoch (∼75-ms postperturbation) such that no significant gain-scaling was observed for the early voluntary corrections or steady-state activity. The rapid decrease in gain-scaling supports our recent suggestion that long-latency responses and voluntary control are inherently linked as part of an evolving sensorimotor control process through similar neural circuitry.
INTRODUCTION
A prominent and well-studied feature of the short-latency stretch response (R1: 20–45 ms postperturbation) is “automatic gain-scaling” whereby the same muscle-stretch will elicit larger responses when preperturbation muscle activity is increased (Bedingham and Tatton 1984; Marsden et al. 1976; Matthews 1986; Stein et al. 1995; Verrier 1985). This modulation is generally attributed to the intrinsic organization of the motoneuron pool (Capaday and Stein 1987; Houk et al. 1970; Kernell and Hultborn 1990; Marsden et al. 1976; Matthews 1986; Slot and Sinkjaer 1994) where motor units are recruited in order of their force-generating capability and resilience to fatigue (Cope and Clark 1991; Henneman 1957), a phenomenon termed the size-recruitment principle. Although gain-scaling may be a useful short-term strategy (Bedingham and Tatton 1984; Marsden et al. 1976; Matthews 1986), ultimately the steady-state response to an additional load must be independent of preperturbation muscle activity (i.e., not show gain-scaling) given the largely linear relationship between load and muscle activity for low to moderate loads (Hof 1984; Lawrence and Deluca 1983; Milner-Brown and Stein 1975). This poses a substantial challenge for the motor system, which must compensate for automatic gain-scaling to generate appropriate motor commands across different background load conditions.
Although many studies have established that short-latency responses demonstrate gain-scaling (Bedingham and Tatton 1984; Marsden et al. 1976; Matthews 1986; Stein et al. 1995; Verrier 1985) and that steady-state muscle activity does not (Hof 1984; Lawrence and Deluca 1983; Milner-Brown and Stein 1975), it is unknown how gain-scaling evolves between these two temporal extremes. Specifically, it is unclear how quickly gain-scaling is reduced and to what extent phasic muscle activity in the long-latency (R2: 50–75 ms; R3: 75–105 ms) and early voluntary (VOL: 120–180 ms) epochs demonstrate gain-scaling. Most previous studies did not address this issue because their experimental methods (i.e., brief servo-controlled displacements, electrical stimulation, “do-not-intervene” instructions) elicited robust short-latency responses but negligible muscle activity in the long-latency and/or voluntary epochs (Matthews 1986; Ruegg et al. 1990; Stein et al. 1995; Verrier 1985).
For example, Bedingham and Tatton (1984) demonstrated that gain-scaling is present for both the short- and long-latency (combined R2 and R3 epoch) response in a wrist flexor muscle but did not elicit substantial muscle activity past these epochs. The absence of later responses, likely due to a do-not-intervene instruction (Asatryan and Feldman 1965; Crago et al. 1976), fundamentally precluded a complete characterization of gain-scaling. In principle, the authors could have partially characterized the evolution of gain-scaling over the first 100 ms following perturbation onset, in the R1–R3 epochs, but no such quantitative analysis was provided, and confidently determining these changes from the presented figures is difficult. To our knowledge, only two studies have quantified the evolution of gain-scaling over a prolonged sequence of activity, focusing on the R1–R3 epochs in muscles spanning the ankle joint (Toft et al. 1989, 1991). Both of these studies used a do-not-intervene instruction coupled with a brief servo-controlled displacement and did not find gain-scaling for the short-latency response as commonly seen for upper-limb muscles, making it difficult to generalize from their results.
How might gain-scaling evolve over time and subsequent epochs of activity? One possibility is that gain-scaling is nearly constant across the early phasic response (<180 ms) and that compensation for the size-recruitment principle takes place over a much longer time scale as in previous studies of steady-state muscle activity (Hof 1984; Lawrence and Deluca 1983; Milner-Brown and Stein 1975). An alternative hypothesis is that the gain-scaling of the phasic epochs quickly approaches the steady-state response via systematic decreases in gain-scaling following the short-latency epoch. Such a systematic change across epochs would not be surprising given that many studies have shown significant functional and physiological distinctions between activity in the short- and long-latency epochs (Cole et al. 1984; Crago et al. 1976; Evarts and Vaughn 1978; Gielen et al. 1988; Gray et al. 2001; Hammond 1956; Kimura et al. 2006; Lewis et al. 2006; Rothwell et al. 1980; Tsuji and Rothwell 2002). For example, we have recently reported that the R2, R3, and VOL epochs increasingly incorporate an internal model of limb dynamics (Kurtzer et al. 2008) and are increasingly sensitive to spatial task constraints (Pruszynski et al. 2008a). Although these previous reports of sophistication do not a priori imply a reduction in gain-scaling, they lead to the natural prediction that gain-scaling will also be systematically and progressively modified over the R2, R3, and VOL epochs. Such a decrease in gain-scaling would provide another example of sophistication within the long-latency epoch and support our recent suggestion, based on optimal feedback control (Todorov 2004; Todorov and Jordan 2002), that long-latency responses and voluntary control are inherently linked as part of the same control process through similar neural circuitry (Scott 2004).
To test between these two possibilities, we utilized a straightforward task whereby subjects maintained their hand within a central target in the presence of various background loads and randomly occurring step-torque perturbations at the elbow. Importantly, this approach yielded a prolonged multi-phasic muscle response in all four elbow muscles of interest with clearly identifiable activity in the short-latency, long-latency, and early voluntary epochs. Because subjects were required to stabilize their limb at the same position both before and after the perturbation, we could also determine changes in steady-state muscle activity. Consistent with previous results, we found that the short-latency response, but not the steady-state activity, demonstrated significant gain-scaling and that the total limb displacement was reduced with larger background loads. With respect to the two competing hypotheses, we noted that gain-scaling was quickly reduced following perturbation onset, with most muscle samples showing decreases within the R3 epoch. In addition to our main experimental findings, we report two notable observations. First, gain-scaling in all epochs was greater for large perturbations than for small ones. Second, increases in intrinsic muscle stiffness associated with increased tonic muscle activity appeared to play a modest role in countering the applied mechanical perturbations, a result that was well reproduced by a realistic model of the muscle and limb.
METHODS
Subjects
A total of eight subjects participated in the experiments. All were neurologically unimpaired, gave informed consent according to a protocol approved by the Queen's University Research Ethics Board and were paid for their participation.
Apparatus
Subjects performed the tasks with a robotic exoskeleton (KINARM, BKIN Technologies, Kingston, ON, Canada) that supports the limb in the horizontal plane while permitting flexion and extension motions at the shoulder and elbow (Scott 1999). The device can monitor motion of the two joints and independently apply torque loads to the shoulder and/or elbow. Target lights and simulated hand feedback were presented to the subject in the plane of the task using an overhead projector and a semi-transparent mirror. Direct vision of the arm and hand was occluded throughout the experiment, and hand feedback was provided only between trials to ensure all corrective responses were guided by proprioception.
Protocol
Each trial began with subjects placing their index finger near the center (<0.3 cm) of a target which required shoulder and elbow angles of 45 and 90°, respectively (Fig. 1A). A background load (±1, ±2, ±3 Nm) was then slowly introduced (rise time = 500 ms) that required compensatory activation of the agonist muscles of interest, either the elbow flexors or extensors. After a random hold time of 1–4 s, a step-torque perturbation (an addition of 1.25 or 2.5 Nm in the same direction as the background load) stretched the preactivated agonist muscles (Fig. 1B). Subjects were instructed to avoid co-contracting or anticipating the perturbation but to return to the displayed spatial target (radius = 1 cm) quickly and accurately after perturbation onset. On completion of the trial, visual feedback indicated success or failure based on speed and accuracy criteria (return to the central target within 500 ms of perturbation onset and then remain inside the target for 1,000 ms). Before beginning the main experiment, subjects were presented with approximately five repeats of each condition to familiarize them with the apparatus and task constraints. Subjects performed 20 successful repeats in each condition for a total of 240 correct trials (3 background loads, 2 magnitudes × 2 muscle groups × 20 repeats) blocked by muscle group but randomized otherwise. Breaks of ∼3 min were enforced every 60 correct trials, although subjects could rest at anytime. The entire experimental session lasted ∼2 h.
FIG. 1.

Experimental apparatus and methods. A: subjects were presented with a visual target (radius = 1 cm) at the tip of their index finger when their shoulder and elbow angles were 45 and 90°, respectively. B: the experimental conditions included 3 levels of background load/torque (1–3 Nm) coupled with 2 perturbation magnitudes (1.25, 2.5 Nm) for both the elbow flexors and extensors. Elbow flexor and extensor trials were collected in separate blocks.
Muscle recording, filtering, and normalization
Detailed electromyographic (EMG) procedures have been reported previously (Pruszynski et al. 2008a). In the present experiments, surface recordings were obtained from four muscles acting to flex and extend the elbow joint: biceps long (Bi), brachioradialis (Br), triceps long (TLo), triceps lateral (TLa). One sample of brachioradialis (subject 1) and biceps long (subject 4) were excluded from analysis because of poor signal quality, leaving a total of 30 muscle samples. EMG data were filtered (2-pass, 6th-order Butterworth, 20–250 Hz), rectified and then normalized such that a value of one represents the mean agonist activation while countering a 2-Nm background load.
Taking into account many previous reports (Bonnet 1983; Crago et al. 1976; Kurtzer et al. 2008; Lee and Tatton 1975; Mortimer et al. 1981; Nakazawa et al. 1997; Pruszynski et al. 2008a; Rothwell et al. 1980), we defined three distinct epochs of rapid postperturbation muscle activity in temporal order of their appearance: response 1 (R1, 20–45 ms), classically referred to as the short-latency or spinal stretch reflex (Pierrot-Deseilligny and Burke 2005); response 2 (R2, 50–75 ms), often referred to as the long-latency reflex (Hammond 1954; Matthews 1986); response 3 (R3, 75–105 ms), sometimes referred to as long-latency reflex or triggered response (Crago et al. 1976; Rothwell et al. 1980). Within our nomenclature, activity within the R1 window is alternately referred to as the short-latency response and the combination of the R2 and R3 epochs is alternately called the long-latency response. As previously discussed (Pruszynski et al. 2008a), we specifically chose to discard the term “reflex” in favor of labeling events in their temporal order to avoid the substantial philosophical and historical legacy of the term (Prochazka et al. 2000). Furthermore, the timing of our epochs closely mirror M1–M3 as proposed by Lee and Tatton (1975), and our choice of R1–R3 is largely to avoid confusion with the common abbreviation for primary motor cortex (M1). In addition to the rapid response epochs, we included time epochs between −100–0, 120–180, and 750–1,250 ms, which were defined as baseline (PRE), early voluntary (VOL), and steady state (POS), respectively.
Calculating gain-scaling and correcting for joint kinematics
Gain-scaling is defined as the change in evoked muscle activity for the same perturbation magnitude but different background loads normalized by the change in preperturbation muscle activity across these background loads (Eq. 1). In the present manuscript, we calculated the gain-scaling across the small (1 Nm) and large (3 Nm) background loads for both small (1.25 Nm) and large (2.5 Nm) perturbations
 |
(1) |
Where A(t) is the muscle activity at a particular time (or the average activity over an epoch as in the denominator) and the subscripts refer to the background load level (bg) and perturbation magnitude (m), either large or small. Note that gain-scaling of 1 signifies no multiplicative effect of background load on the evoked perturbation activity, that is, no gain-scaling.
In the present experiment, we applied step-torque perturbations as opposed to servo-controlling a particular kinematic trajectory. Step-torque perturbations have the advantage of better approximating the types of perturbations that motor responses tend to counter; that is, perturbations that are influenced by their action rather than servo-trajectories which will occur regardless. However, using step-torque perturbations required us to account for any systematic changes in joint-velocity that may occur as a function of background load such as those caused by increases in muscle stiffness (Cannon and Zahalak 1982; Franklin and Milner 2003; Gomi and Osu 1998; Hunter et al. 1982) or active changes in muscle activity vis-à-vis gain-scaling. Systematic changes in kinematics are problematic because the phasic responses are strongly related to joint velocity (Jaeger et al. 1982; Lenz et al. 1983; Tatton and Bawa 1979) and could lead us to incorrectly attribute changes in muscle activity to decreases in gain-scaling rather than decreases in joint-velocity. We estimated the sensitivity to joint-velocity by performing the experiment at two perturbation magnitudes and relating the change in evoked activity to the change in observed position kinematics (Eq. 2). Note that the second term, describing the change in position kinematics [Δθ(t)], is effectively a metric of joint-velocity over the time window (t) and that velocity sensitivity was calculated at the medium background load (2 Nm)
 |
(2) |
This sensitivity was then used to correct the observed gain-scaling based on the observed difference in motion as a function of background load (Eqs. 3 and 4)
 |
(3) |
 |
(4) |
Gain-scaling was calculated for each predefined epoch (R1, R2, R3, VOL, POS). In addition, we calculated gain-scaling as a function of time by applying a 10-ms moving window to the dataset.
Modeling intrinsic muscle stiffness
To better understand the influence of intrinsic muscle properties on our observations, we modeled a single-link manipulator with an actuator based on a realistic muscle model (Brown and Loeb 1999, 2000a, b; Brown et al. 1999; Li and Todorov 2004). A detailed description of the model is provided in the supplementary material,1 but it is important to mention that all the parameters in the model were independent of our experimental dataset. The resulting model was then exposed to a single-joint version of the experimental conditions previously described. Accordingly, a background torque was applied to the manipulator, and the manipulator was programmed to counter this external load near the center of its workspace (90°). Once the manipulator had countered the load and stopped moving, the compensatory activation required to maintain this position was fixed and an additional step-torque perturbation was applied. The resulting kinematics were calculated and compared with our empirical results. Because the activation was kept constant while the perturbation was applied, we could directly attribute changes in kinematics to changes in the intrinsic muscle properties via preperturbation muscle activation.
We also used the model to estimate intrinsic muscle stiffness [k = Δτ/Δθ = (τf − τo)/(θf − θo)], which is the spring-like tendency of muscle to resist changes in position. Because the model does not include a simple term that represents stiffness, we estimated this value by modeling a commonly used empirical technique (Mussa-Ivaldi et al. 1985). In short, the manipulator was programmed to counter a set load (τo) near the center of its workspace (θo = 90°). We then displaced the manipulator to a new position (θf = 89°; Δθ = 1°) while keeping muscle activation constant and noted the new level of joint-torque generation (τf) after the manipulator reaches a steady-state (joint-velocity returns to 0) and restorative torque production saturates.
RESULTS
Behavior and kinematics
For each muscle group (elbow flexors and extensors), we introduced one of three background loads that required increased muscle activity and then applied one of two perturbation magnitudes that stretched the excited muscle group (Fig. 1). Subjects were required to return to the central target within 500 ms of perturbation onset and then remain inside the target for 1,000 ms. They learned this task quickly and had little difficulty meeting the imposed speed and accuracy constraints, performing with an average success rate of 90% (SD 3).
Both perturbation magnitude and background loads altered the resulting kinematics (Fig. 2). These changes were quantified with respect to the elbow joint as our elbow torque perturbations resulted in predominately (though not exclusively) elbow motion (Fig. 3). Not surprisingly, increases in perturbation magnitude led to increased maximal joint-displacement [3-way ANOVA, background load vs. perturbation magnitude vs. perturbation direction, main-effect of perturbation magnitude, F(1,91) = 354, P < 10−6] whereby a twofold increase in perturbation magnitude resulted in a 2.4 times increase in maximal elbow displacement (small/1.25 Nm: 5.1 ± 1.1°; large/2.5 Nm: 12.2 ± 2.2°; means ± SD); we noted no significant difference in maximal excursion as a function of perturbation direction [F(1,91) = 2.2, P = 0.14]. In contrast to the increased motion induced by larger perturbation magnitudes, increases in background load significantly reduced maximal elbow excursion [F(2,91) = 33.1, P < 10−6] with a threefold increase in background load resulting in a 35% decrease in joint-displacement. Interestingly, while changes in perturbation magnitude [small/1.25 Nm: 178 ± 22 ms; large/2.5 Nm: 184 ± 15 ms; F(1,91) = 2.4, P = 0.12] and direction [F(1,91) = 0.95, P = 0.33] did not significantly alter the timing of maximal excursion, increases in background load resulted in significantly earlier reversal times [1 Nm BG: 193 ± 16 ms; 3 Nm BG: 170 ± 22 ms; F(2,91) = 11.1, P < 10−3].
FIG. 2.

Spatial hand kinematics with different background and perturbation conditions from an exemplar subject. A: hand kinematics resulting from the imposed background loads (light gray = 1 Nm; dark gray = 2 Nm; black = 3 Nm) and perturbations (solid = 1.25 Nm; dashed = 2.5 Nm). The circle in each panel indicates the spatial target that subjects were required to achieve quickly and accurately following perturbation onset.
FIG. 3.

Temporal joint kinematics from an exemplar subject. A: elbow angle following an elbow extension perturbation (which stretches the elbow flexor muscles). The horizontal axis represents time relative to perturbation onset and the vertical axis shows the change in elbow angle relative to the initial configuration (shoulder = 45°, elbow = 90°). Solid (1.25 Nm) and dashed (2.5 Nm) lines denote perturbation magnitude and line shade denotes background load (light gray = 1 Nm, dark gray = 2 Nm, black = 3 Nm). B: resultant shoulder angle following an elbow extension perturbation. C: elbow velocity trajectory following an elbow extension perturbation. D: shoulder velocity trajectory following an elbow extension perturbation. E–H: same format as A–D except for an elbow flexion perturbation (which stretches the elbow extensor muscles).
In addition to large-scale changes in kinematic behavior as described in the preceding text, we were interested in quantifying how changes in background load modified intrinsic muscle properties such as stiffness. To quantify the effect of background load, we calculated the elbow displacement 50 ms after perturbation onset (Fig. 4A), a time at which changes in kinematics could be attributed almost exclusively to changes in intrinsic muscle stiffness because of the delay between EMG activity and the generation of muscle force (Brown et al. 1999). As expected, even at 50-ms postperturbation, there was a highly significant effect of perturbation magnitude for elbow flexion perturbations across the three background loads (paired t-test, t47 = 49.4, P < 10−6) with an approximately twofold increase in joint displacement for a twofold increase in perturbation magnitude (small/1.25 Nm: −1.3 ± 0.2°; large/2.5 Nm: −2.7 ± 0.4°). In contrast to the large kinematic changes associated with perturbation magnitude, initial changes in joint-displacement were very modestly affected by a threefold increase in background load. We noted a very small though significant decrease in induced motion between the small and large background loads (small perturbation: t7 = −5.5, P < 10−3, mean difference = −0.06 ± 0.03°; large perturbation: t7 = −4.2, P < 0.01, 0.12 ± 0.08°). This small effect of background load can be clearly seen in Fig. 4A where the near-zero slopes of the plotted lines indicate that the change in joint-angle is only modestly effected by changes in background load. In fact, the effect of background load did not reach 5% of the total elbow displacement until 55 ± 10 and 54 ± 8 ms after perturbation onset for small and large perturbation, respectively. This modest effect was consistent with ROC analysis, which quantifies the probability that an ideal observer can distinguish between background loads based on only the elbow kinematics (Pruszynski et al. 2008a); ROC values of 0 or 1 indicate perfect discrimination and 0.5 indicates discrimination at chance level. Such an analysis reveals a clear effect of background load immediately after perturbation onset that reaches significance (ROC <0.25 for 5 ms) at 52 ± 11 and 44 ± 17 ms for the small and large perturbations, respectively.
FIG. 4.

Analysis of empirical and model kinematics. A: this panel presents the resultant change in joint-angle 50 ms following the mechanical perturbation for each level of background load. Each thin line shows the elbow angle of an individual subject for the elbow flexion perturbation and the thick-dashed line is from the single-joint of the model. Note that the model data falls within the range of the collected data and shows a similar trend whereby larger background loads result in only modest decreases in joint-displacement as witnessed by the small positive slope of each line. B: same format as Fig. 3A but data are taken from the model (see supplemental material).
Model of intrinsic muscle properties
Our empirical results indicate that increases in intrinsic muscle properties, as determined by how such changes influence the resultant joint-kinematics, are modest over the range of background loads used in the present experiment (Fig. 4A). Initially surprised by the small effect, we compared our empirical kinematics to a mathematical model of the limb and muscle. The model shows striking similarity to the empirical results for the earliest portion (<50 ms) of the joint kinematics (compare Figs. 3A and 4B) even though all free parameters in the model are set based on previous literature (see supplemental material). Specifically, the resultant joint-displacement predicted by the model at 50 ms for all background load and perturbation conditions falls well within the observed range of observed elbow-kinematics (Fig. 4A). As with the empirical results, the effect of background load was present immediately after perturbation onset but resulted in modest changes in initial kinematics, remaining under 5% until 53 and 55 ms for the small and large perturbations, respectively. We also used the model to estimate the restorative forces attributable to intrinsic muscle stiffness at each background load. By displacing the model arm by a known amount (1°) while keeping muscle activation constant, we could determine the intrinsic restoring forces attributable to changes in position (i.e., muscle stiffness). For both small and large displacements, our model predicts that intrinsic stiffness is modulated with initial muscle activation reaching steady-state values of 1.0, 1.7, and 2.3 Nm/rad for the 1, 2, and 3 Nm initial background loads studied empirically.
Muscle activity
Our primary interest was to investigate the evolution of gain-scaling over the entire multi-phasic sequence of activity that follows muscle stretch. Every background load and perturbation magnitude evoked a clear sequence of phasic activity the timing of which was similar across subjects, muscles and conditions. The timing of the bursts largely corresponded to the predefined epochs although we rarely found a clear separation between the R2 and R3 epochs. In Fig. 5, the effect of background load on preperturbation activity is visible for an exemplar muscle sample; with increased background load, the absolute magnitude of muscle activity was increased over the entire response. We were particularly interested in determining whether there was any gain-scaling of the phasic responses, that is, an increase in the magnitude of rapid responses over and above the constant shift introduced by the background load. This is revealed in Fig. 5, B and D, where the offset due to the initial background load is removed. Consistent with many previous results, the R1 response is clearly larger for the same perturbation when the background load is increased. However, the difference as a function of background load is systematically reduced in later epochs even though the overall magnitude of muscle activity is substantially larger. Although each muscle sample displayed a unique pattern of activity, the general trend with respect to gain-scaling was qualitatively similar for all collected muscles as well as the grand mean (Fig. 6).
FIG. 5.

Exemplar patterns of muscle activity with different background and perturbation loads. A: electromyographic (EMG) activity from an exemplar muscle sample (triceps lateral, subject 2) for the small perturbation (1.25 Nm) but different background loads (light gray = 1 Nm, black = 3 Nm). Note that the middle (2 Nm) background load condition is omitted for clarity. The horizontal axis denotes time and is aligned to perturbation onset (black vertical line). The dashed vertical lines designate intervals for the R1–R3 epochs and are based on average responses across muscle samples (see methods). The vertical axis represents normalized EMG activity where a value of 1 represents EMG activity used to counter a 2 Nm background load. B: same data and format as in A except that the offset associated with background load activation has been removed. C: same format as A except for the large perturbation (2.5 Nm). D: same format and data as C with offset removed.
FIG. 6.

Group patterns of muscle activity. The layout is the same as in Fig. 5, B and D. Left: the data for small (1 Nm) and large (3 Nm) background loads and the small perturbation (1.25 Nm). Right: the large perturbation (2.5 Nm). Bottom: the grand mean across all muscle samples.
The increase in steady-state muscle activity for the same change in mechanical load was independent of the initial background load [2-way ANOVA, background load vs. perturbation magnitude, main-effect of background load, F(2,176) = 0.27, P = 0.76] and highly sensitive to the perturbation magnitude [main-effect of perturbation magnitude, F(1,176) = 54.6, P < 10−6]. Hence, steady-state muscle activity did not exhibit any gain-scaling. This result is shown in Fig. 7A, which plots the change in muscle activity for the small and large perturbation torque at each of the three initial background loads used in this experiment. Note that the increase in muscle activity for the applied perturbations is the same regardless of the initial background load.
FIG. 7.
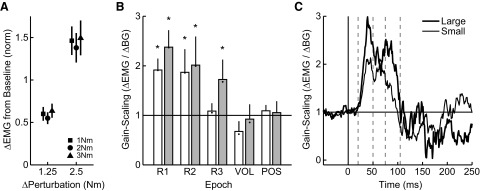
Analysis of gain-scaling across epochs and in time. A: linearity of steady-state muscle activity (750–1,250 ms postperturbation) associated with increased loads. The horizontal axis represents the change in load between background and perturbation and the vertical axis represents the resulting change in steady-state EMG. The 3 symbols denote the 3 initial background loads (square = 1 Nm; circle = 2 Nm; triangle = 3 Nm) and error bars represent SE across muscle samples. B: population data showing the sensitivity of muscle responses in each epoch to the background load. Results are shown for both the small (1.25 Nm, solid) and large (2.5 Nm, dashed) perturbations. The bars represent gain-scaling after correction for reduced joint motion (see methods). Dots within each bar show uncorrected gain-scaling. Symbols (asterisk) above each bar indicate significant gain-scaling (t-test, P < 0.05, gain-scaling >1). C: sensitivity of muscle responses to background load with respect to time. The horizontal axis represents time relative to perturbation onset and the vertical axis represents gain-scaling at each point in time. Thin and thick lines denote the small and large perturbations, respectively. Note that gain-scaling at each instant in time (1 ms) is smoothed with a 10-ms sliding window.
We quantified the progression of gain-scaling over the sequence of activity that makes up the early corrective response both within predefined epochs of muscle activity (Fig. 7B) and with respect to time without a priori assumptions about underlying epochs (Fig. 7C). For our principle analysis, we combined results across muscle samples because visual and statistical inspection of individual muscle groups did not reveal substantial differences with respect to gain-scaling [3-way ANOVA, gain-scaling vs. perturbation magnitude vs. muscle group, main effect of muscle group, F(3,236) = 0.42, P = 0.74].
Figure 7B shows the corrected gain-scaling (see methods) for each epoch of activity under both small and large perturbation magnitudes. The short-latency response is approximately doubled for a unit increase in the background load and the same mechanical perturbation (gain-scaling = ΔR1small/ΔBG = 1.91; ΔR1large/ΔBG = 2.38). As in the R1 epoch, gain-scaling was statistically present in many later epochs (t-test, gain-scaling >1, P < 0.05), although there is a notable effect of epoch (R1–R3, VOL) on gain-scaling [ANOVA, F(3,236) = 9.6, P < 10−3] whereby later responses exhibit systematically decreased gain-scaling for both perturbation magnitudes (slope of linear regression between epoch timing and gain-scaling <0; paired t-test, small: t29 = −6.0, P < 10−3; large: t29 = −5.7, P < 10−3). A more direct examination of gain-scaling revealed that the R2 epoch was not significantly less gain-scaled than the R1 epoch for either the small or large perturbation (paired t-test, P > 0.1) with just over half of the collected samples decreasing their gain-scaling when compared with gain-scaling in R1 (small: 53%; large: 53%). In contrast, the majority of muscle samples demonstrated reduced gain-scaling in the R3 (small: 80%; large: 70%), VOL (97%; 80%) and POS (93%, 100%) epochs. Indeed, the VOL response exhibited no statistically significant gain modulation (ΔVOLsmall/ΔBG = 0.68; ΔVOLlarge/ΔBG = 0.92) for either perturbation magnitude (gain-scaling = 1, small: t29 = −0.58, P = 0.56; large: P = 0.61).
Although gain-scaling was progressively reduced for both small and large perturbation magnitudes, there was a significant effect of perturbation magnitude on gain-scaling whereby the large perturbation resulted in greater gain-scaling in each epoch [ANOVA, F(1,238) = 4.9, P = 0.03]. A within-epoch comparison showed a similar trend [paired t-test, gain-scaling (small) < gain-scaling (large); R1: t29 = −2.2, P = 0.02; R2: t29 = −1.3, P = 0.1; R3: t29 = −3.2, P < 0.001].
The binned results were not qualitatively changed by modestly altering either the onset or duration of the epochs. For example, when bins were narrowed by 10 ms to limit potential overlap between epochs (R1: 25–40; R2: 55–70; R3: 80–100; VOL: 125–175), we continued to find no significant decrease in gain-scaling for the R2 epoch when compared with the R1 epoch for either the large or small perturbation (P > 0.1). The majority of muscle samples still showed reduced gain-scaling in the R3 (small: 83% large: 73%) and VOL (small: 97% large: 83%) epochs and the VOL epoch exhibited no significant gain-scaling for either perturbation magnitude (small: P = 0.56; large: P = 0.64). We continued to find a trend toward greater gain-scaling with larger perturbation magnitude (R1: P = 0.04; R2: P = 0.2; R3: P = 0.003).
Similar results are found when gain-scaling is calculated in time without a priori assumptions about epochs (Fig. 7C). This view of gain-scaling revealed two phases of increased activity that correspond roughly with the phasic bursts of muscle activity associated with the R1 and R2 epochs (Fig. 6, grand mean). The first phase of activity is modestly larger that the second phase and this is quickly followed by a dramatic drop in gain-scaling that occurs ∼75 ms postperturbation, corresponding to the boundary between the R2 and R3 epoch.
In the present experiment, we applied step-torque perturbations rather than enforcing a particular kinematic trajectory. Because we did not explicitly control joint motion, it is possible that the observed difference in background load scaling results from smaller kinematic displacements caused by increases in muscle stiffness. However, the changes in initial kinematics were small and would, on average, account for <5% of the reduction in background load scaling in each of the epochs of interest. This is shown in Fig. 7B where the bars and variability present the gain-scaling after we corrected by the reduced displacement and the small filled dots within each bar present the uncorrected gain-scaling. Note that no correction was carried out on the steady-state epoch and that time-series data in Fig. 7C are corrected at every sample.
Although our principle analysis collapsed across muscle groups, each individual muscle group demonstrated similar trends. Most importantly, we found that later responses exhibited systematically decreased gain-scaling for each muscle group and both perturbation magnitudes as measured by calculating the slope of the linear regression between epoch timing and gain-scaling in that epoch (Fig. 8A). This finding was statistically significant (paired t-test, slope of regression <0, P < 0.05) for seven of eight experimental conditions (4 muscle groups × 2 perturbation magnitudes) with the other condition (biceps, large perturbation) showing the same trend (P = 0.09). In fact, all the muscle groups showed significant gain-scaling in the R1 epoch for both perturbation magnitudes (t-test, gain-scaling >0, P < 0.05), and none of the muscle groups showed significant gain-scaling in the VOL epoch (t-test, gain-scaling ≠ 0, P > 0.1). We also determined the extent to which individual muscle groups showed a decrease in gain-scaling from the R1 to the R3 epoch. Again, each muscle group demonstrated a trend that is consistent with our principle findings whereby gain-scaling in the R3 epoch is reduced from that seen during R1, though these reductions were statistically significant (paired t-test, P < 0.05) in only two conditions (Fig. 8, B and C).
FIG. 8.

Gain-scaling trends for each muscle group. A: summary of regression slopes relating gain-scaling and the timing of subsequent epochs of phasic muscle activity (R1–VOL). Gain-scaling was calculated within each epoch and the regression was done with respect to the mean time for that epoch [R1 = 0.0325 s (32.5 ms); R2 = 0.0625 s; R3 = 0.09 s; VOL = 0.15 s]. Each bar represents the regression slope (mean ± SE) for the indicated muscle sample. □, the small perturbation (1.25 Nm) condition;  , the large perturbation (2.5 Nm). *, significant (t-test, P < 0.05, slope of regression <0) negative relationship between subsequent epochs of activity and gain-scaling. B: direct comparison of gain-scaling (mean ± SE) in R1 and R3 for each muscle group in the small perturbation condition. □, gain-scaling in the R1 epoch; , gain-scaling in the R3 epoch. Note that all muscle samples demonstrate a trend toward decreased gain-scaling in the R3 epoch though only 2 of the conditions (*) demonstrate significant decreases (paired t-test, P < 0.05, gain-scaling in R3 < gain-scaling in R1). C: same format as B except for the large perturbation condition.
DISCUSSION
The principle goal of this study was to elucidate the temporal evolution of automatic gain-scaling in human elbow muscles during postural maintenance of the upper limb. Unlike most previous work that focused on the short-latency response (Cathers et al. 2004; Matthews 1986; Ruegg et al. 1990; Stein et al. 1995; Toft et al. 1989; Verrier 1985), we specifically designed our experiment to robustly elicit a prolonged sequence of muscle activity by requiring subjects to maintain their hand at a central spatial target in the presence of unpredictable torque perturbations applied at the elbow (Kurtzer et al. 2008; Pruszynski et al. 2008a). In agreement with many previous studies of human upper-limb muscles, we found that the short-latency response (R1: 20–45 ms) is robustly scaled by preperturbation muscle activity (Bedingham and Tatton 1984; Cathers et al. 2004; Marsden et al. 1976; Matthews 1986; Stein et al. 1995) and that steady-state muscle activity (750–1,250 ms) is not (Hof 1984; Lawrence and Deluca 1983; Milner-Brown and Stein 1975). Our results are also consistent with previous reports of gain-scaling within the long-latency epoch for a wrist flexor muscle (Bedingham and Tatton 1984).
We extend previous work by characterizing gain-scaling over the entire sequence of muscle activity that follows a mechanical perturbation. Our results demonstrate a rapid decrease in gain-scaling that begins ∼75 ms after perturbation onset and quickly approaches the steady-state response (Fig. 7, B and C). Gain-scaling in the R3 (75–105 ms) epoch was significantly smaller than for the short-latency response and was statistically absent in both the early voluntary (VOL: 120–180 ms) steady-state epochs. This pattern was apparent for both small and large perturbation magnitudes and when analyzing each individual muscle group, suggesting that rapid reductions in gain-scaling may be a common feature of perturbation responses of elbow muscles.
Modest influence of intrinsic muscle stiffness
Previous authors have suggested that activity-dependent changes in intrinsic muscle stiffness play an important role in stabilizing the upper-limb by providing substantial restorative forces at zero latency (Franklin and Milner 2003; Gomi and Osu 1998; Mussa-Ivaldi et al. 1985). However, our present experimental results suggest a modest effect of activity-dependent muscle stiffness on initial elbow motion, whereby a 300% increase in background load and a concomitant increase in muscle activity yielded only a ∼5% reduction in joint motion 50 ms after perturbation onset (Fig. 4A). These empirical findings were well matched by a realistic model of the muscle and limb. The model suggests that although stiffness is systematically increased with initial activation, the overall contribution is small for the range of activations used in the present study. Our estimates of stiffness, ranging from 1.2 to 2.3 Nm/rad, is within the range of previous empirical reports that measured intrinsic stiffness of isolated muscle preparations, particularly those estimated made at low initial forces/activations with stretch magnitudes that surpass the influence of short-range stiffness mechanisms (Hoffer and Andreassen 1981; Huyghues-Despointes et al. 2003; Nichols and Houk 1976; Rack and Westbury 1974).
A reasonable criticism of the present study is that our background loads and muscle activations were not large enough to cause appreciable changes in muscle stiffness and that at large initial activations, the role of intrinsic muscle stiffness would increase substantially (Hoffer and Andreassen 1981; Joyce and Rack 1969). However, the loads we used represented a substantial portion of what subjects could perform under our nonisometric conditions over the duration of the experiment making further empirical increases difficult (Bedingham and Tatton 1984; Franklin and Milner 2003). Furthermore, when the model was used to simulate larger initial activations (approaching MVC), estimates of intrinsic stiffness increased relatively linearly with muscle activation (Hoffer and Andreassen 1981; Joyce and Rack 1969) and saturated at ∼10 Nm/rad. Perhaps more importantly, even the highest activation levels resulted in modest reductions of joint-displacement. Another possibility is that the limbs' inertial properties dominate initially, but that stiffness plays a substantial role at greater displacements. Again, this is difficult to address empirically as greater displacements occur at times where evoked muscle activity is present, making it difficult to separate changes in intrinsic stiffness from changes in muscle activity. In our simulations, we clamped active changes in muscle activity and found that the effect of stiffness clearly increased but was still limited (<15% reduction in joint-kinematics) even at 250 ms postperturbation when displacements are substantially larger (∼30 and 60° for small and large perturbations, respectively) than the peak excursions found experimentally (∼5 and 12°, compare Figs. 3A and 4B).
While our present work suggests a modest contribution of intrinsic stiffness at low to moderate background load levels for the upper -limb, additional work is needed to fully explore this important issue. Furthermore, it should be stressed that our empirical results demonstrate that the total effect of gain-scaling, which includes both intrinsic muscle properties and scaling of muscle activity, does result in substantial behavioral consequences including reductions in peak displacement and reversal time for a given perturbation magnitude (Figs. 2 and 3).
Physiological implications of decreases in gain-scaling
It is well-established that short-latency responses and H-reflexes are often modulated by preperturbation muscle activity and thus demonstrate gain-scaling (Bedingham and Tatton 1984; Marsden et al. 1976; Matthews 1986; Stein et al. 1995; Verrier 1985). This modulation likely reflects the intrinsic organization of the motoneuron pool whereby motor units are recruited in strict order of their force-generating capability and resilience to fatigue (Cope and Clark 1991; Henneman 1957), a phenomenon termed the size-recruitment principle. Indeed previous work has convincingly described (Marsden et al. 1976; Matthews 1986) and formalized (Capaday and Stein 1987; Houk et al. 1970; Kernell and Hultborn 1990; Slot and Sinkjaer 1994) how the size-recruitment principle specifically leads to gain-scaling, and empirical studies have demonstrated that the size-recruitment principle likely applies to motor-unit recruitment at all latencies (short, long and voluntary) following a mechanical perturbation (Calancie and Bawa 1985a,b).
In summary, many previous studies suggest that gain-scaling is caused by the size-recruitment principle, which is likely an unavoidable mapping between inputs to the motoneuron pool (i.e., motor commands) and the resulting muscle activity (Bawa 2002; Cope and Sokoloff 1999; Kandel et al. 2000). Therefore it is important to reconcile this well-explored constraint with our observation that gain-scaling is reduced in the long-latency epoch and that early voluntary and steady-state muscle activity is not gain-scaled; how can gain-scaling be reduced/eliminated over time given the size-recruitment principle? Ultimately, the elimination of gain-scaling within this constraint requires that synaptic input to the motoneuron pool from a fixed perturbation be reduced in proportion to the background load. Such a reduction could be caused by a number of different mechanisms such as a reduction in the efficacy of descending motor commands at the level of the motoneuron pool. For example, the “tonic-vibration reflex” (Matthews 1966) is generally absent in spinalized cats but can be facilitated to levels observed in a decerebrate cat by intravenous injection of DOPA, presumably by activating a descending system of mono-aminergic fibers (Goodwin et al. 1973). Similar low-level circuitry could modulate the excitability of rapid-response epochs (Houk 1979) by removing facilitation in proportion to background load and time following perturbation. A second possible mechanism is a reduction of descending motor commands in proportion to background load. Of particular interest is activity in primary motor cortex (M1) because it likely provides an important contribution to descending motor commands in both the long-latency (Matthews 1991) and voluntary epochs; to our knowledge, no one has reported the effect of background load on perturbation responses in M1.
It should be emphasized that not all recruitment rules (for example, random selection of motor units) would lead to gain-scaling. An alternative and more speculative explanation for a reduction in gain-scaling is that later motor commands can increasingly circumvent the size-recruitment principle. Several studies have observed apparent violations of the size-recruitment principle during voluntary contractions under a variety of experimental conditions and for several muscles of the upper and lower limb (Hodson-Tole and Wakeling 2008). For example, studies have shown that size recruitment likely occurs over smaller muscle compartments rather then the entire muscle for the human upper limb during isometric contractions (Van Zuylen et al. 1988) and cat lower limb during gait (Hoffer et al. 1987). Such an organization would not eliminate gain-scaling because each compartment locally obeys the size-recruitment principle, but it could lead to substantial changes in gain-scaling if descending motor commands selectively recruited different muscle compartments. Others have reported violations of size recruitment without finding such discrete compartments, suggesting instead that motor units are activated as a function of their mechanical action rather than as a function of their size (Herrmann and Flanders 1998). In this scenario, there is no need for descending motor commands to compensate for background load activation as their influence is not subject to the size-recruitment principle. Of course, the simplification gained from not having to compensate for size recruitment may well be overshadowed by the complexity of selecting specific motor units. Again, it may be fruitful to explore the effect of background load on M1 perturbation responses as an organization that avoids the size-recruitment principle predicts no gain-scaling in M1 responses.
Intermediate gain-scaling in the long-latency epoch
An important result in the present study is a rapid decrease in gain-scaling such that gain-scaling in the long-latency epoch, specifically R3, is smaller than the short-latency response but greater than the voluntary response (SL > LL > VOL). This progressive decrease may provide an important clue about the neural substrates of muscle activity within the long-latency epoch for the upper limb. One possibility is that activity within each epoch reflects largely independent neural circuits each with progressively greater correction for the size-recruitment principle (see preceding text). In contrast, the decrease in gain-scaling may occur because long-latency activity is composed of two components that overlap in time (Crago et al. 1976; Rothwell et al. 1980), a transient component with no correction for gain-scaling and an increasingly dominant component the contribution of which completely corrects for gain-scaling. The net result of this arrangement as measured via surface electromyography would be a progressive reduction in gain-scaling. In fact, while it is well established that the long-latency response for the upper limb includes a cortical contribution from M1 (Matthews 1991), it has also been shown that phasic-activity within the long-latency epoch is present in decerebrate cats (Ghez and Shinoda 1978) and in both decerebrate (Miller and Brooks 1981) and spinalized monkeys (Tracey et al. 1980). Taken together with these previous observations, our present results are consistent with the notion that long-latency activity is composed of at least two separate circuits which overlap in time (Pruszynski et al. 2008b). We speculate that, if isolated, the spinal component would demonstrate gain-scaling similar to the short-latency response (R1) whereas the supra-spinal contribution would show no gain-scaling, similar to the early voluntary response (VOL).
In summary, the size-recruitment principle is a rational rule for recruiting motor units insofar as it tends to minimize fatigue and neuromuscular noise (Kandel et al. 2000; Mendell 2005), two important considerations for motor control. It also introduces substantial complexity for motor commands when trying to generate similar changes in force at various levels of background/tonic load. In that sense, the size-recruitment principle is another complexity of the neuromuscular periphery, like muscle-mechanics and limb-dynamics, which must be taken into account by descending motor commands (Kurtzer and Scott 2007). What is striking about the present results is that correction for the size-recruitment principle begins very rapidly following a mechanical perturbation, within 75 ms of perturbation onset. This similarity between long-latency responses and voluntary corrections in the human upper limb is consistent with our recent suggestions that activity within these epochs is inherently linked as part of the same control process through similar neural circuitry (Scott 2004).
GRANTS
This work was supported by the National Science and Engineering Research Council (NSERC) of Canada and the Canadian Institute of Health Research (CIHR). J. A. Pruszynski, I. Kurtzer, and S. H. Scott each received salary awards from CIHR; T. P. Lillicrap received a salary award from the Ontario Graduate Scholarship program.
DISCLOSURES
S. H. Scott is associated with BKIN Technologies, which commercializes the KINARM robot.
Supplementary Material
Acknowledgments
We thank K. Moore for technical and logistical support.
Footnotes
The online version of this article contains supplemental data.
REFERENCES
- Asatryan and Feldman 1965.Asatryan DG, Feldman AG. Functional tuning of the nervous system with control of moement or maintenance of a steady posture. I. Mechanographic analysis of the work of the joint on execution of a postural task. Biophysics 10: 925–935, 1965. [Google Scholar]
- Bawa 2002.Bawa P Neural control of motor output: can training change it? Exercise Sport Sci Rev 30: 59–63, 2002. [DOI] [PubMed] [Google Scholar]
- Bedingham and Tatton 1984.Bedingham W, Tatton WG. Dependence of EMG responses evoked by imposed wrist displacements on pre-existing activity in the stretched muscles. Can J Neurol Sci 11: 272–280, 1984. [DOI] [PubMed] [Google Scholar]
- Bonnet 1983.Bonnet M Anticipatory changes of long-latency stretch responses during preparation for directional hand movements. Brain Res 280: 51–62, 1983. [DOI] [PubMed] [Google Scholar]
- Brown et al. 1999.Brown IE, Cheng EJ, Loeb GE. Measured and modeled properties of mammalian skeletal muscle. II. The effects of stimulus frequency on force-length and force-velocity relationships. J Muscle Res Cell Motil 20: 627–643, 1999. [DOI] [PubMed] [Google Scholar]
- Brown and Loeb 1999.Brown IE, Loeb GE. Measured and modeled properties of mammalian skeletal muscle. I. The effects of post-activation potentiation on the time course and velocity dependencies of force production. J Muscle Res Cell Motil 20: 443–456, 1999. [DOI] [PubMed] [Google Scholar]
- Brown and Loeb 2000a.Brown IE, Loeb GE. Measured and modeled properties of mammalian skeletal muscle. III. the effects of stimulus frequency on stretch-induced force enhancement and shortening-induced force depression. J Muscle Res Cell Motil 21: 21–31, 2000a. [DOI] [PubMed] [Google Scholar]
- Brown and Loeb 2000b.Brown IE, Loeb GE. Measured and modeled properties of mammalian skeletal muscle. IV. Dynamics of activation and deactivation. J Muscle Res Cell Motil 21: 33–47, 2000b. [DOI] [PubMed] [Google Scholar]
- Calancie and Bawa 1985a.Calancie B, Bawa P. Firing patterns of human flexor carpi radialis motor units during the stretch reflex. J Neurophysiol 53: 1179–1193, 1985a. [DOI] [PubMed] [Google Scholar]
- Calancie and Bawa 1985b.Calancie B, Bawa P. Voluntary and reflexive recruitment of flexor carpi radialis motor units in Humans. J Neurophysiol 53: 1194–1200, 1985b. [DOI] [PubMed] [Google Scholar]
- Cannon and Zahalak 1982.Cannon SC, Zahalak GI. The mechanical-behavior of active human skeletal-muscle in small oscillations. J Biomechan 15: 111–121, 1982. [DOI] [PubMed] [Google Scholar]
- Capaday and Stein 1987.Capaday C, Stein RB. A method for simulating the reflex output of a motoneuron pool. J Neurosci Methods 21: 91–104, 1987. [DOI] [PubMed] [Google Scholar]
- Cathers et al. 2004.Cathers I, O'Dwyer N, Neilson P. Variation of magnitude and timing of wrist flexor stretch reflex across the full range of voluntary activation. Exp Brain Res 157: 324–335, 2004. [DOI] [PubMed] [Google Scholar]
- Cole et al. 1984.Cole KJ, Gracco VL, Abbs JH. Autogenic and nonautogenic sensorimotor actions in the control of multiarticulate hand movements. Exp Brain Res 56: 582–585, 1984. [DOI] [PubMed] [Google Scholar]
- Cope and Clark 1991.Cope TC, Clark BD. Motor-unit recruitment in the decerebrate cat—several unit properties are equally good predictors of order. J Neurophysiol 66: 1127–1138, 1991. [DOI] [PubMed] [Google Scholar]
- Cope and Sokoloff 1999.Cope TC, Sokoloff AJ. Orderly recruitment among motoneurons supplying different muscles. J Physiol 93: 81–85, 1999. [DOI] [PubMed] [Google Scholar]
- Crago et al. 1976.Crago PE, Houk JC, Hasan Z. Regulatory actions of human stretch reflex. J Neurophysiol 39: 925–935, 1976. [DOI] [PubMed] [Google Scholar]
- Evarts and Vaughn 1978.Evarts EV, Vaughn WJ. Intended arm movements in response to externally produced arm displacements in man. In: Cerebral Motor Control in Man: Long Loop Mechanisms, edited by Desmedt JE. Brussels: Krager, 1978, p. 178–192.
- Franklin and Milner 2003.Franklin DW, Milner TE. Adaptive control of stiffness to stabilize hand position with large loads. Exp Brain Res 152: 211–220, 2003. [DOI] [PubMed] [Google Scholar]
- Ghez and Shinoda 1978.Ghez C, Shinoda Y. Spinal mechanisms of functional stretch reflex. Exp Brain Res 32: 55–68, 1978. [DOI] [PubMed] [Google Scholar]
- Gielen et al. 1988.Gielen CCAM, Ramaekers L, Vanzuylen EJ. Long-latency stretch reflexes as coordinated functional-responses in man. J Physiol 407: 275–292, 1988. [DOI] [PMC free article] [PubMed] [Google Scholar]
- Gomi and Osu 1998.Gomi H, Osu R. Task-dependent viscoelasticity of human multijoint arm and its spatial characteristics for interaction with environments. J Neurosci 18: 8965–8978, 1998. [DOI] [PMC free article] [PubMed] [Google Scholar]
- Goodwin et al. 1973.Goodwin GM, Mcgrath GJ, Matthews PB. Tonic vibration reflex seen in acute spinal cat after treatment with Dopa. Brain Res 49: 463–466, 1973. [DOI] [PubMed] [Google Scholar]
- Grey et al. 2001.Grey MJ, Ladouceur M, Andersen JB, Nielsen JB, Sinkjaer T. Group II muscle afferents probably contribute to the medium latency soleus stretch reflex during walking in humans. J Physiol 534: 925–933, 2001. [DOI] [PMC free article] [PubMed] [Google Scholar]
- Hammond 1954.Hammond PH Involuntary activity in biceps following the sudden application of velocity to the abducted forearm. J Physiol 127: 23P–25P, 1954. [PMC free article] [PubMed] [Google Scholar]
- Hammond 1956.Hammond PH The influence of prior instruction to the subject on an apparently involuntary neuro-muscular response. J Physiol 132: 17P–18P, 1956. [PubMed] [Google Scholar]
- Henneman 1957.Henneman E Relation between size of neurons and their susceptibility to discharge. Science 126: 1345–1347, 1957. [DOI] [PubMed] [Google Scholar]
- Herrmann and Flanders 1998.Herrmann U, Flanders M. Directional tuning of single motor units. J Neurosci 18: 8402–8416, 1998. [DOI] [PMC free article] [PubMed] [Google Scholar]
- Hodson-Tole and Wakeling 2008.Hodson-Tole EF, Wakeling JM. Motor unit recruitment for dynamic tasks: current understanding and future directions. J Comp Physiol B Biol Sci 179: 57–66, 2008. [DOI] [PubMed] [Google Scholar]
- Hof 1984.Hof AL EMG and muscle force—an introduction. Human Move Sci 3: 119–153, 1984. [Google Scholar]
- Hoffer and Andreassen 1981.Hoffer JA, Andreassen S. Regulation of soleus muscle-stiffness in pre-mammillary cats—intrinsic and reflex components. J Neurophysiol 45: 267–285, 1981. [DOI] [PubMed] [Google Scholar]
- Hoffer et al. 1987.Hoffer JA, Loeb GE, Sugano N, Marks WB, Odonovan MJ, Pratt CA. Cat hindlimb motoneurons during locomotion. III. Functional segregation in sartorius. J Neurophysiol 57: 554–562, 1987. [DOI] [PubMed] [Google Scholar]
- Houk 1979.Houk JC Regulation of stiffness by skeleto-motor reflexes. Annu Rev Physiol 41: 99–114, 1979. [DOI] [PubMed] [Google Scholar]
- Houk et al. 1970.Houk JC, Singer JJ, Goldman MR. Evaluation of length and force feedback to soleus muscles of decerebrate cats. J Neurophysiol 33: 784–811, 1970. [DOI] [PubMed] [Google Scholar]
- Hunter et al. 1982.Hunter IW, Weiss PL, Kearney RE. Human ankle stiffness dynamics—effect of muscle fatigue. Can J Neurol Sci 9: 362, 1982. [Google Scholar]
- Huyghues-Despointes et al. 2003.Huyghues-Despointes CM, Cope TC, Nichols TR. Intrinsic properties and reflex compensation in reinnervated triceps surae muscles of the cat: effect of activation level. J Neurophysiol 90: 1537–1546, 2003. [DOI] [PubMed] [Google Scholar]
- Jaeger et al. 1982.Jaeger RJ, Gottlieb GL, Agarwal GC. Myoelectric responses at flexors and extensors of human wrist to step torque perturbations. J Neurophysiol 48: 388–402, 1982. [DOI] [PubMed] [Google Scholar]
- Joyce and Rack 1969.Joyce GC, Rack PMH. Isotonic lengthening and shortening movements of cat soleus muscle. J Physiol 204: 475-and, 1969. [DOI] [PMC free article] [PubMed] [Google Scholar]
- Kandel et al. 2000.Kandel ER, Schwartz JH, Jessel TM. Principles of Neural Science. New York: McGraw-Hill, 2000.
- Kernell and Hultborn 1990.Kernell D, Hultborn H. Synaptic effects on recruitment gain—a mechanism of importance for the Input output relations of motoneuron pools. Brain Res 507: 176–179, 1990. [DOI] [PubMed] [Google Scholar]
- Kimura et al. 2006.Kimura T, Haggard P, Gomi H. Transcranial magnetic stimulation over sensorimotor cortex disrupts anticipatory reflex gain modulation for skilled action. J Neurosci 26: 9272–9281, 2006. [DOI] [PMC free article] [PubMed] [Google Scholar]
- Kurtzer and Scott 2007.Kurtzer I, Scott SH. A multi-level approach to understanding upper limb function. Prog Brain Res 165: 347–362, 2007. [DOI] [PubMed] [Google Scholar]
- Kurtzer et al. 2008.Kurtzer IL, Pruszynski JA, Scott SH. Long-latency reflexes of the human arm reflect an internal model of limb dynamics. Curr Biol 18: 449–453, 2008. [DOI] [PubMed] [Google Scholar]
- Lawrence and Deluca 1983.Lawrence JH, Deluca CJ. Myoelectric signal versus force relationship in different human muscles. J Appl Physiol 54: 1653–1659, 1983. [DOI] [PubMed] [Google Scholar]
- Lee and Tatton 1975.Lee RG, Tatton WG. Motor responses to sudden limb displacements in primates with specific CNS lesions and in human patients with motor system disorders. Can J Neurol Sci 2: 285–293, 1975. [DOI] [PubMed] [Google Scholar]
- Lenz et al. 1983.Lenz FA, Tatton WG, Tasker RR. Electro-myographic response to displacement of different forelimb joints in the squirrel monkey. J Neurosci 3: 783–794, 1983. [DOI] [PMC free article] [PubMed] [Google Scholar]
- Lewis et al. 2006.Lewis GN, MacKinnon CD, Perreault EJ. The effect of task instruction on the excitability of spinal and supraspinal reflex pathways projecting to the biceps muscle. Exp Brain Res 174: 413–425, 2006. [DOI] [PMC free article] [PubMed] [Google Scholar]
- Li and Todorov 2004.Li W, Todorov E. Iterative linear quadratic regulator design for nonlinear biological movement systems. Intl Conf Inform Control Automat Robotics 1: 222–229, 2004. [Google Scholar]
- Marsden et al. 1976.Marsden CD, Merton PA, Morton HB. Servo action in human thumb. J Physiol 257: 1–44, 1976. [DOI] [PMC free article] [PubMed] [Google Scholar]
- Matthews 1966.Matthews PB Reflex activation of soleus muscle of decerebrate cat by vibration. Nature 209: 204-and, 1966. [DOI] [PubMed] [Google Scholar]
- Matthews 1986.Matthews PBC Observations on the automatic compensation of reflex gain on varying the preexisting level of motor discharge in man. J Physiol 374: 73–90, 1986. [DOI] [PMC free article] [PubMed] [Google Scholar]
- Matthews 1991.Matthews PBC The human stretch reflex and the motor cortex. Trends Neurosci 14: 87–91, 1991. [DOI] [PubMed] [Google Scholar]
- Mendell 2005.Mendell LM The size principle: a rule describing the recruitment of motoneurons. J Neurophysiol 93: 3024–3026, 2005. [DOI] [PubMed] [Google Scholar]
- Miller and Brooks 1981.Miller AD, Brooks VB. Late muscular responses to arm perturbations persist during supraspinal dysfunctions in monkeys. Exp Brain Res 41: 146–158, 1981. [DOI] [PubMed] [Google Scholar]
- Milner-Brown and Stein 1975.Milner-Brown HS, Stein RB. Relation between surface electromyogram and muscular force. J Physiol 246: 549–569, 1975. [DOI] [PMC free article] [PubMed] [Google Scholar]
- Mortimer et al. 1981.Mortimer JA, Webster DD, Dukich TG. Changes in short and long latency stretch responses during the transition from posture to movement. Brain Res 229: 337–351, 1981. [DOI] [PubMed] [Google Scholar]
- Mussa-Ivaldi et al. 1985.Mussa-Ivaldi FA, Hogan N, Bizzi E. Neural, mechanical, and geometric factors subserving arm posture in humans. J Neurosci 5: 2732–2743, 1985. [DOI] [PMC free article] [PubMed] [Google Scholar]
- Nakazawa et al. 1997.Nakazawa K, Yamamoto S, Yano H. Short-and long-latency reflex responses during different motor tasks in elbow flexor muscles. Exp Brain Res 116: 20–28, 1997. [DOI] [PubMed] [Google Scholar]
- Nichols and Houk 1976.Nichols TR, Houk JC. Improvement in linearity and regulation of stiffness that results from actions of stretch reflex. J Neurophysiol 39: 119–142, 1976. [DOI] [PubMed] [Google Scholar]
- Pierrot-Deseilligny and Burke 2005.Pierrot-Deseilligny E, Burke D. The Circuitry of the Spinal Cord: Its Role in Motor Control and Movement Disorders. Cambridge, UK: Cambridge Univ. Press, 2005.
- Prochazka et al. 2000.Prochazka A, Clarac F, Loeb GE, Rothwell JC, Wolpaw JR. What do reflex and voluntary mean? Modern views on an ancient debate. Exp Brain Res 130: 417–432, 2000. [DOI] [PubMed] [Google Scholar]
- Pruszynski et al. 2008a.Pruszynski JA, Kurtzer I, Scott SH. Rapid motor responses are appropriately tuned to the metrics of a visuospatial task. J Neurophysiol 100: 224–238, 2008a. [DOI] [PubMed] [Google Scholar]
- Pruszynski et al. 2008b.Pruszynski JA, Kurtzer I, Scott SH. Task-dependency of rapid motor responses reflects the sum of fixed and flexible processes. Soc Neurosci Abstr 379.17, 2008b.
- Rack and Westbury 1974.Rack PM, Westbury DR. The short range stiffness of active mammalian muscle and its effect on mechanical properties. J Physiol 240: 331–350, 1974. [DOI] [PMC free article] [PubMed] [Google Scholar]
- Rothwell et al. 1980.Rothwell JC, Traub MM, Marsden CD. Influence of voluntary intent on the human long-latency stretch reflex. Nature 286: 496–498, 1980. [DOI] [PubMed] [Google Scholar]
- Ruegg et al. 1990.Ruegg DG, Krauer R, Drews H. Superposition of H-reflexes on steady contractions in man. J Physiol 427: 1–18, 1990. [DOI] [PMC free article] [PubMed] [Google Scholar]
- Scott 1999.Scott SH Apparatus for measuring and perturbing shoulder and elbow joint positions and torques during reaching. J Neurosci Methods 89: 119–127, 1999. [DOI] [PubMed] [Google Scholar]
- Scott 2004.Scott SH Optimal feedback control and the neural basis of volitional motor control. Nat Rev Neurosci 5: 532–546, 2004. [DOI] [PubMed] [Google Scholar]
- Slot and Sinkjaer 1994.Slot PJ, Sinkjaer T. Simulations of the alpha-motoneuron pool electromyogram reflex at different preactivation levels in man. Biol Cybern 70: 351–358, 1994. [DOI] [PubMed] [Google Scholar]
- Stein et al. 1995.Stein RB, Hunter IW, Lafontaine SR, Jones LA. Analysis of short-latency reflexes in human elbow flexor muscles. J Neurophysiol 73: 1900–1911, 1995. [DOI] [PubMed] [Google Scholar]
- Tatton and Bawa 1979.Tatton WG, Bawa P. Input-output properties of motor unit responses in muscles stretched by imposed displacements of the monkey wrist. Exp Brain Res 37: 439–457, 1979. [DOI] [PubMed] [Google Scholar]
- Todorov 2004.Todorov E Optimality principles in sensorimotor control. Nat Neurosci 7: 907–915, 2004. [DOI] [PMC free article] [PubMed] [Google Scholar]
- Todorov and Jordan 2002.Todorov E, Jordan MI. Optimal feedback control as a theory of motor coordination. Nat Neurosci 5: 1226–1235, 2002. [DOI] [PubMed] [Google Scholar]
- Toft et al. 1989.Toft E, Sinkjaer T, Andreassen S. Mechanical and electromyographic responses to stretch of the human anterior tibial muscle at different levels of contraction. Exp Brain Res 74: 213–219, 1989. [DOI] [PubMed] [Google Scholar]
- Toft et al. 1991.Toft E, Sinkjaer T, Andreassen S, Larsen K. Mechanical and electromyographic responses to stretch of the human ankle extensors. J Neurophysiol 65: 1402–1410, 1991. [DOI] [PubMed] [Google Scholar]
- Tracey et al. 1980.Tracey DJ, Walmsley B, Brinkman J. Long-loop reflexes can be obtained in spinal monkeys. Neurosci Lett 18: 59–65, 1980. [DOI] [PubMed] [Google Scholar]
- Tsuji and Rothwell 2002.Tsuji T, Rothwell JC. Long lasting effects of rTMS and associated peripheral sensory input on MEPs, SEPs and transcortical reflex excitability in humans. J Physiol 540: 367–376, 2002. [DOI] [PMC free article] [PubMed] [Google Scholar]
- Van Zuylen et al. 1988.Van Zuylen EJ, Gielen CCAM, van der Gon JJD. Coordination and inhomogeneous activation of human arm muscles during isometric torques. J Neurophysiol 60: 1523–1548, 1988. [DOI] [PubMed] [Google Scholar]
- Verrier 1985.Verrier MC Alterations in H reflex magnitude by variations in baseline EMG excitability. Electroencephalogr Clin Neurophysiol 60: 492–499, 1985. [DOI] [PubMed] [Google Scholar]
Associated Data
This section collects any data citations, data availability statements, or supplementary materials included in this article.