Abstract
The use of chronic intracortical multielectrode arrays has become increasingly prevalent in neurophysiological experiments. However, it is not obvious whether neuronal signals obtained over multiple recording sessions come from the same or different neurons. Here, we develop a criterion to assess single-unit stability by measuring the similarity of 1) average spike waveforms and 2) interspike interval histograms (ISIHs). Neuronal activity was recorded from four Utah arrays implanted in primary motor and premotor cortices in three rhesus macaque monkeys during 10 recording sessions over a 15- to 17-day period. A unit was defined as stable through a given day if the stability criterion was satisfied on all recordings leading up to that day. We found that 57% of the original units were stable through 7 days, 43% were stable through 10 days, and 39% were stable through 15 days. Moreover, stable units were more likely to remain stable in subsequent recording sessions (i.e., 89% of the neurons that were stable through four sessions remained stable on the fifth). Using both waveform and ISIH data instead of just waveforms improved performance by reducing the number of false positives. We also demonstrate that this method can be used to track neurons across days, even during adaptation to a visuomotor rotation. Identifying a stable subset of neurons should allow the study of long-term learning effects across days and has practical implications for pooling of behavioral data across days and for increasing the effectiveness of brain–machine interfaces.
INTRODUCTION
In recent years, the use of chronically implanted intracortical multielectrodes has become increasingly prevalent in neurophysiological experiments due to their ability to simultaneously record from large populations of neurons over long periods of time. In fact, the Utah intracortical electrode array has been shown to produce reliable neuronal recordings for days, weeks, and even years after implantation in cat sensory cortex (Rousche and Normann 1998) and nonhuman primate primary motor cortex (Suner et al. 2005). However, it is unclear to what degree the extracellular signals recorded during multiple sessions across days originate from the same neurons. We are thus underusing the capability of multielectrode arrays, since any analysis is limited to the length of a single recording session, which lasts on the order of minutes to hours instead of days to weeks. The ability to reliably track neuronal signals across days would allow for the study of the long-term effects of learning and adaptation and would have practical implications for pooling data across recording sessions and for the development of brain–machine interface technology.
A few groups have reported stability data for chronically implanted intracortical electrodes, usually by looking at the similarity of spike waveform shapes. Rousche and Norman (1998) reported that the same neuron could be tracked by visual inspection over at most a few weeks, but they did not quantify this result. Suner and colleagues (2005) tracked measures of distance between waveform clusters and interspike interval distributions over a period of 91 days and argued that the Utah array can deliver reliable recordings over time. However, they did not attempt to determine whether the same neurons were present each day. Nicolelis and colleagues (2003) recorded neurons from primate cortex using a microwire array and reported that 80% of the original units were stable through 2 days and 55% were stable through 8 days. They measured stability by examining the similarity of unsorted waveform clusters in principal component (PC) space over time. Jackson and Fetz (2007) recorded neurons from primate cortex using a movable microwire array and, using the correlation coefficient between the averages of unsorted waveforms to measure similarity, reported that 50% of the original units were stable through 1 wk and 10% were stable through 2 wk.
One deficit in these studies is that they do not include an estimate of the false-positive rate—i.e., the probability that signals from two different neurons would be classified as stable. Stable units are assumed to have similar waveforms, but different neurons can also have similar waveforms. Tolias and colleagues (2007) addressed this with data collected from primate cortex using a tetrode. They defined a metric measuring the distance between two waveform clusters and then used the distances between clusters before and after moving the tetrode to define a “null distribution” describing the similarity of waveforms from different units. They set a threshold that specified a 5% false-positive rate and found that 41–61% of neuronal units were stable through 2 days and 8–36% were stable through 1 wk. However, it is unclear how to apply this method to an immobile, chronically implanted multielectrode array.
Another issue arises because recordings from one channel often contain activity from more than one neuron. Movable electrodes can be optimally positioned to isolate single units, but that is not possible with chronically implanted multielectrode arrays. Therefore to track neuronal stability on these arrays, one must either 1) use only those channels with almost no contamination from noise or other neuronal signals (and thereby discard potentially meaningful data) or 2) spike-sort the neuronal signals to reduce this contamination. Here, we chose to track the stability of spike-sorted neuronal units, so that if one unit was unstable it would not affect the analysis of another unit recorded on the same electrode. We used the correlation coefficient to measure the similarity of the averages of sorted waveforms from two different sessions. However, spike-sorting inflates the correlation between average waveforms, so the 0.95 threshold used by Jackson and Fetz (2007) to assess stability is not appropriate. Therefore we wanted to use information other than just the waveform to assess stability. One option is to use behavioral tuning as a marker of stability (Liu et al. 2006). However, we do not want to assume stable tuning relationships a priori. Instead, we will define stability using other metrics, so that in the future we can examine the stability of behavioral tuning without the danger of circular reasoning (Kriegeskorte et al. 2009). Instead, we used the interspike interval histogram (ISIH) of the sorted unit as a marker of stability.
Although previous studies have reported interspike interval data from chronically implanted multielectrode arrays (Liu et al. 2006; Suner et al. 2005), no study has used the shape of the ISIH in a quantified way to help determine stability. The motivation for using ISIH data comes from the observation that different types of neurons in the sensorimotor cortex seem to possess characteristic ISIHs (Chen and Fetz 2005). However, the ISIH is not always stable. For example, Funke and colleagues (Worgotter et al. 1998) showed that neurons in the visual cortex alter their receptive fields (and therefore their ISIHs) as a function of the behavioral state as measured by electroencephalogram. We sought to minimize instability of the ISIH by using a constant, overtrained behavioral task for each monkey.
In this study, we describe a method for tracking the stability of sorted neuronal units recorded on a Utah array across time by making use of both spike waveform and ISIH data. Based on results from other intracortical electrodes, we expect that a significant subset of recorded neurons will remain stable over a 1- to 2-wk period; moreover, we hypothesize that using both ISIH and waveform data will provide a more reliable assessment of stability than using waveform data alone. We show that 39% of sorted units are stable through 15 days and that using the ISIHs in addition to waveform data minimizes the chance of false positives. In addition, we consider a visuomotor adaptation task and show that our method for identifying stable neurons is still viable in the context of a learning experiment.
METHODS
Neural recordings
For the stability analysis, three rhesus macaques (Macaca mulatta) were implanted with a total of four Utah 100-microelectrode arrays (Blackrock Microsystems, Salt Lake City, UT) in primary motor (MI), ventral premotor (PMv), or dorsal premotor (PMd) cortices contralateral to the arm used for the task. Monkey VL had arrays in MI and PMv and monkeys BO and RJ each had arrays in PMd. All electrodes of these arrays were 1 mm in length and the procedure for implanting the Utah array has been described elsewhere (Maynard et al. 1997, 1999; Rousche and Normann 1992). During a recording session, signals from ≤96 electrodes were amplified (gain of 5,000), band-pass filtered between 0.3 Hz and 7.5 kHz, and recorded digitally (14-bit) at 30 kHz per channel using a Cerebus acquisition system (Blackrock Microsystems). Only waveforms (duration, 1.6 ms; 48 sample time points per waveform) that crossed a voltage threshold were stored for off-line sorting. This voltage threshold was set just outside the noise band, so that all potential spike waveforms were recorded for later off-line spike sorting. For the learning experiment, a fourth monkey (MK) was implanted in MI with a Utah array with 1.5-mm electrodes coated with an activated iridium oxide film.
For the four arrays used in the stability analysis, neuronal activity was recorded on 10 separate daily sessions over a 15- to 17-day period. We will use the term “session” to refer to one day's neural recordings and “data set” to refer to a series of 10 sessions recorded from one cortical area of one monkey. The range of training session lengths was 8 to 160 min (mean ± SD: 64 ± 47 min). The specific day each session was recorded on (relative to the first day) is listed on the x-axes of Fig. 3. The day of the first recording session occurred 3 wk, 9 mo, and 10 mo after implantation for monkeys VL, BO, and RJ, respectively. For the adaptation experiment, six sessions were recorded over 8 days 11 mo after implantation for monkey MK.
Behavioral task
Each monkey was operantly conditioned to perform a behavioral task requiring planar reaching movements using a two-link robotic exoskeleton (KINARM, BKIN Technologies, Kingston, Ontario, Canada). For the stability analysis, each monkey was overtrained on a given behavioral task prior to data collection and neither the task nor task parameters varied during the data collection period. However, the behavioral task did vary across monkeys. Monkey VL performed a standard center-out task (Georgopoulos et al. 1986; Hatsopoulos et al. 1998) with an instructed delay, which was a time period varying from 1 to 1.5 s, in which the peripheral target was visible but the monkey was not yet allowed to move to that target. Monkey BO performed a modified center-out task with a memory component and monkey RJ performed a random target-pursuit task in which the monkey reached for sequences of randomly positioned targets (only one target was displayed at a time) (Hatsopoulos et al. 2007). We also evaluated the stability of neural recordings during a learning experiment in which monkey MK performed a center-out with an instructed-delay reaching task requiring visuomotor adaptation. The learning experiment consisted of three phases. During the pre- and postadaptation phases, the monkey made at least five unperturbed movements (where cursor position matched the hand position) to each of the peripheral targets, whose location was selected pseudorandomly. During the adaptation phase, all targets were presented at 90° and the cursor position was rotated 22.5° counterclockwise (relative to the center target) from the actual hand position. Therefore during adaptation the subject had to direct hand movements toward 67.5° to make the cursor move toward the 90° target. All of the surgical and behavioral procedures were approved by the University of Chicago Institutional Animal Care and Use Committee and conform to the principles outlined in the Guide for the Care and Use of Laboratory Animals.
Spike sorting
Spike waveform data from the first day were sorted in Off line Sorter (Plexon, Dallas, TX) using a user-defined template, which was a waveform shape to which all waveforms were compared. All spike waveforms whose mean squared error from this template fell below a user-defined threshold were classified as belonging to that unit. The templates and template thresholds were chosen on a unit-by-unit basis to produce well-differentiated clusters in PC space. For each unit, spike waveform data from all subsequent days were sorted using the same template and threshold. This was done to eliminate day-to-day variability of manual spike-sorting as a potential source of instability (Wood et al. 2004). We should make clear that the method used for spike-sorting the neural data from the first session is independent of the decision to assign stability—the method described in the following text simply compares properties of two groups of previously sorted spike waveforms and timestamps. Other sorting methods could be used, as long as they can sort multiple sessions in an analogous manner. On the first session of the stability data sets, monkey VL had 76 sorted single units in MI and 85 units in PMv, whereas monkeys BO and RJ had 53 units and 32 units respectively in PMd. On the first session of the visuomotor adaptation data set, monkey MK had 84 units in MI.
Data analysis
We wanted to compare the similarity of the spike waveforms and the interspike interval histograms (ISIH) between sorted units classified on consecutive days. We defined two scores, one measuring spike waveform similarity and one measuring ISIH similarity. The waveform similarity score (W) was defined as the Pearson's correlation coefficient computed between the two averages of the sorted waveforms. This measure of stability is similar to the one used by Jackson and Fetz (2007) who used the maximum time-shifted correlation coefficient between the averages of unsorted waveforms.
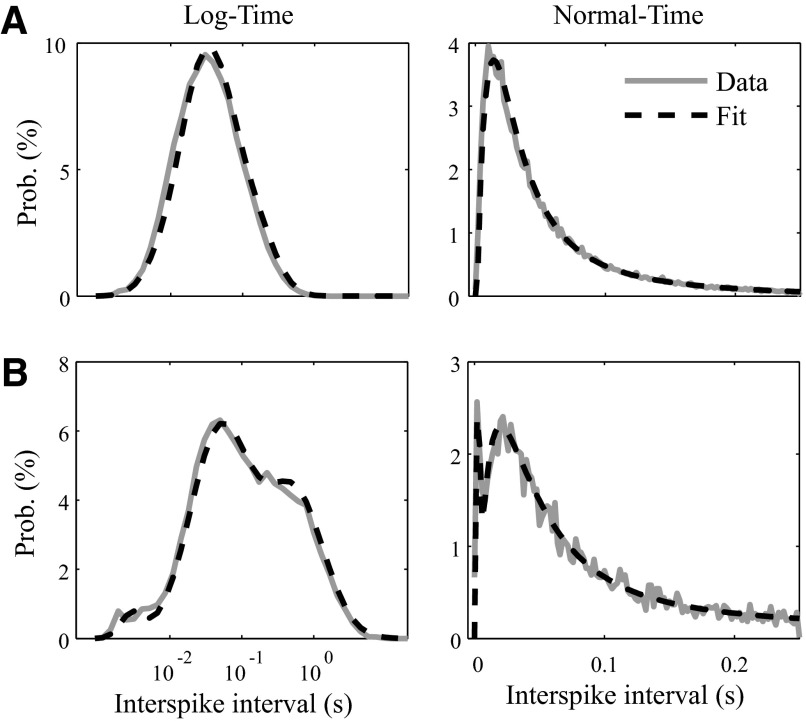
Before comparing ISIHs, we fit each ISIH to a mixture of three log-normal distributions using an expectation–maximization (EM) algorithm (Hastie et al. 2001). Each ISIH was thus described by eight parameters: the mean and SDs of the three components and the mixing probabilities of the first two components (the last is not needed because the probabilities sum to 1). The three components can be thought of as comprising a fast (centered on 2.5 ms), medium (30 ms), and slow component (1 s). The initial conditions supplied to the EM algorithm were −6.0 ± 0.5, −3.5 ± 0.9, and 0.0 ± 0.0 ln (seconds) for the fast, medium, and slow log-normal distributions, respectively. The mixing probabilities were initialized to 0.02 and 0.6. Examples of ISIHs and their respective EM fits are shown in Fig. 1.
FIG. 1.
A mixture of 3 log-normals fits the interspike interval histograms (ISIHs) of 2 example neurons (A, top; B, bottom). Raw ISIHs are displayed in gray, whereas the fit traces are displayed in black, dashed lines. ISIHs are displayed both in normal time (right) and log-time (left). Note that the ISIH in B requires a mixture of 3 log-normals for a good fit, whereas the ISIH in A seems to be well fit with a single log-normal distribution (the expectation–maximization algorithm set the mixing probabilities of the other 2 log-normals close to zero).
We computed the normalized Euclidean distance between pairs of eight-dimensional parameter vectors. The normalizing factor was the variance of a collection of parameter difference values computed from sample data. The sample data came from the longest (2 h, 40 min) recording session, collected from monkey VL. Ideally, one would use a separate data set from each monkey, but the other monkeys' data sets were not long enough to provide an estimate of natural variability. The sample data were evenly partitioned into fifths: the first fifth was sorted manually and its templates and thresholds were used to sort the remaining portions. Differences were taken between the parameters of all possible pairs of partitions (difference between the first and second, first and third, second and third, etc.), giving 10 values for each of the 130 neurons. We then computed the variances across all these parameter difference values. We assumed all units were stable across the five partitions (this assumption was validated by visually tracking the spikes for the duration of the experiment) and that changes in parameter values reflect the natural variability of neuronal units over time. The mean (μ) and SDs (σ) of the eight parameter differences are given in Table 1.
TABLE 1.
Means (μ) and SD (σ) of the differences of the interspike interval histogram parameter values of the sample data set
| ΔM1, ×10−2 | ΔM2, ×10−2 | ΔM3, ×10−2 | ΔS1, ×10−2 | ΔS2, ×10−2 | ΔS3, ×10−2 | ΔP1, ×10−2 | ΔP2, ×10−2 | |
|---|---|---|---|---|---|---|---|---|
| μ | −0.015 | −0.04 | −2.0 | −1.8 | −0.057 | −1.7 | −0.032 | −0.39 |
| σ | 21.0 | 7.9 | 15.0 | 9.5 | 4.4 | 5.7 | 0.42 | 5.1 |
M designates the mean of the three log-normal distributions, S their SDs, and P the first two mixing probabilities used to fit the interspike interval histograms (ISIHs). The values for σ are used in computing the ISIH similarity score (see methods).
The difference in parameters between similar ISIHs should be close to zero; thus a low ISIH score value indicates stability, whereas a high value indicates instability. The ISIH score (I) comparing the similarity between two sets of ISIH parameters, A and B, is defined as
 |
(1) |
where the values for σ are taken from Table 1.
Another choice for comparing ISIH distributions would have been the Kolmogorov–Smirnov (K-S) test that was used by Suner and colleagues (2005). However, since the underlying statistic looks at the maximum deviation between cumulative probability distributions, the K-S test is not very sensitive to the tails of the distributions. Consequently, it has a hard time distinguishing between a bursting neuron with a bimodal ISIH (Fig. 1B) from a tonic neuron with a unimodal ISIH (Fig. 1A). Our mixture model was designed to capture this difference.
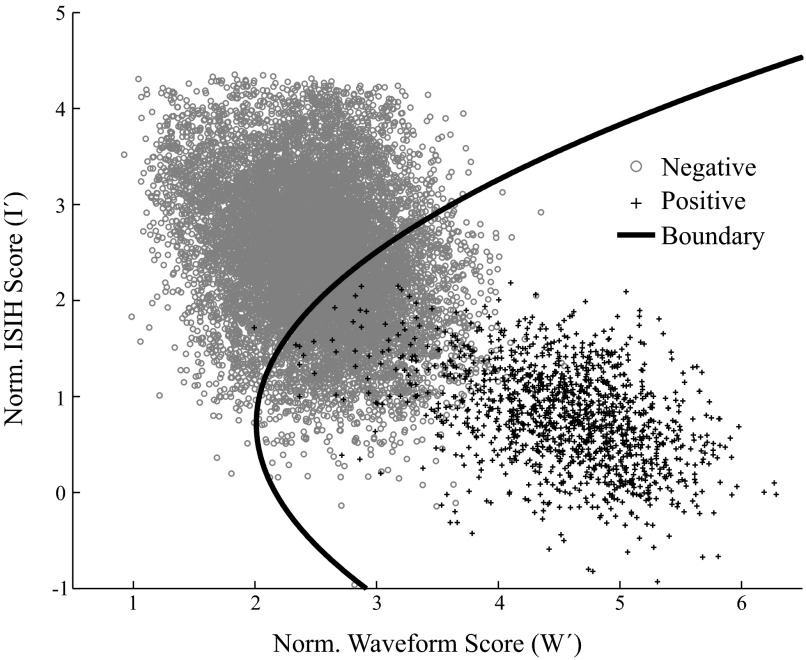
We defined a stability criterion that was a function of the spike waveform and ISIH scores. We approached this as a classification problem between a set of “true positives,” assumed to be stable, and a set of “true negatives,” assumed to be unstable. The true-positive scores came from comparisons between the five partitions of the sample data set used to normalize the ISIH score. The true-negative scores came from comparisons of data recorded on different electrodes: we took each neuronal unit in turn and sorted the waveforms present on all other electrodes using that unit's template and template threshold. Because each electrode on the Utah array is separated by ≥400 μm, we assumed that even adjacent electrodes could not be recording from the same unit. In total, we had 1,300 pairs of true-positive scores and 15,134 pairs of true-negative scores (161 units sorted on 94 electrodes each).
The stability criterion was created by applying quadratic discriminant analysis (QDA) to the problem of classifying pairs of scores into one of two clusters: true positives (stable) and true negatives (unstable). QDA leads to a quadratic equation, combining the two scores into a single score, which is then compared with a threshold. QDA is defined for data following multivariate Gaussian distributions, but works well for a wide variety of empirical classification problems (Hastie et al. 2001). We first normalized our scores to make them more Gaussian-like. The waveform score W was converted to a normalized, Gaussian score W′ by applying the Fisher transform (the inverse hyperbolic tangent, tanh−1). Likewise, the ISIH score I was converted to the approximately Gaussian I′ by applying the natural logarithm
 |
(2) |
 |
(3) |
The two-dimensional clusters of true-positive and true-negative normalized scores (plotted in Fig. 2) can be summarized by their means μpos and μneg as well as covariances Σpos and Σneg. These values are then used as constants in the equation, converting a vector of normalized scores [W′ I′]T into a combined stability score (S). Our stability criterion then classifies a unit as stable if its combined score S is less than some threshold T. For
 |
(4) |
x is stable if S < T, where
 |
(5) |
and
 |
 |
(6) |
FIG. 2.
Truly stable and truly unstable units are classified using a quadratic decision boundary. The normalized waveform scores (W′) and normalized ISIH scores (I′) are plotted for the true positive (i.e., truly stable; black crosses) and true negative (i.e., truly unstable; gray circles) data points. These scores were combined to create a quadratic decision boundary (black solid line), so that all data points falling to the right of the boundary were classified as stable.
Because our “true-positive” data set is only 2 h, 40 min long, it likely underestimates the natural variability of stable units over a day or more. Thus we wanted the threshold T to have a negligible false-negative rate. Rather than take the maximum score (which would be sensitive to outliers), we set the threshold T as the mean of the true-positive stability scores plus 3SDs of the true-positive scores (T = 11.67). The false-positive rate for this threshold on the sample data set was 26%. To ensure that we did not overfit the data, we did fivefold cross-validation, using 80% for training and reserving 20% to test. The SDs of the parameter differences (σ), the cluster means and covariances (μpos, μneg, Σpos, Σneg), and the threshold T were computed on training data and used to classify the test data. This gave a false-positive rate of 26 ± 8% (mean ± SD).
We estimated the false-positive rate across sessions by applying the stability criterion to the true negatives from three data sets, one from each monkey. Because each electrode records from different neuronal units, we can use the percentage of units on adjacent electrodes that satisfy the stability criterion as an estimate of the chance of falsely classifying two different units as stable. Our definition of stability also applies to multiple sessions, so the estimate of stability through N sessions is defined as the percentage of units classified as stable through N consecutive electrodes (including the reference electrode).
We wanted to see whether combining spike waveform and ISIH data was more effective than using either alone. Therefore we used a similar method to pick a threshold for the spike waveform score and ISIH score values treated separately. The spike waveform threshold was the mean of the true-positive normalized waveform scores W′ minus 3SDs (a high W′ indicates stability), so the waveform criterion classifies a unit as stable if its waveform score W is >0.990. The ISIH threshold was the mean of the true-positive ISIH scores I′ plus 3SDs (a low I′ indicates stability), so the ISIH criterion classifies a unit as stable if its ISIH score I is <10.5 (see Fig. 10).
RESULTS
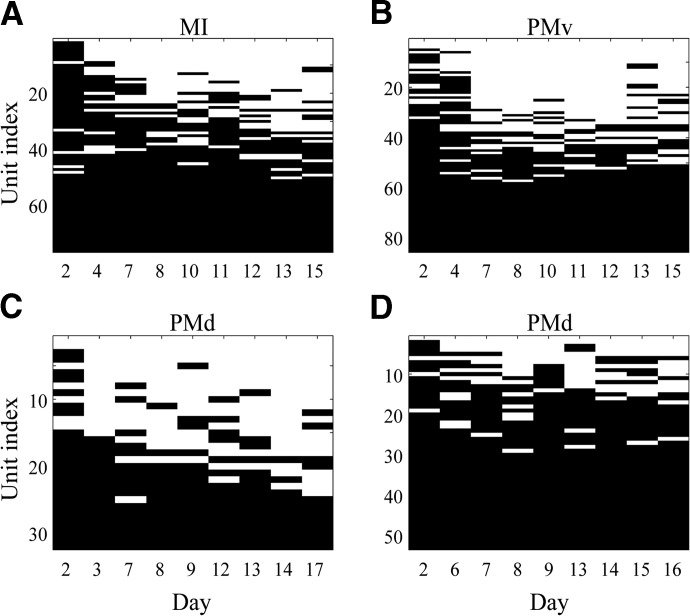
Our analysis used the stability criterion described earlier to compare whether each unit was stable on a given recording session compared with the reference session (i.e., the first recording session) for four data sets (Fig. 3). Stability on a given day means the stability criterion was satisfied on that day (i.e., stability score S < threshold T). We also define stability through a given day, which means that all sessions recorded before or on the current day were classified as stable. For example, a unit that was stable through the last recording day would have a solid, horizontal black line across the entire x-axis next to its unit index. With respect to the three types of units, there were 1) units that were never stable (and thus have a solid white line), 2) units that flickered in and out of stability, and 3) units that were stable through the last recording session (and have a solid black line).
FIG. 3.
Application of the stability criterion to 4 data sets. A black line segment indicates that the unit was stable on a given day relative to the first, reference day, whereas a blank, white line segment denotes that the unit was unstable. Note the x-axis shows the days of the recording sessions of each data set. A and B correspond to data sets from MI (A) and PMv (B) in monkey VL. C and D correspond to data sets from PMd in monkey BO (C) and monkey RJ (D). The unit indices are ordered from least stable (over all days) to most stable. MI, primary motor cortex; PMd, dorsal premotor cortex; PMv, ventral premotor cortex.
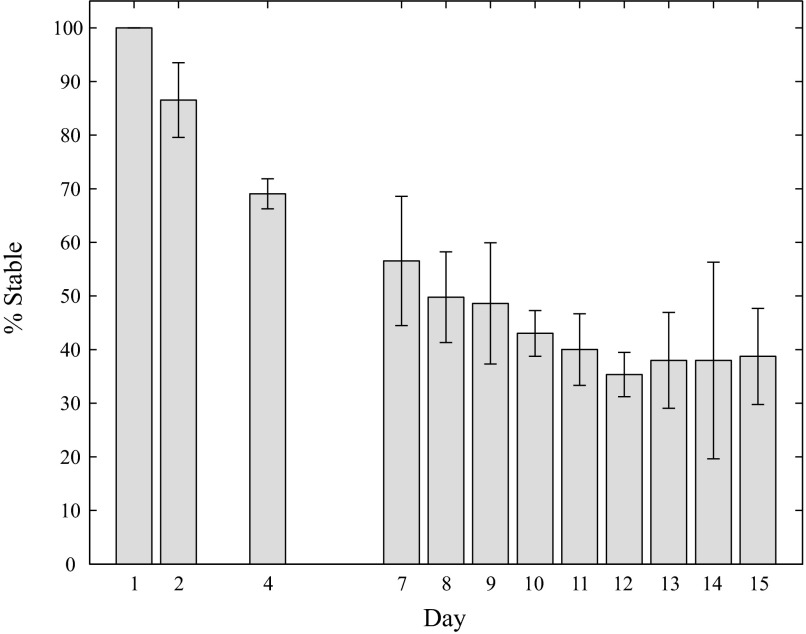
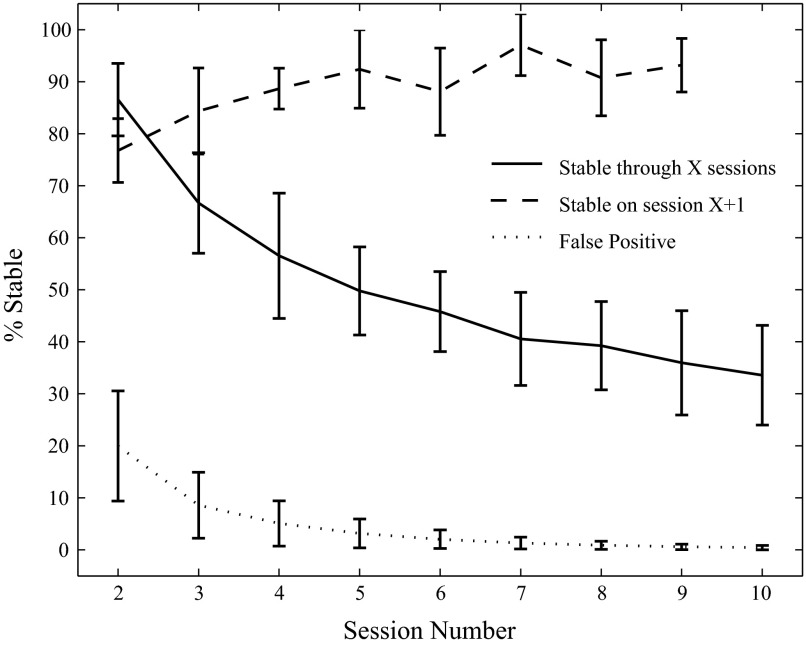
These stability results can be combined into a percentage probability that a neuron would be stable through a given day, averaged across all four data sets, for all days with multiple repetitions (Fig. 4): 87 ± 7% (mean ± SD) of the original units were stable through day 2, 57 ± 12% were stable through day 7, 43 ± 4% were stable through day 10, and 39 ± 9% were stable through day 15.
FIG. 4.
Percentage of stable units through a given day. The bar and error bar heights represent the mean and SD of the percentage of stable units over all data sets. Days that had one or no data points were left blank. All units were assumed to be stable on the first day.
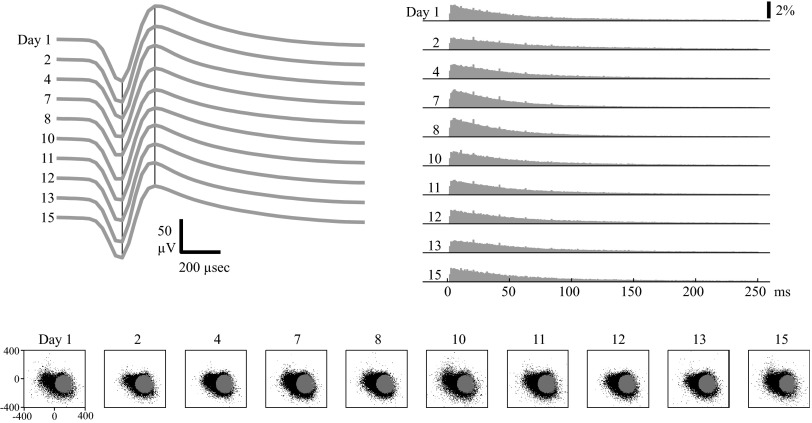
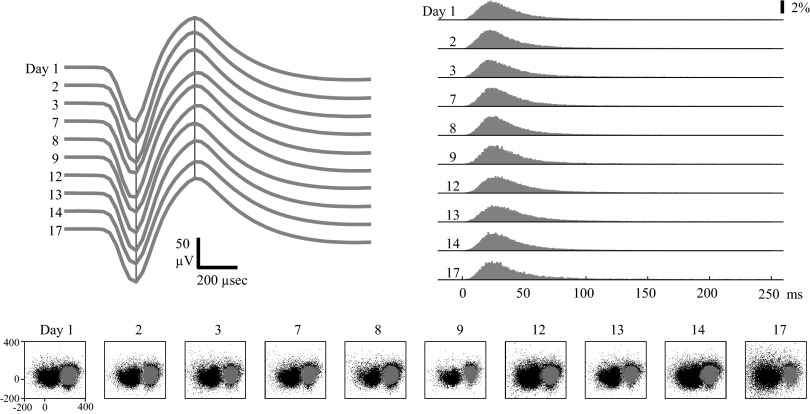
Many neurons were classified as stable through the entire duration (15–17 days) of their data set (Figs. 5 and 6). This means that the stability criterion was satisfied on nine of nine sessions recorded after the original reference session. Note that both the average spike waveforms and ISIHs were consistent across the 15- to 17-day period in these two examples. Also, note that the unit in Fig. 5 shows fairly similar clusters of sorted and unsorted spike waveforms when projected onto the first two PCs of the reference session's data. In Fig. 6, the spike waveforms recorded from the electrode indicate the presence of another unit on the electrode (the black spike waveform cluster to the left on the PC 1 vs. PC 2 plots), which was also classified as stable over the entire data set. However, the clusters do not seem to shift in PC space and thus do not interfere with one another.
FIG. 5.
Example of a stable MI unit. Top left: average waveforms from each session. The black vertical lines mark the peak and valley times of the first day's average spike waveform. Top right: ISIHs from each session. Bottom: unsorted (black) and sorted (gray) waveforms from each session projected onto the first (x-axis) and second (y-axis) principal components (PCs), as determined from the first session's data. The numbers ranging from 1 to 15 label the day each session was recorded on, relative to the first day. The ranges of axes (1st and 2nd PC coefficients) are labeled for the first day; subsequent days use the same axes.
FIG. 6.
Example of a stable PMd unit. Format is identical to that in Fig. 5. Note that there is a second waveform cluster (black dots) in PC space to the left of the sorted unit.
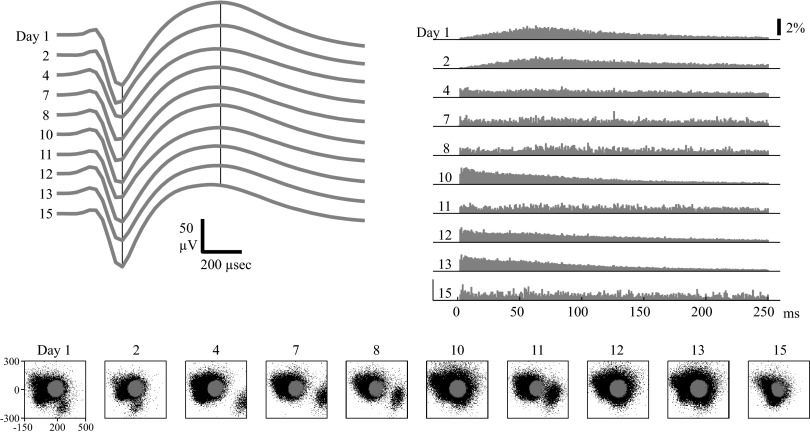
Other neurons did not exhibit long-term stability due to unstable waveforms and/or unstable ISIHs (Figs. 7 and 8). The unit in Fig. 7 would have been considered stable through day 13 if only the spike waveform criteria (W >0.99) were used. However, when both ISIH and waveform data were combined into the stability criteria, the unit was classified as stable through day 2 but unstable thereafter. This is consistent with visual inspection, in which the ISIHs on days 1 and 2 appeared similar but the ISIHs from the rest of the days were very different. Examining the spike waveforms in PC space shows multiple clusters. Unlike the data in Fig. 6, these clusters did not appear to be stable and drifted around in PC space. In particular, note how the unsorted waveform cluster in the bottom right corner of day 4's PC plot seems to drift upward and then leftward into the main group of waveforms. The sorted unit seems to be capturing multiunit activity, not a single, stable unit that is well isolated across days.
FIG. 7.
Example of a PMv unit with stable spike waveforms but unstable ISIHs. Format is identical to that in Fig. 5. The waveform criteria classified the unit as stable through day 13. However, the stability criteria (using both waveform and ISIH data) classified the unit as stable through day 2 but as unstable thereafter. Note the change in the ISIH between day 2 and day 4.
FIG. 8.
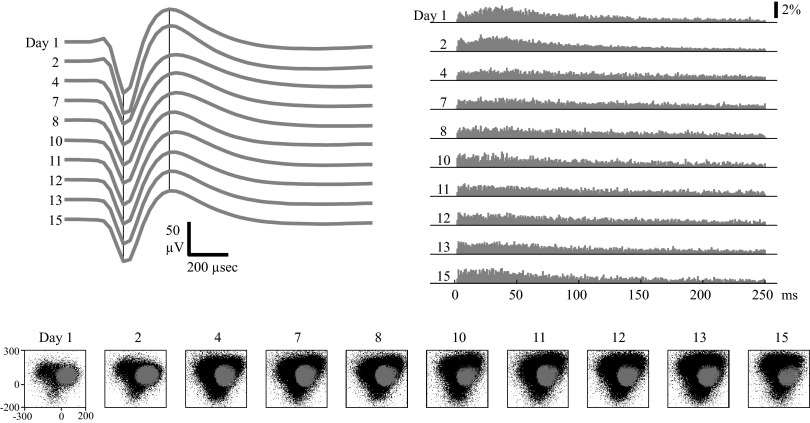
Example of an MI unit with unstable waveforms but stable ISIHs. Format is identical to that in Fig. 5. The ISIH criteria classified the unit as stable through day 15. However, the stability criterion classified the unit as stable through day 2 but as unstable thereafter. Note the change in waveform shape between day 2 and day 4.
The unit in Fig. 8 would have been considered stable over the entire 15-day period if only the ISIH data were used. There is a subtle change in the ISIH between day 2 and day 4 that leads to an increase in the ISIH score from 2.7 to 6.9, but this value was still below the threshold for the ISIH criteria (I <10.5). However, the stability criteria classified the unit as stable through day 2 but as unstable thereafter. This is consistent with visual inspection, in which there appears to be a significant change in waveform shape between day 2 and day 4. There also appears to be a change in the clustering of waveforms projected into PC space between day 2 and day 4.
One of the most useful results from our stability analysis is the finding that stable units are more likely to remain stable (Fig. 9). Because the four data sets were recorded on different days, we calculated the percentage of the original units that remained stable as a function of the number of the recording session (there were 10 total sessions for each data set). For sessions 2 to 9, we computed, of the units that were stable through a given number of sessions, the percentage that were also stable on the next session. Of the 57% of neurons that were stable through four sessions recorded over a total of 7 days, 89 ± 4% were also stable on the next day's session; neurons that were stable through the first four or more sessions had at minimum an 88% chance of being stable on the next session.
FIG. 9.
Stable units are more likely to remain stable. The solid trace plots the percentage of the original units stable through a given number of consecutive sessions. With respect to the neurons that were stable through a given session, the dashed trace plots the percentage that were also stable on the next recording session. The dotted trace shows the estimated false-positive rate of classifying a unit as stable through a given number of sessions. The false-positive rate is derived by comparing units across different electrodes and seeing what percentage was classified as stable (see methods for details).
The false-positive rate (i.e., the percentage of neurons deemed to be stable using our stability criterion when they are not) drops off quickly as a function of the number of sessions (dotted black line, Fig. 9). This was estimated by looking, for each monkey, at the percentage of “true negatives” (see methods) that satisfied the stability criterion through a given number of consecutive electrodes. This is an estimate of the false-positive rate through a given number of sessions. Each of the nine values of percentage stable through a given number of sessions was significantly different from the corresponding estimate of the false-positive rate (P < 0.01).
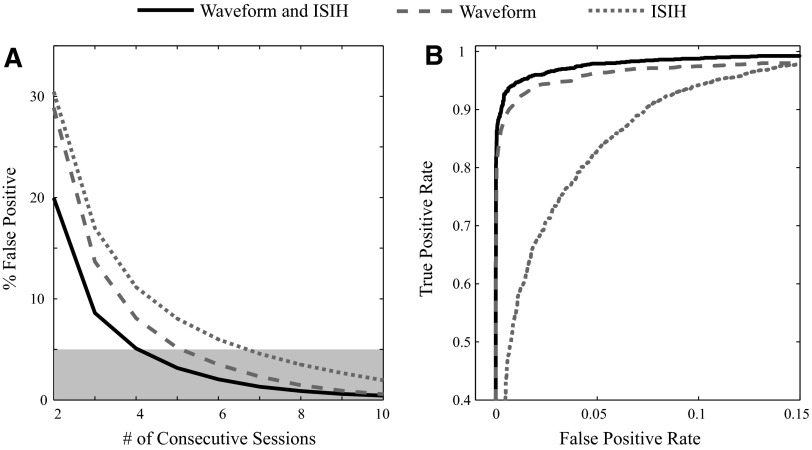
The stability criterion, which combined spike waveform and ISIH measures, resulted in fewer false positives than using either the waveform or ISIH criterion alone (Fig. 10A). A paired t-test indicated that the mean false-positive rates using both spike waveform and ISIH data were significantly less than using either the spike waveform or ISIH data alone (P < 0.05). When using the stability criterion, the false-positive rate is <5% after neurons are tracked through at least five sessions. To achieve a false-positive rate of <5% using only waveform data would require six sessions, whereas using only ISIH data would require seven sessions.
FIG. 10.
Using both waveform and ISIH data reduces false positives. A: the estimated false-positive rate, which is the percentage of units of the “true negatives” deemed to be stable through a given number of sessions, is less when using both waveform and ISIH data (solid black trace) than when using just waveform data (dashed gray trace) or just ISIH data (dotted gray trace) alone. The 5% significant level is also indicated (light gray box). The number of consecutive electrodes is used as a proxy for the number of sessions. B: the area under the receiver operating characteristic curve (a measure of classification performance) is higher when using both waveform and ISIH data then when using just waveform or just ISIH data alone. The differences in the area under the curves were found to be statistically significant (see text for details).
However, the differences in false-positive rates might be explained by the differing thresholds used for each classifier, rather than by a difference in performance. A way to examine the performance of a binary classifier without assigning a specific threshold is to construct a receiver operating characteristic (ROC) curve that plots the rate of true positives against the rate of false positives for each possible threshold. The ROC curves demonstrate that using combined waveform and ISIH data delivers better performance (an ROC curve closer to the top left corner) than using either the waveform or ISIH data alone (Fig. 10B). The performance of each classifier can be summarized as the area under the curve (AUC), in which an AUC of 1 reflects perfect performance. The AUC for the combined score applied to our “true-positive” and “true-negative” data sets (see methods) was 0.995, compared with 0.989 for the waveform score and 0.968 for the ISIH score. The differences between these AUCs were determined to be statistically significant (P < 0.01) by a nonparametric test that takes into account the correlation between the scores (Vergara et al. 2008).
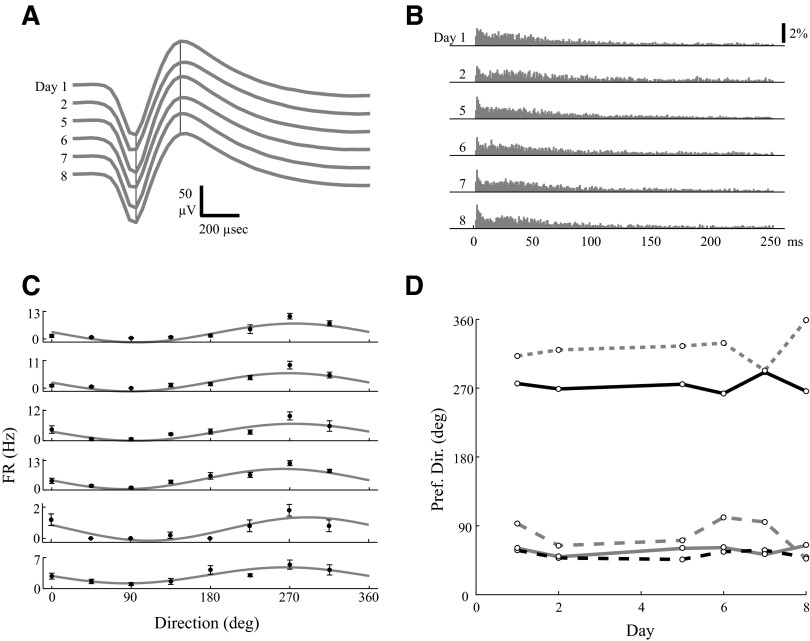
We applied our method to identify stable neurons during a visuomotor adaptation task by examining solely the prelearning epoch across days. Our method does identify stable units: we found that 29.8% of neurons (25 of 84) were stable in six of six sessions recorded over 8 days. These stable waveforms displayed consistent waveforms and ISIHs, as exemplified by the unit in Fig. 11, A and B. The directional tuning curves computed from the prelearning epoch also showed a consistent preferred direction across days for this unit (Fig. 11C), as they did for all five stable units that also displayed significant tuning (P < 0.01) on all sessions (Fig. 11D).
FIG. 11.
Stable units can be identified using only the prelearning epoch during an adaptation experiment. A: average waveforms of a stable MI unit across 6 sessions recorded over an 8-day period. B: ISIHs for the same unit. Formats for A and B are identical to the top of Fig. 5. C: this same unit shows a consistent directional tuning of the average (black dot, ±SE) firing rates in each direction and a consistent preferred direction of the fit (gray trace) cosine tuning curve. D: the preferred directions vs. the day of each recording session is plotted for 5 (of 25 total) units that displayed significant (P < 0.01) directional tuning on 6/6 sessions, including the unit from A–C (solid black trace).
On the first day of adaptation, 6 of the 25 stable neurons showed a significant increase (P < 0.01) in the firing rate during the instruction period after introduction of a 22.5° counterclockwise rotation for reaches to a 90° target. These results are consistent with previous reports that adaptation to a visuomotor rotation causes an increase in firing rate during the instruction period (Paz et al. 2003). On all subsequent days, we did not observe consistent increases in firing rate during the instruction period.
DISCUSSION
Our study demonstrates that a subset of neurons recorded with a Utah array remained stable over a period of days to weeks and that using ISIH data in addition to waveform data improves the identification of stable units. Our results are similar to data reported from other chronically implanted intracortical electrodes (see introduction). We should emphasize that we spike-sorted each electrode exactly the same way across all sessions. This eliminated the variability of manual spike sorting as a potential source of instability (Wood et al. 2004). Also, we set thresholds to minimize the false-negative rate (i.e., the percentage of units deemed to be unstable using our stability criterion when they were, in fact, stable) because our “true positives” used to derive the threshold came from a 2-h, 40-min recording session that likely underestimated the inherent variability of stable units over one or more days. We were willing to tolerate a high false-positive rate when comparing just two sessions because the false-positive rate quickly declines as increasingly more sessions are considered.
An alternative approach would be to use one of the recently developed systems for continuously recording neural data from freely behaving macaques (Jackson and Fetz 2007; Jackson et al. 2006; Santhanam et al. 2007). For example, Santhanam and colleagues (2007) demonstrated that a single neuronal unit recorded from a Utah array can display consistent waveform scores over several days. However, continuous recording produces a large amount of data, so only a handful of channels can be recorded without overwhelming the onboard memory storage. A single channel sampled at 30 kHz with 12-bit resolution generates about 3.6 Gb of data per day, so a 96-channel Utah array would produce close to 350 Gb of data per day. Therefore given current hardware limitations, it is still useful to have a technique that tracks stability of a large pool of neurons between intermittently acquired recording sessions.
There are some limitations to our approach. First, the stability analysis takes a nontrivial amount of computation time, particularly for fitting the ISIHs to a mixture of log-normal distributions. We feel this effort is worthwhile when researchers want to minimize the false-positive rate, but if false positives are acceptable, then a qualitative comparison of waveforms or their PC clusters may be adequate. Second, we do not discriminate between two different sources of instability: neuronal units that obviously “dropped out” between sessions (usually with a large decrease in the number of sorted waveforms) and neurons that gradually shifted their waveform and/or ISIH shape until they no longer satisfied our stability criterion. Third, it is not clear whether gradual shifts in recorded signals arise from actual changes in neuronal properties or, instead, arise from changes in the background noise that contaminates even spike-sorted neuronal signals. In learning studies, such shifts in noise might be interpreted as learning effects, so detailed analyses should be careful to control for the natural variability observed even in stable neuronal units.
For the three monkeys used in our stability analysis, we tried to minimize the effects of learning by using behavioral tasks on which our monkeys were overtrained. However, we also wanted to see whether we could also track stable neurons in the context of learning or adaptation. Our requirement of ISIH stability means that our method should not be used when learning is expected to cause a permanent, global change in firing properties. However, many learning and adaptation experiments are divided into precontrol, learning, and postcontrol epochs and the effects of learning are quantified by comparing the precontrol and postcontrol epochs. Therefore if the precontrol behavioral task is held constant, our method can be applied solely to this epoch across days. Additionally, if the learning aftereffects seen in the postcontrol epoch are not expected to persist into the next day, then neurons should display similar ISIHs during the precontrol epoch across days.
We trained a fourth monkey to perform a visuomotor rotation adaptation task similar to that described by Paz and Vaadia (2003)). We demonstrate 1) that a number of neurons were stable over six sessions collected over 8 days, and 2) that, at least on the first day, the neurons showed changes in firing rates consistent with adaptation to the learned rotation. We believe that we did not see the same changes in firing rates on subsequent days because the magnitude and direction of the rotation were not varied across days. Therefore the monkey may be switching to a prelearned state rather than adapting to a novel stimulus. However, this is in itself an interesting result because it would not be possible to observe this without some method of assessing neuronal stability; otherwise, you could not rule out the possibility that the recorded pool of neurons had simply shifted.
Another practical implication of our results is that it should be possible to pool data across sessions to increase the repetitions of a given task or condition. There is a limit to how long animals are able or willing to perform in a given session and so it is often difficult to gather sufficient data for complicated tasks. Recording sessions with a small number of trials are often discarded as useless, when in fact data could be combined across sessions for neurons that are classified as stable. Our results indicate that doing this over a week's worth of recording sessions would decrease the yield of neuronal units by half, but the number of repetitions could increase sevenfold.
These results have ramifications for brain–machine interface (BMI) technology. Although the functional stability of a BMI might be even higher than the neuronal stability reported here, we propose the following strategy for maximizing the yield of stable neurons: record a standard task over several days, identify the subset of stable neurons, and then use only this stable subset for real-time neural control of the cursor or device. Because this stable subset is very likely to remain stable (see Fig. 9, dashed line), it may be possible to use the same decoding filter from day to day, without the need for retraining the filter at the beginning of the experiment. This would increase the amount of data collected in experimental paradigms and could make BMI technology more user-friendly in the clinical setting.
We should make the caveat that the exact percentages of stable cells reported here cells will not generalize to all monkeys, implantation sites, or behavioral tasks. Instead, researchers should use our method or a similar one to generate estimates of stability for their specific experimental setup. That said, we feel our results indicate that it is possible to record stable neuronal signals for days to weeks using a Utah array in a wide variety of experimental paradigms.
DISCLOSURES
N. G. Hatsopoulos has stock ownership in Cyberkinetics Neurotechnology Systems, Inc., which is commercializing neural prostheses for severely motor disabled people.
GRANTS
This work was supported by National Institute of Neurological Disorders and Stroke Grants R01 NS-045853 and R01 NS-048845 and a National Institute of General Medical Sciences/Medical Scientist National Research Service Award 5 T32 GM-07281.
Acknowledgments
We thank Z. Haga and D. Paulsen for help with the surgical implantation of the arrays, training of monkeys, and data collection.
REFERENCES
- Chen 2005.Chen D, Fetz EE. Characteristic membrane potential trajectories in primate sensorimotor cortex neurons recorded in vivo. J Neurophysiol 94: 2713–2725, 2005. [DOI] [PubMed] [Google Scholar]
- Georgopoulos 1986.Georgopoulos AP, Schwartz AB, Kettner RE. Neuronal population coding of movement direction. Science 233: 1416–1419, 1986. [DOI] [PubMed] [Google Scholar]
- Hastie 2001.Hastie T, Tibshirani R, Friedman J. The Elements of Statistical Learning: Data Mining, Inference, and Prediction. New York: Springer, 2001.
- Hatsopoulos 1998.Hatsopoulos NG, Ojakangas CL, Paninski L, Donoghue JP. Information about movement direction obtained from synchronous activity of motor cortical neurons. Proc Natl Acad Sci US A 95: 15706–15711, 1998. [DOI] [PMC free article] [PubMed] [Google Scholar]
- Hatsopoulos 2007.Hatsopoulos NG, Xu Q, Amit Y. Encoding of movement fragments in the motor cortex. J Neurosci 27: 5105–5114, 2007. [DOI] [PMC free article] [PubMed] [Google Scholar]
- Jackson 2007.Jackson A, Fetz EE. A compact movable microwire array for long-term chronic unit recording in cerebral cortex of primates. J Neurophysiol 98: 3109–3118, 2007. [DOI] [PubMed] [Google Scholar]
- Jackson 2006.Jackson A, Moritz CT, Mavoori J, Lucas TH, Fetz EE. The neurochip BCI: towards a neural prosthesis for upper limb function. IEEE Trans Neural Syst Rehabil Eng 14: 187–190, 2006. [DOI] [PubMed] [Google Scholar]
- Kriegeskorte 2009.Kriegeskorte N, Simmons WK, Bellgowan PS, Baker CI. Circular analysis in systems neuroscience: the dangers of double dipping. Nat Neurosci 12: 535–540, 2009. [DOI] [PMC free article] [PubMed] [Google Scholar]
- Liu 2006.Liu X, McCreery DB, Bullara LA, Agnew WF. Evaluation of the stability of intracortical microelectrode arrays. IEEE Trans Neural Syst Rehabil Eng 14: 91–100, 2006. [DOI] [PubMed] [Google Scholar]
- Maynard 1999.Maynard EM, Hatsopoulos NG, Ojakangas CL, Acuna BD, Sanes JN, Normann RA, et al. Neuronal interactions improve cortical population coding of movement direction. J Neurosci 19: 8083–8093, 1999. [DOI] [PMC free article] [PubMed] [Google Scholar]
- Maynard 1997.Maynard EM, Nordhausen CT, Normann RA. The Utah intracortical electrode array: a recording structure for potential brain–computer interfaces. Electroencephalogr Clin Neurophysiol 102: 228–239, 1997. [DOI] [PubMed] [Google Scholar]
- Nicolelis 2003.Nicolelis MA, Dimitrov D, Carmena JM, Crist R, Lehew G, Kralik JD, et al. Chronic, multisite, multielectrode recordings in macaque monkeys. Proc Natl Acad Sci USA 100: 11041–11046, 2003. [DOI] [PMC free article] [PubMed] [Google Scholar]
- Paninski 2004.Paninski L, Fellows MR, Hatsopoulos NG, Donoghue JP. Spatiotemporal tuning of motor cortical neurons for hand position and velocity. J Neurophysiol 91: 515–532, 2004. [DOI] [PubMed] [Google Scholar]
- Paz 2003.Paz R, Boraud T, Natan C, Bergman H, Vaadia E. Preparatory activity in motor cortex reflects learning of local visuomotor skills. Nat Neurosci 6: 882–890, 2003. [DOI] [PubMed] [Google Scholar]
- Rousche 1992.Rousche PJ, Normann RA. A method for pneumatically inserting an array of penetrating electrodes into cortical tissue. Ann Biomed Eng 20: 413–422, 1992. [DOI] [PubMed] [Google Scholar]
- Rousche 1998.Rousche PJ, Normann RA. Chronic recording capability of the Utah intracortical electrode array in cat sensory cortex. J Neurosci Methods 82: 1–15, 1998. [DOI] [PubMed] [Google Scholar]
- Suner 2005.Suner S, Fellows MR, Vargas-Irwin C, Nakata GK, Donoghue JP. Reliability of signals from a chronically implanted, silicon-based electrode array in non-human primate primary motor cortex. IEEE Trans Neural Syst Rehabil Eng 13: 524–541, 2005. [DOI] [PubMed] [Google Scholar]
- Tolias 2007.Tolias AS, Ecker AS, Siapas AG, Hoenselaar A, Keliris GA, Logothetis NK. Recording chronically from the same neurons in awake, behaving primates. J Neurophysiol 98: 3780–3790, 2007. [DOI] [PubMed] [Google Scholar]
- Vergara 2008.Vergara IA, Norambuena T, Ferrada E, Slater AW, Melo F. StAR: a simple tool for the statistical comparison of ROC curves (Abstract). BMC Bioinform 9: 265, 2008. [DOI] [PMC free article] [PubMed] [Google Scholar]
- Wood 2004.Wood F, Black MJ, Vargas-Irwin C, Fellows M, Donoghue JP. On the variability of manual spike sorting. IEEE Trans Biomed Eng 51: 912–918, 2004. [DOI] [PubMed] [Google Scholar]
- Worgotter 1998.Worgotter F, Suder K, Zhao Y, Kerscher N, Eysel UT, Funke K. State-dependent receptive-field restructuring in the visual cortex. Nature 396: 165–168, 1998. [DOI] [PubMed] [Google Scholar]


