

Abstract
Parkinson's disease is caused by a progressive loss of the midbrain dopamine (DA) neurons in the substantia nigra pars compacta. Although the main cause of Parkinson's disease remains unknown, there is increasing evidence that it is a complex disorder caused by a combination of genetic and environmental factors, which affect key signalling pathways in substantia nigra DA neurons. Insights into pathogenesis of Parkinson's disease stem from in vitro and in vivo models and from postmortem analyses. Recent technological developments have added a new dimension to this research by determining gene expression profiles using high throughput microarray assays. However, many of the studies reported to date were based on whole midbrain dissections, which included cells other than DA neurons. Here, we have used laser microdissection to isolate single DA neurons from the substantia nigra pars compacta of controls and subjects with idiopathic Parkinson's disease matched for age and postmortem interval followed by microarrays to analyse gene expression profiling. Our data confirm a dysregulation of several functional groups of genes involved in the Parkinson's disease pathogenesis. In particular, we found prominent down-regulation of members of the PARK gene family and dysregulation of multiple genes associated with programmed cell death and survival. In addition, genes for neurotransmitter and ion channel receptors were also deregulated, supporting the view that alterations in electrical activity might influence DA neuron function. Our data provide a ‘molecular fingerprint identity’ of late–stage Parkinson's disease DA neurons that will advance our understanding of the molecular pathology of this disease.
Keywords: Parkinson's disease, microarray, laser microdissection, pathogenesis, dopamine
Introduction
Parkinson's disease is a neurodegenerative disorder caused by a progressive deterioration of midbrain dopamine (DA) neurons in the substantia nigra pars compacta (SNc). The death of DA cells is associated with tremor and rigidity and results in a gradual dysfunction of the extrapyramidal motor system. The disease affects about 2–3% of individuals over the age of 65 years and there is evidence that its prevalence is higher in the male population (Cantuti-Castelvetri et al., 2007). There is currently no cure for Parkinson's disease and the underlying pathogenesis of the disease is still unknown. Two forms of Parkinson's disease are recognized: a ‘familial’ or early-onset Parkinson's disease (<10% of all patients) and an ‘idiopathic’ or late-onset Parkinson's disease (>85% of all cases) that does not appear to exhibit heritability. Overall, the pathology of Parkinson's disease is complex and is most likely a ‘consequence of an unspecified combination of genetic and environmental factors, which induce a common pathogenic cascade of molecular events’ (Maguire-Zeiss and Federoff, 2003; Miller and Federoff, 2005).
Since the first description of this syndrome in 1817 by James Parkinson, Parkinson's disease has been the subject of intense investigation to understand its pathophysiology and to develop therapeutic interventions. So far, pharmacological and surgical therapies are available and can alleviate some of the symptoms, but these interventions are associated with serious side effects and generally lose efficacy over time (Benabid, 2007; Schapira, 2007). Although research has progressed, one of the main hurdles for the development of therapeutic or preventative measures is the still limited understanding of the underlying pathophysiology of Parkinson's disease and the lack of reliable biomarkers. To a large extent, biomedical research on Parkinson's disease focuses on in vitro and in vivo disease models, as well as studies of postmortem brain. Based on the availability of more sophisticated technologies, the latter has become more prominent over the past years and has revealed novel insights in the pathogenesis of Parkinson's disease. For example, several studies have used microarray technologies on the substantia nigra of normal control and Parkinson's disease patients to assess differential gene expression profiles; data from these studies have helped to further delineate some disease-associated pathways (Grunblatt et al., 2004; Hauser et al., 2005; Zhang et al., 2005; Duke et al., 2006; Miller et al., 2006; Moran et al., 2006, 2007; Moran and Graeber, 2008). However, the array results in these studies did not entirely represent the DA neuronal profile, since large amounts of other cell populations were also included in the dissected tissue. The introduction of laser microdissection (LMD) has further refined this approach and was essential to the demonstration of a broad gender-linked difference in the gene expression profile of human substantia nigra DA neurons (Cantuti-Castelvetri et al., 2007).
In the current study, we used LMD (Benes et al., 2007) to isolate DA neurons from the substantia nigra of nine normal and 10 idiopathic Parkinson's disease patients. Using microarray-based gene expression profiling, we have analysed our data based on cluster analyses of biological functions and cellular pathways relevant to Parkinson's disease pathology and have compared the results to the published expression profiles. Our data confirm the involvement of several known molecular regulatory pathways in the pathogenesis of Parkinson's disease: these include oxidative stress-induced cell responses and dysfunction of the mitochondrial and ubiquitin-proteasome system (UPS). In particular, we found clusters of differentially expressed genes that appear to be involved in extrinsic and intrinsic signalling events in programmed cell death (PCD), as well as a prominent down-regulation of multiple members of the PARK gene family, which are associated with familial forms of Parkinson's disease. In addition, we have also noted changes in the expression of neurotransmitter and ion channel genes that suggest alterations in synaptic activity; the latter have been implicated in the modulation of survival and/or degeneration of DA neurons.
Materials and Methods
Subjects and affymetrix-based microarrays
All affymetrix-based microarrays and data about subjects are publicized at the National Brain Databank and were deposited by Dr. Francine Benes (http://national_databank.mclean.harvard.edu/brainbank). Material collection, preparation and data generation were according to previously published protocols (Benes et al., 2007). Briefly, frozen tissue blocks containing SNc from control subjects and patients with idiopathic Parkinson's disease matched for age and postmortem interval (PMI) were cut using a Microm HM 560 CryoStar cryostat (8 µm), mounted on LEICA Frame Slides with a PET-membrane (1.4 µm) and placed on a LEICA AS LMD apparatus. Since DA neurons contain neuromelanin, they could easily be visualized and collected using laser-based microdissection. Each vial into which the laser-dissected specimens fell by gravity contained a small volume of a lysis/denaturing solution to inhibit RNAse activity. An average of 300 or 700 DA neurons were collected from control subjects or Parkinson's disease patient's brains, respectively. RNA extraction was undertaken with a Qiagen RNeasy Micro Kit (Qiagen, Valencia, CA), and quality was assessed using an Agilent 2100 bioanalyser (Agilent Technologies, Palo Alto, CA). Following the manufacturer's instructions, three rounds of linear amplification of the target was carried out using the MessageAmp aRNA Amplification kit (Ambion, Austin, TX). The use of three rounds of amplification could induce degradation of RNA and potentially bias the microarray data; however, all the samples from both groups were processed in an identical fashion, making it unlikely that such bias occurred in one group to a greater degree than another. Subsequently, target labeling was performed with the Message-AMP Biotin Enhanced Kit (Ambion). Fifteen micrograms of biotinylated target RNA was fragmented and individually hybridized to the HU-133A arrays (Affymetrix, Santa Clara, CA). The microarrays were then stained with two rounds of streptavidin-phycoerythrin (Molecular Probes, Eugene, OR) and one round of biotinylated antistreptavidin antibody (Vector Laboratories, Burlingame, CA), scanned twice, and visually inspected for evidence of artefacts.
In addition to their demographic factors, the cases included in this study (Table 1) were chosen on the basis of their RNA quality using tissue pH, the 18S/28S ratio, and the Percent Present Calls for each case as described elsewhere (Luzzi et al., 2003; Benes et al., 2007).
Table 1.
| Panel A. Statistics of cases used for LMD and mRNA arrays | |||||
|---|---|---|---|---|---|
| Case ID | Assay ID | Age | Primary diagnosis | Gender | PMI |
| C1 | 1020 | 73 | Control | M | 20.53 |
| C2 | 1022 | 89 | Control | M | 7.4 |
| C3 | 1024 | 79 | Control | M | 20.92 |
| C4 | 1147 | 78 | Control | M | 21.75 |
| C5 | 1150 | 75 | Control | M | 20.12 |
| C6 | 1151 | 68 | Control | M | 16.58 |
| C7 | 1152 | 72 | Control | F | 18.25 |
| C8 | 1156 | 69 | Control | F | 25.15 |
| C9 | 1157 | 74 | Control | F | 12.17 |
| PD1 | 1143 | 77 | PD | M | 10.33 |
| PD2 | 1144 | 81 | PD | F | 17 |
| PD3 | 1145 | 79 | PD | M | 23.42 |
| PD4 | 1146 | 72 | PD | M | 26.25 |
| PD5 | 1148 | 73 | PD | M | 18 |
| PD6 | 1149 | 83 | PD | M | 21.25 |
| PD7 | 1153 | 77 | PD | M | 22.67 |
| PD8 | 1154 | 84 | PD | F | 6.42 |
| PD9 | 1155 | 77 | PD | M | 26.25 |
| PD10 | 1158 | 81 | PD | F | 26.75 |
| Group | Average age | Average PMI | Average age of neurological onset | Average age of psychological onset | |
| Control | 75.22 | 18 | 0 | 0 | |
| PD | 78.4 | 19.83 | 65.8 | 69.25 | |
|
Panel B. Statistics of cases used for LMD and mRNA arrays by qRT-PCR | |||||
| Case ID | Assay ID | Age | Primary diagnosis | Gender | PMI |
| C3 | 1024 | 79 | Control | M | 20.92 |
| C10 | 72 | Control | M | 18.25 | |
| C11 | 71 | Control | M | 23.40 | |
| PD3 | 1145 | 79 | PD | M | 23.42 |
| PD4 | 1146 | 72 | PD | M | 26.25 |
| PD11 | 68 | PD | M | 13.92 | |
PD = Parkinson's disease.
Data normalization and analysis
All mRNA chips were normalized using the RMA, or MAS5 procedure in R packages from Bioconductor (www.bioconductor.org), or using GCRMA in Partek Genomic Suite (www.partek.com). For each contrast of classes, probesets were filtered based on the detection calls derived from MAS5 procedure according to the majority rule (for each probeset, in at least one of the classes in contrast it shall have majority of their detection calls as ‘P’ (present) in the samples of this class in order to be retained in the filtered probeset lists). The data from either RMA or MAS normalization for those filtered probes were subjected to SAM procedure (Tusher et al., 2001) to determine the significant gene lists based on intended false discovery rates (FDR). Student t-tests were then used to filter significant gene lists. Alternatively, two- or three-way ANOVA models were used to derive the differentiated genes from different contrasts of different treatment and phenotypes using the Partek Genomic Suite.
The enrichment analysis and pathway-level comparative analysis were performed using the in-house software WPS [(Yi et al., 2006); Yi and Stephens, unpublished results]. Briefly, Fisher's exact test was performed based on 2 × 2 contingency tables, to determine whether a gene is in a given list and whether it is associated with a pathway (gene set, term). One-sided Fisher's exact test was used to measure whether a particular Biocarta pathway (www.biocarta.com), GSEA gene set term (www.broad.mit.edu/gsea/) or a GO term (www.geneontology.org/) were enriched in a given gene list. The terms were ranked based on their Fisher's exact test P-values with the most enriched term listed at the top. To compare biological themes at the pathway, gene set and GO term level across multiple gene lists of different contrasts, these gene lists were also subjected to a pathway-level pattern extraction pipeline (Yi and Stephens, unpublished results). Briefly, after batch computation of Fisher's exact test for the gene lists, the log-transformed P-values were retrieved and combined into an enrichment score matrix for cluster analysis or pathway pattern extraction. The terms (pathways, or GO terms) of selected clusters with interests were further used to retrieve the associated genes from the original gene list. Pathways of interest were displayed along with the data in the WPS program.
The data were also analysed in Partek Genomics Suite to determine the segregation of individual samples and possible differences among control subjects and Parkinson's disease patients (Supplementary Fig. 1S). Although there was a ‘batch effect’ observed between samples from three different dates of microarray assays (Supplementary Fig. 1SA), this could be compensated by using three-way ANOVA (Supplementary Fig. 1SB). These results demonstrated that all individual samples from normal subjects and Parkinson's disease patients clustered and that there was a clear segregation between normal and disease-association attesting for high consistency and reproducibility of the data.
TaqMan® real-time PCR assay validation
Expression of 14 genes (listed below) was measured in three normal control and three Parkinson's disease samples (Table 1) by real-time PCR using TaqMan® Gene Expression Assays and the 7900HT Real-Time PCR System (Applied Biosystems, Foster City, CA). A total of 250–600 DA neurons were captured from each sample and total RNA isolated using the mirVANA™ miRNA Isolation Kit (Ambion). cDNAs were generated in a 25 µl reverse transcription reaction with 60 ng of total RNA from each sample using the High Capacity cDNA Archive Kit and protocol (Applied Biosystems, PN 4322169). The resulting cDNA was subjected to a 10-cycle PCR amplification followed by real-time PCR reaction using the manufacturer's TaqMan® PreAmp Master Mix Kit Protocol (Applied Biosystems, PN 4366127). The 10-cycle pre-amplification protocol has been shown to have 100% efficiency and introduced no bias in fold change determination in a previous study (Li et al., 2008). Four replicates per sample were assayed for each gene in a 384-well format plate. For data normalization across samples, GUSB was used as endogenous control gene. Normalization of Ct values of each gene and determination of fold differences gene expression Parkinson's disease versus control was calculated according to the 2−ΔΔCt method by Livak and Schmittgen (2001; Schmittgen and Livak, 2008). The following genes were analysed:
| Gene symbol | Alias | TaqMan assay ID |
|---|---|---|
| RAP1GAP | PARK10 | Hs00182299_m1 |
| UCHL1 | PARK5 | Hs00188233_m1 |
| RIMS3 | PARK10 | Hs00207275_m1 |
| ATP13A2 | PARK9 | Hs00223032_m1 |
| Parkin | PARK2 | Hs00247755_m1 |
| PINK1 | PARK6 | Hs00260868_m1 |
| RIMS1 | PARK10 | Hs00394168_m1 |
| LRRK2 | PARK8 | Hs00411197_m1 |
| DJ-1 | PARK7 | Hs00697109_m1 |
| SLC6A3 | DAT | Hs00997364_m1 |
| UBE2K | UBE2K | Hs01001790_m1 |
| TH | TH | Hs01002184_m1 |
| KCNJ6 | GIRK2 | Hs01040524_m1 |
| SNCA | PARK1 | Hs01103386_m1 |
| GUSB | GUSB | Hs99999908_m1 |
Results
There are several approaches to the analysis of microarray data (summarized in Miller and Federoff, 2005). A common way is clustering genes according to fold changes and their relevance to biological function. In the current study, we employed a three-pronged approach:
Derivation of gene lists using SAM- and ANOVA-based data analysis (see Material and methods section for details);
Analysis of candidate genes associated with cellular pathways relevant to Parkinson's disease pathology according to published literature; and
Comparison with microarray data available from previous studies.
Because the statistical inclusionary criteria for deriving differentiated gene lists are somewhat arbitrary, we used different cut-offs and methods to generate corresponding lists of genes for similar class comparisons, and then assessed the consensus of the enrichment levels among these lists at functional pathway or gene set level (see details in ‘Material and methods’ section). We believe that the pathway-level enrichment, which considers gene sets or pathways with multiple relevant genes rather than individual genes, would be more consistent across these gene lists. Consequently, the gene sets or functional terms would be more relevant to the underlying biology represented by the class comparison: Parkinson's disease versus normal. For the more consensus pathways or gene sets (e.g. GO terms) associated genes were retrieved from the original gene lists and an example of this analysis is shown in Supplementary Fig. 2S. We found that the enrichment levels of the functional terms were highly concordant among the different gene lists. In addition, many of these lists were relevant to Parkinson's disease pathogenesis (see below) and similar to data from other published arrays (e.g. Grunblatt et al., 2004; Zhang et al., 2005; Cantuti-Castelvetri et al., 2007). A summary of the genes is presented in Supplementary Table 1S using three-way ANOVA (A3W, FDR10). This list was instrumental for additional cluster analyses using GenMAPP 2.1 (www.genmapp.org) (Doniger et al., 2003) and for generating gene clusters that are linked to Parkinson's disease pathology (see below).
Altogether, we found 465 down- and 580 up-regulated genes in the Parkinson's disease samples (Supplementary Table 1S). When the cut-off was set at greater than 1.5-fold difference, 358 out of the 465 downregulated genes fell into this group, while only 20 of the 580 upregulated genes were represented. Interestingly, the downregulated genes showed differences as high as 11.8-fold, while upregulated genes were not increased by more than 2-fold. In addition, almost all down- or upregulated genes had a strong association with neuronal function, pointing to a high stringency of the LMD collected material. A summary of the highest downregulated genes (>3-fold) with potential reference to the function of DA neurons is shown in Supplementary Table 2S. In the following, we present a detailed listing of our results according to gene groups and pathways that have been associated with the pathogenesis of Parkinson's disease.
PARK genes
Over the past decade, it has become clear that mutations in several genes are linked to familial forms of Parkinson's disease (Cookson, 2005; Moore et al., 2005). These genes are clustered in the PARK loci and, so far, PARK1 (a-Synuclein, SNCA), PARK2 (Parkin), PARK5 (UCH-L1), PARK6 (PINK1), PARK7 (DJ-1), PARK8 (LRRK2) and PARK9 (ATP13A2) have been implicated in this form of the disease (Schiesling et al., 2008). Our results demonstrate a down-regulation of PARK1, 5, 6, 7, 9 and 10 with an upregulation of the PARK10 loci-linked genes RAP1GA1 and RIMS1. Interestingly, DJ-1 was one of the highest downregulated genes (–8.55534-fold) in our entire data set (Table 2 and Supplementary Table 2S). These results are partly congruent with previously published arrays, in which down-regulation of PARK genes has also been described (Hauser et al., 2005; Moran et al., 2006, 2007; Moran and Graeber, 2008).
Table 2.
Genes associated with Parkinson's disease linkage (PARK loci)
| PARK | Gene symbol | GenBank ID | Description | Fold change | P-value |
|---|---|---|---|---|---|
| PARK1 | SNCA | BG260394 | Synuclein, alpha (non A4 component of amyloid precursor) | −1.85899 | 0.00037 |
| PARK5 | UCH-L1 | NM_004181 | Ubiquitin carboxyl-terminal esterase L1 (ubiquitin thiolesterase) | −1.94417 | 0.00409 |
| HIP2 | NM_005339 | Huntingtin interacting protein 2 | −1.22173 | 0.00218 | |
| PARK6 | PINK1 | AF316873 | PTEN induced putative kinase 1 | −2.15839 | 0.00010 |
| PARK7 | DJ-1 | NM_007262 | Parkinson disease (autosomal recessive, early onset) 7 | −8.55534 | 0.00048 |
| PARK9 | ATP13A2 | NM_022089 | ATPase type 13A2 | −1.37797 | 0.00432 |
| PARK10 | RAP1GA1 | AB007943 | RAP1 GTPase activating protein | 1.42168 | 0.00045 |
| RIMS1 | AF263310 | Regulating synaptic membrane exocytosis 1 | 1.22118 | 0.00142 | |
| RIMS3 | NM_014747 | Regulating synaptic membrane exocytosis 3 | −2.88055 | 0.00132 |
Programmed cell death
There are two major forms of apoptosis, intrinsic and extrinsic. While the intrinsic mechanisms are linked to several stress-related dysfunctions of cellular organelles, extrinsic apoptosis is mediated by death receptors. We found a striking downregulation of PINK1 and DJ-1, ATF4 as an indicator of ER stress (Ron and Walter, 2007; Burke, 2008), several clusters of genes linked to mitochondrial impairment (see below), and downstream factors that are involved in anti- and pro-apoptotic regulation, such as the bcl-2 protein family members BCL2L1 and BCL2A1, mitogen-activated protein kinase 8 (jun-kinase) interacting protein 3 (MAPK8IP3), LRPPRC and NFRKB. Strikingly, there was a consistent upregulation of the death receptors FAS, TNFRSF10B and TNFRSF21 as well as genes involved in their signalling cascade, such as TRADD, TNFAIP8, TNIP2, CFLAR, CASP8 and NFRKB indicating that extrinsic apoptosis is activated in Parkinson's disease-affected neurons (Table 3).
Table 3.
Genes associated with PCD and mitochondrial function
| Gene symbol | GenBank ID | Description | Fold change | P-value |
|---|---|---|---|---|
| Extrinsic pathway | ||||
| CASP8 | NM_001228 | caspase 8, apoptosis-related cysteine peptidase | 1.21115 | 0.0033 |
| CFLAR | AF015451 | CASP8 and FADD-like apoptosis regulator | 1.15656 | 0.0038 |
| FAS | Z70519 | Fas (TNF receptor superfamily, member 6) | 1.23956 | 0.0013 |
| LMNB1 | NM_005573 | lamin B1 | 1.18341 | 0.001 |
| NFRKB | NM_006165 | nuclear factor related to kappaB binding protein | 1.19163 | 0.0037 |
| TNFAIP8 | BC005352 | tumor necrosis factor, alpha-induced protein 8 | 1.18175 | 0.0032 |
| TNFRSF10B | BC001281 | tumor necrosis factor receptor superfamily, member 10b | 1.36905 | 0.0005 |
| TNFRSF21 | BE568134 | tumor necrosis factor receptor superfamily, member 21 | 1.19511 | 0.0037 |
| TNIP2 | AA522816 | TNFAIP3 interacting protein 2 | 1.2128 | 0.0038 |
| TRADD | L41690 | TNFRSF1A-associated via death domain | 1.31697 | 0.0034 |
| ER – associated pathway | ||||
| ATF4 | NM_001675 | activating transcription factor 4 | −2.00755 | 0.0024 |
| Intrinsic pathway and mitochondrial dysfunction | ||||
| ABL1 | NM_005157 | v-abl Abelson murine leukemia viral oncogene homolog 1 | −1.49544 | 0.0034 |
| API5 | NM_006595 | apoptosis inhibitor 5 | −1.18448 | 0.0036 |
| BCL2L1 | AL117381 | BCL2-like 1 | −1.45305 | 0.004 |
| BCLAF1 | NM_014739 | BCL2-associated transcription factor 1 | −1.39014 | 0.0012 |
| ERCC2 | AI918117 | excision repair cross-compl. rodent repair deficiency, compl. | 1.22115 | 0.0021 |
| FOXO3 | N25732 | forkhead box O3 | −1.87088 | 0.0004 |
| GSTA1 | AL096729 | Glutathione S-transferase A1 | 1.2062 | 0.0041 |
| LRPPRC | M92439 | leucine-rich PPR-motif containing | −1.95934 | 0.0015 |
| MAPK6 | NM_002748 | mitogen-activated protein kinase 6 | −1.75607 | 0.0003 |
| MAPK8IP3 | AB028989 | mitogen-activated protein kinase 8 interacting protein 3 | −2.29438 | 0.0036 |
| PDCD2 | AA764988 | programmed cell death 2 | 1.26341 | 0.0042 |
| PDCD6 | NM_013232 | programmed cell death 6 | −1.22536 | 0.0036 |
| PPM1F | D86995 | protein phosphatase 1F (PP2C domain containing) | −1.43727 | 0.0024 |
| PPP2CA | BC000400 | protein phosphatase 2 (formerly 2A), catalytic subunit, alpha | −1.84478 | 0.0003 |
| PPP2CB | NM_004156 | protein phosphatase 2 (formerly 2A), catalytic subunit, beta | −2.00412 | 0.0015 |
| PPP5C | NM_006247 | protein phosphatase 5, catalytic subunit | 1.31025 | 0.0031 |
| PRKCA | AI471375 | protein kinase C, alpha | −1.54495 | 0.0032 |
| SOD1 | NM_000454 | superoxide dismutase 1, soluble (ALS 1 adult) | −3.39997 | 0.0017 |
| SPHK2 | AA485440 | sphingosine kinase 2 | −1.76387 | 0.0039 |
| TEGT | NM_003217 | testis enhanced gene transcript (BAX inhibitor 1) | −2.12068 | 0.0031 |
| ATP5A1 | AI587323 | ATP synthase, H+ transport., mitochon. F1 complex, alpha 1 | −2.29564 | 0.001 |
| ATP5G3 | NM_001689 | ATP synthase, H+ transport., mitochon. F0 complex, subunit C3 | −2.22158 | 0.0021 |
| ATP5H | AF061735 | ATP synthase, H+ transport., mitochon. F0 complex, subunit d | −1.65063 | 0.0008 |
| ATP5J | NM_001685 | ATP synthase, H+ transport., mitochon. F0 complex, subunit F6 | −2.57595 | 0.0003 |
| ATP5L | NM_006476 | ATP synthase, H+ transporting, mitochondrial F0 complex, G | −1.33854 | 0.0025 |
| CA5A | NM_001739 | carbonic anhydrase VA, mitochondrial | 1.1286 | 0.0022 |
| COX5B | NM_001862 | cytochrome c oxidase subunit Vb | −1.85634 | 0.0013 |
| COX6C | NM_004374 | cytochrome c oxidase subunit Vic | −2.04083 | 0.0044 |
| COX7A2L | NM_004718 | cytochrome c oxidase subunit VIIa polypeptide 2 like | −2.02931 | 0.0002 |
| COX7C | NM_001867 | cytochrome c oxidase subunit VIIc | −3.00246 | 0.0007 |
| COX8A | NM_004074 | cytochrome c oxidase subunit 8A (ubiquitous) | −1.7393 | 0.0019 |
| FH | NM_000143 | fumarate hydratase | −1.37515 | 0.0021 |
| GK3P | AA292874 | glycerol kinase 3 pseudogene | 1.18797 | 0.0002 |
| GK | AJ252550 | glycerol kinase | 1.29147 | 0.0046 |
| GLS | NM_014905 | glutaminase | −6.01418 | 0.0004 |
| GPD2 | U79250 | glycerol-3-phosphate dehydrogenase 2 (mitochondrial) | 1.23037 | 0.0013 |
| HSPE1 | NM_002157 | heat shock 10kDa protein 1 (chaperonin 10) | −1.424 | 0.00003 |
| IMMT | NM_006839 | inner membrane protein, mitochondrial (mitofilin) | −2.16309 | 0.0009 |
| LARS | NM_020117 | leucyl-tRNA synthetase | 1.51549 | 0.0033 |
| LARS2 | D21851 | leucyl-tRNA synthetase 2, mitochondrial | −1.45482 | 0.0012 |
| LARS2 | D21851 | leucyl-tRNA synthetase 2, mitochondrial | −1.45482 | 0.0012 |
| MTCH1 | AF189289 | mitochondrial carrier homolog 1 (C. elegans) | −2.83831 | 0.0035 |
| MRPL15 | NM_014175 | mitochondrial ribosomal protein L15 | −1.34774 | 0.0014 |
| MRPL3 | BC003375 | mitochondrial ribosomal protein L3 | −1.98992 | 0.0009 |
| MRPL34 | AB049652 | mitochondrial ribosomal protein L34 | −1.32983 | 0.0028 |
| MRPL40 | NM_003776 | mitochondrial ribosomal protein L40 | −1.27334 | 0.0012 |
| MRPL9 | AB049636 | mitochondrial ribosomal protein L9 | 1.26286 | 0.0002 |
| NDUFA1 | NM_004541 | NADH dehydrog. (ubiquinone) 1 alpha subcomplex, 1, 7.5kDa | −2.08152 | 0.0042 |
| NDUFA4 | NM_002489 | NADH dehydrog. (ubiquinone) 1 alpha subcomplex, 4, 9kDa | −1.63321 | 0.0004 |
| NDUFA6 | NM_002490 | NADH dehydrog. (ubiquinone) 1 alpha subcomplex, 6, 14kDa | −2.4391 | 0.0013 |
| NDUFAB1 | NM_005003 | NADH dehydrogenase (ubiquinone) 1 α/β subcomplex, 1, 8kDa | −2.29908 | 0.0009 |
| NDUFB2 | NM_004546 | NADH dehydrogenase (ubiquinone) 1 beta subcomplex, 2, 8kDa | −3.70075 | 0.002 |
| NDUFB3 | NM_002491 | NADH dehydrogenase (ubiquinone) 1 beta subcomplex, 3, 12kDa | −2.43627 | 0.0023 |
| NDUFB4 | NM_004547 | NADH dehydrogenase (ubiquinone) 1 beta subcomplex, 4, 15kDa | −2.02087 | 0.0011 |
| NDUFB8 | NM_005004 | NADH dehydrogenase (ubiquinone) 1 beta subcomplex, 8, 19kDa | −7.45941 | 0.0001 |
| NDUFB11 | NM_019056 | NADH dehydrogenase (ubiquinone) 1 β subcomplex11, 17.3kDa | −1.45351 | 0.0037 |
| NDUFC1 | NM_002494 | NADH dehydrog. (ubiquinone) 1 subcomplex unknown, 1, 6kDa | −1.82726 | 0.00004 |
| NDUFS5 | NM_004552 | NADH dehydrogenase (ubiquinone) Fe-S prot. 5, 15kDa | −2.852 | 0.0029 |
| NDUFS5 | NM_004552 | NADH dehydrogenase (ubiquinone) Fe-S protein 5, 15kDa | −2.852 | 0.0029 |
| OAT | NM_000274 | ornithine aminotransferase (gyrate atrophy) | −1.76667 | 0.0005 |
| OAZ3 | AW611641 | ornithine decarboxylase antizyme 3 | 1.15114 | 0.0018 |
| ODC1 | NM_002539 | ornithine decarboxylase 1 | −1.55264 | 0.0001 |
| PCCB | NM_000532 | propionyl Coenzyme A carboxylase, beta polypeptide | −1.16783 | 0.0006 |
| SDHC | BG110532 | succinate dehydrog. complex, subunit C, int. mem. prot., 15kDa | −1.98456 | 0.0012 |
| SFXN3 | NM_030971 | sideroflexin 3 | −1.75734 | 0.0013 |
| SUMO3 | NM_006936 | SMT3 suppressor of mif two 3 homolog 3 (S. cerevisiae) | −2.68799 | 0.0002 |
| TIMM17A | AK023063 | translocase of inner mitochondrial mem. 17 homolog A (yeast) | −2.59562 | 0.0021 |
| TOMM20 | BG165094 | translocase of outer mitochondrial membrane 20 homolog (yeast) | −1.09291 | 0.0007 |
| UCRC | NM_013387 | ubiquinol-cytochrome c reductase complex (7.2 kD) | −1.94979 | 0.0004 |
| UQCRC2 | NM_003366 | ubiquinol-cytochrome c reductase core protein II | 1.18331 | 0.001 |
| UQCRH | NM_006004 | ubiquinol-cytochrome c reductase hinge protein | −2.87814 | 0.0001 |
Mitochondrial dysfunction and protein degradation
Inhibition of mitochondrial function and the impairment of the UPS have long been linked to Parkinson's disease pathology and are part of the intrinsic mechanisms of PCD (Bredesen et al., 2006; Gomez et al., 2007). Mitochondrial dysfunction is mainly characterized by the generation of reactive oxygen species (ROS), a decrease of mitochondrial complex I activity, cytochrome-c release, ATP depletion and caspase 3 activation. We found differential expression of multiple genes related to these signaling cascades (Table 3) and consistent with other results, downregulation was more prominent confirming reduced mitochondrial activity in Parkinson's disease (Duke et al., 2006). For example, there was downregulation of superoxide dismutase 1 (SOD1) and upregulation of glutathione S-transferase A1 (GSTA1), which are both implicated in protecting cells from ROS and the products of peroxidation (Raza et al., 2002; Martin et al., 2007), though SOD1 has recently also been shown to increase the production of toxic ROS in the intermembrane space of mitochondria (Goldsteins et al., 2008). The expression of several cytochrome c oxidase subunits was also markedly decreased as well as NADH dehydrogenase subunits and the mitochondrial mRNA-binding protein LRPPRC (Mootha et al., 2003).
Together with lysosomes, the UPS is part of the proteolytic machinery to degrade misfolded, damaged proteins, or proteins with an abnormal amino acid sequence. Defects in the proteolytic systems lead to accumulation and organization of cellular aggregates, such as Lewy bodies in the Parkinson's disease DA neurons (Olanow and McNaught, 2006). Our data demonstrate downregulation of gene clusters linked to ubiquitination (including the PARK genes HIP2, UCHL-1 and RAP1GA1, see above), chaperone function (e.g. heat shock and associated proteins), and subunits of the proteasome (Table 4). In this context, we also found decreased expression of ST13, a cofactor of heat-shock protein 70 (HSP70) that stabilizes its chaperone activity.
Table 4.
Genes associated with protein degradation
| Gene symbol | GenBank ID | Description | Fold change | P-value |
|---|---|---|---|---|
| SNCA | BG260394 | synuclein, alpha | −1.859 | 0.0003 |
| ATP13A2 | NM_022089 | ATPase type 13A2 | −1.378 | 0.0043 |
| HSF1 | NM_005526 | heat shock transcription factor 1 | −1.4953 | 0.0005 |
| HSF2BP | NM_007031 | heat shock transcription factor 2 binding protein | 1.23959 | 0.0003 |
| HSP90AA1 | R01140 | heat shock protein 90kDa alpha (cytosolic), class A member 1 | −5.8721 | 0.0026 |
| HSPA8 | AA704004 | heat shock 70kDa protein 8 | −2.3571 | 0.0033 |
| HSPE1 | NM_002157 | heat shock 10kDa protein 1 (chaperonin 10) | −1.424 | 0.00003 |
| HSPH1 | NM_006644 | heat shock 105kDa/110kDa protein 1 | −1.5953 | 0.0038 |
| DNAJC4 | NM_005528 | DnaJ (Hsp40) homolog, subfamily C, member 4 | 1.15186 | 0.0046 |
| DNAJC7 | NM_003315 | DnaJ (Hsp40) homolog, subfamily C, member 7 | −1.80219 | 0.0002 |
| UBB | NM_018955 | ubiquitin B | −5.9404 | 0.002 |
| UBE1C | AL117566 | ubiquitin-activating enzyme E1C (UBA3 homolog, yeast) | −1.86447 | 0.0012 |
| UBE2E1 | AL518159 | ubiquitin-conjugating enzyme E2E 1 (UBC4/5 homolog, yeast) | −2.05043 | 0.0012 |
| UBE3B | AL096740 | ubiquitin protein ligase E3B | 1.16931 | 0.0043 |
| USP10 | BC000263 | ubiquitin specific peptidase 10 | 1.29572 | 0.0028 |
| USP34 | AB018272 | ubiquitin specific peptidase 34 | −1.9483 | 0.0032 |
| USP34 | AW502434 | ubiquitin specific peptidase 34 | 1.20076 | 0.000008 |
| USP47 | BE966019 | ubiquitin specific peptidase 47 | −2.4653 | 0.0024 |
| UCHL1 | NM_004181 | ubiquitin carboxyl-terminal esterase L1 | −1.9442 | 0.004 |
| UBA52 | AF348700 | ubiquitin A-52 residue ribosomal protein fusion product 1 | −2.1443 | 0.0045 |
| SCRN1 | NM_014766 | secernin 1 | −2.09163 | 0.0017 |
| CPE | NM_001873 | carboxypeptidase E | −2.75212 | 0.0016 |
| DNPEP | NM_012100 | aspartyl aminopeptidase | −1.0922 | 0.0006 |
| ADAMDEC1 | NM_014479 | ADAM-like, decysin 1 | 1.17513 | 0.00009 |
| PSEN2 | U34349 | presenilin 2 (Alzheimer disease 4) | −2.53079 | 0.0009 |
| HIP2 | NM_005339 | huntingtin interacting protein 2 (ubiquitin-conjugating enzyme) | −1.2217 | 0.0021 |
| PSMB4 | NM_002796 | proteasome (prosome, macropain) subunit, beta type, 4 | −2.3662 | 0.0046 |
| PSMB5 | BC004146 | proteasome (prosome, macropain) subunit, beta type, 5 | −1.5774 | 0.0009 |
| PSMC3 | AL545523 | proteasome (prosome, macropain) 26S subunit, ATPase, 3 | 1.1355 | 0.0013 |
| PSMD4 | NM_002810 | proteasome (prosome, macropain) 26S subunit, non-ATPase, 4 | −2.2385 | 0.000009 |
| PSMC3IP | NM_013290 | PSMC3 interacting protein | 1.17677 | 0.0033 |
| SUMO3 | NM_006936 | SMT3 suppressor of mif two 3 homolog 3 (S. cerevisiae) | −2.68799 | 0.0002 |
| AP3B2 | NM_004644 | adaptor-related protein complex 3, beta 2 subunit | 1.24563 | 0.0031 |
| AP4E1 | AB030653 | adaptor-related protein complex 4, epsilon 1 subunit | 1.12576 | 0.0012 |
| AP4S1 | BC001259 | adaptor-related protein complex 4, sigma 1 subunit | 1.31131 | 0.0034 |
| HSPC152 | NM_016404 | hypothetical protein HSPC152 | −1.9457 | 0.001 |
| GULP1 | AK023668 | GULP, engulfment adaptor PTB domain containing 1 | 1.18592 | 0.0014 |
| ZFYVE9 | NM_007323 | zinc finger, FYVE domain containing 9 | 1.45751 | 0.0003 |
| ATP6V0A1 | AL096733 | ATPase, H+ transporting, lysosomal V0 subunit a1 | −1.90086 | 0.001 |
| ATP6V0A2 | AW444520 | ATPase, H+ transporting, lysosomal V0 subunit a2 | 1.34269 | 0.0038 |
| ATP6V1E1 | BC004443 | ATPase, H+ transporting, lysosomal 31kDa, V1 subunit E1 | −3.69945 | 0.0004 |
Synaptic dysfunction
There was a number of deregulated genes which are involved in synaptic function and altogether there was more down- than upregulation (Table 5). In particular, expression of synaptogyrin 3 (SYNGR3) and NSF was diminished, which has also been described in a MPTP mouse model of Parkinson's disease (Miller et al., 2004). In contrast to Miller and Federoff (Miller and Federoff, 2005), we did not detect a down-regulation of the DAT-binding protein syntaxin-1A (Lee et al., 2004). However, we found down-regulation of the GABA transporter member 1 (SLC6A1), GABA receptor beta subunit 1 (GABRB1) and the GABA receptor-associated proteins (GABARAPL) 1, 2 and 3 (Table 6).
Table 5.
Genes associated with synaptic function
| Gene symbol | GenBank ID | Description | Fold change | P-value |
|---|---|---|---|---|
| Transport of peptide-containing vesicles to neuron terminal | ||||
| KIF5B | BF223224 | kinesin family member 5B | −1.59355 | 0.0041 |
| KIF5C | NM_004522 | kinesin family member 5C | −4.92852 | 0.0003 |
| KIF4A | NM_012310 | kinesin family member 4A | 1.15103 | 0.0013 |
| Vesicle reserve pool maintanance and vesicle mobilization | ||||
| SYN1 | H19843 | synapsin I | −1.66303 | 0.0004 |
| ABLIM3 | NM_014945 | actin binding LIM protein family, member 3 | −1.35052 | 0.00007 |
| Docking | ||||
| GTPBP4 | NM_012341 | GTP binding protein 4 | −1.53253 | 0.003 |
| Priming | ||||
| NSF | NM_006178 | N-ethylmaleimide-sensitive factor | −3.23079 | 0.0003 |
| SV2A | NM_014849 | synaptic vesicle glycoprotein 2A | −2.44187 | 0.0018 |
| SV2B | NM_014848 | synaptic vesicle glycoprotein 2B | −2.94679 | 0.0002 |
| SNPH | NM_014723 | syntaphilin | −1.45497 | 0.0008 |
| RIMS1 | AF263310 | regulating synaptic membrane exocytosis 1 | 1.22118 | 0.0014 |
| RIMS3 | NM_014747 | regulating synaptic membrane exocytosis 3 | −2.88055 | 0.0013 |
| CADPS | NM_003716 | Ca2+-dependent secretion activator | −1.47948 | 0.0016 |
| Fusion | ||||
| SYT1 | AV731490 | synaptotagmin I | −4.13271 | 0.0026 |
| SYT12 | AK024381 | synaptotagmin XII | 1.31759 | 0.0039 |
| Coating | ||||
| CLTA | NM_001833 | clathrin, light chain (Lca) | −1.75741 | 0.0016 |
| CLTC | NM_004859 | clathrin, heavy chain (Hc) | −4.10273 | 0.0001 |
| SNPH | NM_014723 | syntaphilin | −1.45497 | 0.0008 |
| Budding | ||||
| DNM1 | AF035321 | dynamin 1 | −5.37261 | 0.0031 |
| DNM2 | NM_004945 | dynamin 2 | −1.20722 | 0.0039 |
| SYNJ2 | AK026758 | synaptojanin 2 | 1.31697 | 0.0022 |
| Synaptic vesicle surface proteins | ||||
| SCAMP1 | NM_004866 | secretory carrier membrane protein 1 | 1.29675 | 0.0023 |
| STX8 | NM_004853 | syntaxin 8 | −1.34458 | 0.0012 |
| SYT1 | AV731490 | synaptotagmin I | −4.13271 | 0.0026 |
| SYP | U93305 | synaptophysin | −1.6632 | 0.0015 |
| VAMP4 | NM_003762 | vesicle-associated membrane protein 4 | 1.19224 | 0.002 |
| SYN1 | H19843 | synapsin I | −1.66303 | 0.0004 |
| VAMP8 | NM_003761 | vesicle-associated membrane protein 8 | 1.1353 | 0.0017 |
| Proteins involved in synaptic plasticity | ||||
| SYNGR3 | NM_004209 | synaptogyrin 3 | −4.14138 | 0.0009 |
| SNCA | BG260394 | synuclein, alpha | −1.85899 | 0.0003 |
| Cytoskeleton | ||||
| TUBA1A | AF141347 | tubulin, alpha 1a | −6.37157 | 0.0017 |
| TUBB | BC005838 | tubulin, beta | −1.72028 | 0.002 |
| TUBB2A | NM_001069 | tubulin, beta 2A | −11.845 | 0.0009 |
| TUBB2B | AL533838 | tubulin, beta 2B | −3.78621 | 0.0018 |
| TUBB2C | AA515698 | tubulin, beta 2C | −3.04285 | 0.0011 |
| TUBB2C | BC004188 | tubulin, beta 2C | −2.38572 | 0.001 |
| TUBB3 | NM_006086 | tubulin, beta 3 | −3.84889 | 0.00003 |
| TUBD1 | BC000258 | tubulin, delta 1 | 1.32677 | 0.0008 |
| DYNC1I1 | NM_004411 | dynein, cytoplasmic 1, intermediate chain 1 | −3.30122 | 0.0033 |
| DYNLL1 | NM_003746 | dynein, light chain, LC8-type 1 | −2.84963 | 0.00006 |
| DYNLRB1 | NM_014183 | dynein, light chain, roadblock-type 1 | −1.86594 | 0.0045 |
Table 6.
Growth factors, receptors and ion-channels
| Gene symbol | GenBank ID | Description | Fold change | P-value |
|---|---|---|---|---|
| Growth factor—related transcripts | ||||
| CTGF | M92934 | connective tissue growth factor | 1.209 | 0.0029 |
| TGFBR3 | NM_003243 | transforming growth factor, beta receptor III | 1.252 | 0.0005 |
| NFATC1 | U08015 | nuclear factor of activated T-cells, cytoplasmic, calcineurin-dependent 1 | 1.386 | 0.0029 |
| NFATC2IP | AA152202 | nuclear factor of activated T-cells, cytoplasmic, calcineurin-dependent 2 | 1.186 | 0.0023 |
| NFKBIL2 | NM_013432 | nuclear factor of kappa light polypeptide gene enhancer in B-cells | 1.149 | 0.0014 |
| NFRKB | NM_006165 | nuclear factor related to kappaB binding protein | 1.1916 | 0.0037 |
| NFRKB | AI887378 | nuclear factor related to kappaB binding protein | 1.3201 | 0.0016 |
| NGFR | NM_002507 | nerve growth factor receptor (TNFR superfamily, member 16) | 1.21 | 0.0006 |
| NGFRAP1 | NM_014380 | nerve growth factor receptor (TNFRSF16) associated protein 1 | −4.31 | 0.0004 |
| TDGF1/3 | NM_003212 | teratocarcinoma-derived growth factor 1/3 | 1.704 | 0.0018 |
| GDF3 | NM_020634 | growth differentiation factor 3 | 1.263 | 0.003 |
| FGF21 | NM_019113 | fibroblast growth factor 21 | 1.084 | 0.0037 |
| FGF23 | NM_020638 | fibroblast growth factor 23 | 1.334 | 0.00003 |
| FGFR2 | M87771 | fibroblast growth factor receptor 2 | 1.146 | 0.0025 |
| GFRA2 | U97145 | GDNF family receptor alpha 2 | 1.273 | 0.0014 |
| PIK3C2G | AJ000008 | phosphoinositide-3-kinase, class 2, gamma polypeptide | 1.28471 | 0.0012 |
| PIK3R1 | AI680192 | phosphoinositide-3-kinase, regulatory subunit 1 (p85 alpha) | −1.75559 | 0.0037 |
| PIK3R2 | NM_005027 | phosphoinositide-3-kinase, regulatory subunit 2 (p85 beta) | 1.39538 | 0.0004 |
| Neurotransmitter—related transcripts | ||||
| GABRB1 | NM_000812 | gamma-aminobutyric acid (GABA) A receptor, beta 1 | −2.95 | 0.0037 |
| GABARAPL1/3 | AF180519 | GABA(A) receptor-associated protein like 1 | −4.16 | 0.001 |
| GABARAPL2 | AB030710 | GABA(A) receptor-associated protein-like 2 | −1.53 | 0.0012 |
| GRIN2B | U90278 | glutamate receptor, ionotropic, N-methyl D-aspartate 2B | 1.267 | 0.0005 |
| GRM7 | X94552 | glutamate receptor, metabotropic 7 | 1.23274 | 0.0014 |
| DRD1 | X58987 | dopamine receptor D1 | 1.24 | 0.0045 |
| HTR1F | NM_000866 | 5-hydroxytryptamine (serotonin) receptor 1F | 1.169 | 0.0044 |
| CHRNA4 | L35901 | cholinergic receptor, nicotinic, alpha 4 | 1.29101 | 0.0028 |
| CHRNB2 | NM_000748 | cholinergic receptor, nicotinic, beta 2 (neuronal) | 1.31787 | 0.0018 |
| SSTR4 | NM_001052 | somatostatin receptor 4 | 1.17716 | 0.0019 |
| Ion channel—related transcripts | ||||
| KCNA10 | NM_005549 | potassium voltage-gated channel, shaker-related subfamily 10 | 1.20794 | 0.001 |
| KCNJ6 | U24660 | potassium inwardly-rectifying channel, subfamily J, member 6 | −1.50387 | 0.0034 |
| KCNK1 | U90065 | potassium channel, subfamily K, member 1 | 1.18089 | 0.0029 |
| KCMF1 | NM_020122 | potassium channel modulatory factor 1 | −2.09577 | 0.0021 |
| SCN3B | AB032984 | sodium channel, voltage-gated, type III, beta | −1.45019 | 0.0028 |
| SCN7A | NM_002976 | sodium channel, voltage-gated, type VII, alpha | 1.17227 | 0.0004 |
| CACNB3 | U07139 | calcium channel, voltage-dependent, beta 3 subunit | −2.69693 | 0.0036 |
| CLCNKA/KB | NM_004070 | chloride channel Ka/chloride channel Kb | 1.41945 | 0.004 |
| ATP13A2 | NM_022089 | ATPase type 13A2 | −1.37797 | 0.0043 |
| ATP1B1 | NM_001677 | ATPase, Na+/K+ transporting, beta 1 polypeptide | −4.96066 | 0.0004 |
| ATP2A3 | Y15724 | ATPase, Ca++ transporting, ubiquitous | −1.59098 | 0.0009 |
| ATP2B2 | R52647 | ATPase, Ca++ transporting, plasma membrane 2 | −1.58811 | 0.0018 |
| ATP2C1 | AF189723 | ATPase, Ca++ transporting, type 2C, member 1 | −1.31686 | 0.0005 |
| SLC6A1 | AI003579 | solute carrier family 6 (GABA), member 1 | −1.67856 | 0.0008 |
| SLC6A2 | AB022847 | solute carrier family 6 (noradrenalin), member 2 | 1.23318 | 0.0033 |
| SLC11A2 | AF046997 | solute carrier family 11 (prot-coupled divalent metal ion transporters) | 1.18662 | 0.0031 |
| SLC16A3 | AL513917 | solute carrier family 16, 3 (monocarboxylic acid transporter 4) | 1.15939 | 0.0007 |
| SLC22A17 | NM_020372 | solute carrier family 22 (organic cation transporter), member 17 | −1.87688 | 0.0021 |
| SLC24A2 | NM_020344 | solute carrier family 24 (Na/K/Ca exchanger), member 2 | 1.18826 | 0.0025 |
| SLC24A3 | NM_020689 | solute carrier family 24 (Na/K/Ca exchanger), member 3 | −1.30668 | 0.0017 |
| SLC24A6 | NM_024959 | solute carrier family 24 (Na/K/Ca exchanger), member 6 | 1.36345 | 0.0014 |
| SLC34A1 | NM_003052 | solute carrier family 34 (sodium phosphate), member 1 | 1.23666 | 0.0043 |
| SLC35A1 | NM_006416 | solute carrier family 35 (CMP-sialic acid transporter), member A1 | −1.54345 | 0.0001 |
| SLC39A6 | AI635449 | solute carrier family 39 (zinc transporter), member 6 | −2.55873 | 0.0019 |
| SLC43A3 | AI630178 | solute carrier family 43, member 3 | 1.29524 | 0.0006 |
DA phenotype, survival and cytoskeleton
Interestingly, from the 1046 genes in our data set none of the ‘classical’ DA neuron-associated genes were significantly deregulated (e.g. TH, AADC, DAT, EN-1, NURR1), although there was a trend for reduced expression of TH and DAT by qRT-PCR (see below). We noticed an upregulation of a cluster of genes linked to cell survival (Table 6) indicating the activation of compensatory mechanisms in response to cell stress. These genes comprise mitogen-activated protein kinases (MAP3K3, MAP6, MAPK8IP3), growth factors (FGF21 and 23, GDF3, TDGF1/3), growth factor receptors and associated proteins (FGFR2, TGFBR3, NGFR, GFRA2, TNFRSF16, GDF3, DRD1, VDR), and other ion or neurotransmitter receptors (discussed separately below). In addition, there was downregulation of genes related to cytoskeletal maintenance (Table 5), e.g. dyneins, which are involved in the trafficking of cellular components, transport of organelles, cell–cell contact and cytoskeletal stability via interaction with β-catenins and microtubules. Strikingly, we found deregulation of microtubulin-associated genes like MAPT, MAPRE1, TCP1 [which take part in unfolding translated proteins in the cytosol, such as actin and tubulin (Stirling et al., 2007)] and multiple subunits of tubulin (Table 5), but not microtubule affinity regulating kinase (MARK1) and microtubule-associated protein (MAP2) as described elsewhere (Miller et al., 2006; Moran et al., 2007).
Ion channels and neurotransmitter receptors
Over the past years, there has been emerging evidence that survival of DA neurons depends on their unique properties of electrical activity involving Na+, K+ and Ca2+ channels and the association of mitochondrial dysfunction and ROS production with K+ and Ca2+ channel activation has been suspected as a major contributor to Parkinson's disease pathogenesis (Michel et al., 2007; Surmeier, 2007). Many molecules related to these mechanisms are dysregulated in our data set (Table 6). For example, there was striking downregulation of the Na+/K+-ATPase carrier protein (ATP1B1), which is involved in actively pumping Na+ out of and K+ into the cell plasma to maintain their electrochemical gradients. Another downregulated gene was the G protein-gated inwardly rectifying K+ channel 2 (GIRK2 or KCNJ6), which is predominantly expressed in the SNc DA neurons and has been implicated in Parkinson's disease (Kobayashi and Ikeda, 2006). In addition, the calcium channel subunit β3 (CACNB3), ATPase type 13A2 (PARK9, Table 2) and several subunits of Ca2+ transporting ATPases (ATP2A3, ATP2B2, ATP2C1) were downregulated further substantiating a deficit in organelle function and Ca2+ sequestering. Finally, our data demonstrate an upregulation of the glutamate receptors GRIN2B and GRM7 and the nicotinic cholinergic receptors α4 and β2 (CHRNA4, CHRNB2) (Table 6), which is consistent with the notion that NMDA and nicotinic acetylcholine (ACh) receptors contribute to DA neuronal survival (reviewed in Michel et al., 2007).
Validation of microarray data by TaqMan®-based real-time PCR
To validate the results from the microarray assays, we additionally performed TaqMan®-based real-time PCR on laser-microdissected cells from two new control and one new Parkinson's disease brain as well as control brain C3 and Parkinson's disease brains PD3 and PD4, which were used for the microarray analysis (Table 1). We selected the DA neuronal-specific genes tyrosine hydroxylase (TH), dopamine transporter (DAT or SNC6A3) and Girk2 (KCNJ6) (Table 6) and all PARK genes including LRKK2, which was not present on the HG-U133A Affymetrix chip. Using the 2−ΔΔCt method to determine fold differences of relative gene expression in Parkinson's disease versus control samples (Livak and Schmittgen, 2001; Schmittgen and Livak, 2008), the real-time PCR experiments largely confirmed the results from the microarrays (Fig. 1). However, we also observed high variability between samples, which prompted us to additionally analyse our results by comparing relative gene expression of individual genes using the 2−ΔCt method (Livak and Schmittgen, 2001; Schmittgen and Livak, 2008) for the real-time PCR assays and Z-scores for the microarrays after removal of batch effects (Supplementary Fig. S3). Although these data showed considerable variability of gene expression levels within each sample (Supplementary Fig. S3A) and across the sample population (Supplementary Fig. S3B), there was an overall consistency between both methodologies demonstrating a broad downregulation of PARK genes and, to some extent, also of TH and DAT in the PCR assays. The latter, however, did not reach significance in the microarrays using three-way ANOVA at FDR10%.
Figure 1.

Validation of gene expression using TaqMan® real-time PCR on three control and three Parkinson's disease samples (Table 1). The following genes were selected: tyrosine hydroxylase (TH), dopamine transporter (DAT), Girk2 (KCNJ6), SNCA (PARK1), Parkin (PARK2), UCHL1 and HIP2 (PARK5), PINK1 (PARK6), DJ-1 (PARK7), LRRK2 (PARK8), ATP12A2 (PARK9), RAP1GA1, RIMS1 and 3 (PARK10). Data analysis was based on the 2−ΔΔCt method (Livak and Schmittgen, 2001; Schmittgen and Livak, 2008) and results were plotted as fold differences of relative gene expression normalized to controls.
Discussion
Studying Parkinson's disease pathogenesis using microarray technology
Multiple microarray studies have compared the gene expression profiles of cells within the midbrain of normal controls with those from Parkinson's disease brains (Grunblatt et al., 2004; Hauser et al., 2005; Zhang et al., 2005; Duke et al., 2006; Miller et al., 2006; Moran et al., 2006, 2007; Moran and Graeber, 2008). These studies were based on sections encompassing substantia nigra as well as other adjacent regions such as striatum and thalamus, and therefore, contained a large amount of cells other than DA neurons. Consequently, microarray analyses on dissected tissue revealed a global set of genes that are dysregulated in Parkinson's disease, which is in agreement with an increasing conceptual view that not only the DA neurons, but also other cells within the substantia nigra and adjacent brain regions are involved in Parkinson's disease pathology (summarized in Duke et al., 2006). Altogether, these studies confirmed several cellular functions that are affected in Parkinson's disease, such as the UPS and the mitochondrial system, synapse function, DA phenotype, and cytoskeletal maintenance pointing to defects in cell communication, survival and axonal transport (Duke et al., 2006; Miller et al., 2006). However, they do not provide gene expression of single DA neurons. So far, three groups reported expression profiling on directly targeted DA neurons by laser microscopy (Lu et al., 2004, 2006; Cantuti-Castelvetri et al., 2007; Grundemann et al., 2008). Two of these groups used laser capture microscopy (LCM) with an Arcturus PixCell II instrument after quick immunostaining or ethanol fixation and methylene blue staining of the dissected midbrain tissue. This differs from our and Grundemann et al.'s approach, in which LMD was performed on unprocessed freshly cut sections and the DA neurons visualized by their neuromelanin content. In addition, the LMD-isolated neurons fell by gravity into collection tubes, in contrast to fixation of the cells on the slide matrix by LCM. We attempted to compare our results with the microarray data published by (Cantuti-Castelvetri et al., 2007), but unfortunately in this study a different Affymetrix platform with a different probe set (U133_X3P) was used (http://www.ebi.ac.uk/microarray-as/ae/). Based on our analysis criteria (three-way ANOVA, FDR10), we were not able to retrieve differential gene expression profiles as seen in our study.
It should be noted that an important parameter in the interpretation of the LMD-based microarray data refers to the integrity and status of the isolated cells. Especially downregulation of gene expression could be a result of neuronal death that is not necessarily related to a dysfunction of pathways associated with Parkinson's disease pathogenesis. Therefore, it should be emphasized that gene expression in this study should be viewed in the context of biological function and—when deregulated—in relation to a possible role in pathogenic processes that are linked to Parkinson's disease.
Deregulated gene expression as indicator for dysfunctional cellular pathways in Parkinson's disease
PARK genes
PARK proteins are associated with familial forms of Parkinson's disease and their functions have been linked to all major pathways related to Parkinson's disease pathogenesis including mitochondrial and synaptic dysfunction, protein degradation, PCD and cell survival (Moran et al., 2007; Olanow, 2007; Thomas and Beal, 2007; Burke, 2008; Schiesling et al., 2008). Although there is evidence that both forms of Parkinson's disease share common pathogenic mechanisms, it is still unclear if, and to what extent, the familial-linked PARK proteins are involved in the sporadic illness. Our data show a striking downregulation of most of the PARK genes. Since PARK1, RIMS1 and RIMS3 are involved in vesicular function, PARK2, PARK5 and RAP1GA1 with the UPS, PARK6 in mitochondrial function, PARK7 in intrinsic pathways of PCD, and PARK8 in cytoskeletal process regulation, it appears that a deregulation of these molecules might also contribute to the pathogenesis of sporadic Parkinson's disease. Thus, our data could support the view that the PARK genes might present a significant group of key factors in common pathogenetic mechanisms of both forms of Parkinson's disease (Moran et al., 2007; Thomas and Beal, 2007; Burke, 2008; Schiesling et al., 2008).
Cellular pathways involved in Parkinson's disease pathogenesis
Multiple cellular pathways have been associated with Parkinson's disease pathogenesis and one of the key mechanisms relates to processes involved in PCD. These comprise a large subset of molecules that also include some of the PARK genes, such as PARKIN, PINK1 and DJ-1 (Tatton et al., 2003; Burke, 2007, 2008; Moran et al., 2007; Olanow, 2007; Singh and Dikshit, 2007; Schiesling et al., 2008). Many of the functional aspects of these molecules stem from experimental models of Parkinson's disease and have been extensively summarized elsewhere (e.g. Olanow, 2007; Singh and Dikshit, 2007; Burke, 2008). However, there is only very little information available from Parkinson's disease patient's material other than rather controversial and mixed results from morphologic assessments (Tatton et al., 2003; Burke, 2007, 2008). Our data show a set of deregulated genes that are directly or indirectly involved in PCD confirming the current concept of apoptotic cell death of the DA neuron. Particularly interesting is the observed upregulation of genes involved in extrinsic PCD, because there have been several observations on postmortem brain tissue suggesting a role of TNF-α and FAS signalling in the neurodegeneration of Parkinson's disease (Boka et al., 1994; Mogi et al., 1996; Ferrer et al., 2000; Hartmann et al., 2001, 2002; Burke, 2007). In addition, our data show a dysfunction of both the mitochondria and the UPS, which are major contributors to PCD and Parkinson's disease pathogenesis (Duke et al., 2006). This included multiple cytochrome c oxidase and NADH dehydrogenase subunits that have been recently associated with impaired mitochondrial function in pesticide-induced Parkinson's disease (Gomez et al., 2007). Interestingly, there was a decrease of LRPPRC expression, a gene linked to the mitochondrial neurodegenerative disorder French-Canadian-type Leigh syndrome, which is caused by defects in oxidative phosphorylation (Mootha et al., 2003) and ST13, which is part of a number of marker genes (including HIP2) that have been proposed as possible biomarkers in Parkinson's disease (Scherzer et al., 2007). It should be noted that SNCA, a component of Lewy bodies, whose pathologic accumulation is caused by oxidative stress, mitochondrial dysfunction and impairment of cellular proteolytic mechanisms (Lundvig et al., 2005) was also deregulated.
There were several deregulated genes pointing to impairment of synaptic function and plasticity and some of these genes were also observed in other studies, such as SYNGR3, NSF, SV2B, SYN1, SYT1 and dynamin (Miller et al., 2006). The deregulated genes in our study belong to important mechanisms involved in maintaining synaptic function and integrity, such as a number of proteins from the SNARE complex (priming of the synaptic vesicle and synaptic vesicle surface proteins) that play a role in vesicle binding and fusion to the plasma membrane (Brunger, 2005). Other downregulated genes encode the GTPase family-associated molecules dynamin 1 and 2, which are involved in severing nascent vesicles from the membrane, receptor-mediated endocytosis, trafficking in and out of the Golgi apparatus, maintenance of mitochondrial morphology and mitochondrial-associated pathways of apoptosis (Scorrano, 2007; Ungewickell and Hinrichsen, 2007). In addition, there was striking down-regulation of genes related to cytoskeletal maintenance including MAP kinases, tubulins and dyneins, while several growth factor receptor and their signalling-associated genes were upregulated. We also found downregulation of GABA receptor and signalling-related genes supporting the previous suggestion that GABAergic synapses are reduced in the substantia nigra of Parkinson's disease resulting in a reduction of DA neuron inhibition and an increase in neurotransmission and function of the remaining functional DA neurons (see below) (Miller and Federoff, 2005). Altogether our results are consistent with other observations pointing to a functional disconnect of the striatonigral trophic signalling pathways (Miller et al., 2006).
Our data also support evidence from other investigators suggesting that survival of DA neurons depends on their unique properties of electrical activity involving Na+, K+ and Ca2+ channels. For example, Michel et al. proposed a mechanism in which the dysfunctional mitochondria and ROS trigger adenosine triphosphate-sensitive K+ (KATP) channel-mediated hyperpolarization of substantia nigra DA neurons, which renders them susceptible to degeneration (Michel et al., 2007). We found a striking downregulation of the Na+/K+-ATPase carrier protein (ATP1B1) that is involved in actively pumping Na+ out of and K+ into the cell plasma to maintain their electrochemical gradient. Mutation in this gene causes rapid-onset dystonia Parkinsonism (de Carvalho Aguiar et al., 2004). It should be noted that SOD (or SOD mimetics) can abolish the K+-mediated hyperpolarization by inhibiting ROS formation (Liss et al., 2005) and expression of SOD was markedly downregulated in our data. Also, there was downregulation of GIRK2 expression, which can cause permanent depolarization and loss of spontaneous pacemaker activity and, thus, contributes to cell death (Liss et al., 2005). Other receptors that have been implicated in the long-term survival of DA neurons are L-type Ca2+ channels, which drive their pace-making activity by sustaining low intracellular Ca2+ concentrations that are sequestered by the ER and mitochondria using ATP-dependent transporters (Surmeier, 2007). These energy-consuming processes require oxidative phosphorylation, a prominent feature of DA neurons. In combination with the generation of ROS and consecutive mitochondrial DNA damage this high metabolic rate might accelerate their ageing—including dysfunctional proteins that are directly or indirectly involved in these processes, e.g. some of the PARK genes including ATPase type 13A2 (Surmeier, 2007). Our data show a reduction in multiple calcium channel subunits including ATPase type 13A2 (PARK9) and several subunits of Ca2+ transporting ATPases adding to the overall picture of an imbalanced Ca2+ homeostasis of the Parkinson's disease DA neuron. Finally, neurotransmitters have also been implicated in the survival of DA neurons (reviewed in Michel et al., 2007). NMDA receptors seem to be involved in controlling their burst-firing mode and enhance the survival promoting effect of BDNF. However, there is also evidence that they contribute to degeneration through an excitotoxic process. Nicotinic ACh receptors protect DA neurons in vitro and in vivo against MPTP or 6-OHDA toxicity and their effects are attributed to a reduction of glutamate-meditated excitotoxicity, upregulation of trophic factors, or a rise in intracellular Ca2+ (see above). This is particularly interesting, since the ACh receptors α7, α4 and β2 have strong depolarizing activity on DA neurons consisting with the view that modulation of their excitability might support survival (Matsubayashi et al., 2004; Quik et al., 2007). Taken together, the upregulation of glutamate nicotinic cholinergic receptors in our data set contributes to the interpretation that compensatory survival mechanisms are activated in response to cell stress mediated by PCD, protein degradation, mitochondrial and synaptic dysfunction.
Insights into Parkinson's disease pathogenesis through a ‘molecular fingerprint’ identity of the parkinsonian DA neuron
Miller and Federoff postulated a model for common pathways of Parkinson's disease pathogenesis based on microarray data collection (Miller and Federoff, 2005). This model encompasses several genes that are involved in the function or dysfunction of DA neurons in Parkinson's disease model systems and postmortem brain analyses from Parkinson's disease patients. Downregulated genes are related to the DA phenotype, synaptic function, cytoskeletal stability and axonal transport, while upregulated genes refer to metabolism, protein disposal and inflammation. Among the postulated genes, we found no significant down- or upregulation of DAT, AADC, EN1, MARK-1, MAP2, DSCR1L1, HK1, ZFP162 and UNC-5. However, and also consistent with other reports, there was a downregulation of SYNGR3 (Miller and Federoff, 2005), Synaptotagmin 1 (SYT1) (Zhang et al., 2005; Moran et al., 2006), N-ethylmaleimide-sensitive factor (NSF) (Miller and Federoff, 2005; Zhang et al., 2005), UCHL-1 (Moran et al., 2007), kinesin family members (KIF5B and KIF5C) (Miller et al., 2006), and dynein-related genes (DYNC1I1, DYNLL1 and DYNLRB1) (Miller and Federoff, 2005). Although several of these genes are linked to pathways in DA pathogenesis (see above), we could not confirm the six genes in the Miller and Federoff study (Miller and Federoff, 2005), which are postulated as a highly conserved dysregulation in the three Parkinson's disease systems analysed (i.e. DAT, EN-1, HK-1, DSCR1L1, ZFP 162 and UNC-5). Given that many of their cellular functions in DA neurons are currently unknown (except of DAT and EN-1) further studies will be needed to confirm their direct or indirect involvement in Parkinson's disease pathology.
A recent publication by Moran and Graeber (2008) provided an extensive pathways analysis based on 892 dysregulated priority genes from a Parkinson's disease substantia nigra microarray data set. The authors concluded that Parkinson's disease has biological associations with cancer, diabetes, and inflammation. In addition, this study revealed prominent changes in similar cell function and disease pathways evident from our data, such as apoptosis, cell survival, cytoskeleton, signal transduction, synaptic and mitochondrial function, protein degradation and networks that are directly linked to Parkinson's disease-associated genes. These investigators also found a strong association with inflammation and, interestingly, a cluster of upregulated genes related to functions of the immune system are also present in our data set (Supplementary Table 3S). This might add further evidence to an involvement of inflammatory processes in the disease development of Parkinson's disease (Whitton, 2007). Altogether, comparison of our results with the data from these and other investigators as discussed above suggests that there are two major classes of factors involved in Parkinson's disease pathogenesis:
A core of highly conserved primary (priority) factors that are major players of key pathways in the function of the substantia nigra DA neuronal phenotype; and
Secondary factors that are directly or indirectly affected by (or effect) the dysfunction of the primary molecules. Dysregulation of molecules from both classes contribute to Parkinson's disease.
It is important to emphasize that mRNA data reveal information about transcriptional activation of genes, but do not tell much about actual protein levels and function. In addition, array data cannot predict if deregulated gene expression is a primary or a secondary effect of cell function. For example, a gene could be down- or upregulated by factors, such as miRNAs or transcriptional activators (or inhibitors) independent of its protein function and/or as a consequence of positive and negative feedback loops. Moreover, protein function relies on the interaction of down- and upstream factors within a pathway, i.e. downstream factors are more dependent on upstream signalling than upstream factors, which might influence a cascade of downstream events that can include multiple pathways. Thus, the consequences of deregulated gene expression are on multiple levels within a complex and dynamic interplay of factors and mechanisms. Lasermicroscopy-based microarray studies can only reveal a ‘snap-shot’ of these events. Nevertheless, our study shows that many genes associated with Parkinson's disease pathogenesis are deregulated in single captured postmortem DA neurons. This could provide a ‘molecular fingerprint identity’ of a late stage DA neuron affected by sporadic Parkinson's disease. A key aspect is the striking downregulation of PARK genes. Since their mutation-induced malfunction in the familial forms of Parkinson's disease rapidly accelerates DA neuron degeneration, the results from our study could support the view that these genes are also involved in the pathogenesis of sporadic Parkinson's disease. Our data also point to an imbalance in the neuronal homeostasis and stress characterized by factors related to high metabolic rate, neurotransmission and ion-channel activity. This stress might be part of the DA neuronal normal homeostasis and aging, but could exacerbate when there is an unfavourable imbalance. In addition, the array data suggest a disintegration of key cellular functions, such as mitochondria-associated energy metabolism, protein degradation, synaptic function and cytoskeletal integrity revealing a cellular state that is characterized by PCD. However, despite this cellular demise, some genes linked to survival mechanisms were upregulated indicating the activation of compensatory mechanisms. Finally, the lack of or relatively modest deregulation of genes important for the DA neuronal phenotype suggests that the DA neurotransmitter identity (including DA production) seems to be sustained even when the neurons are severely damaged. Altogether, it appears that the gene expression profile of late stage Parkinson's disease DA neurons is consistent with the view that Parkinson's disease is a complex disorder and that multiple factors and cellular pathways are involved in its pathogenesis.
Supplementary material
Supplementary material is available at BRAIN online.
Funding
Massachusetts’ Alzheimer's Disease Research Center (partial); Harvard NeuroDiscovery Center (partial); NIH/NINDS N5057460 (partial).
Supplementary Material
Acknowledgements
The authors want to thank Dr. Donna McPhie for reading the manuscript and providing critical comments.
Glossary
Abbreviations
- DA
dopamine
- LMD
laser microdissection
- PCD
programmed cell death
- PMI
postmortem interval
- UPS
ubiquitin-proteasome system
References
- Benabid AL. What the future holds for deep brain stimulation. Expert Rev Med Devices. 2007;4:895–903. doi: 10.1586/17434440.4.6.895. [DOI] [PubMed] [Google Scholar]
- Benes FM, Lim B, Matzilevich D, Walsh JP, Subburaju S, Minns M. Regulation of the GABA cell phenotype in hippocampus of schizophrenics and bipolars. Proc Natl Acad Sci USA. 2007;104:10164–9. doi: 10.1073/pnas.0703806104. [DOI] [PMC free article] [PubMed] [Google Scholar]
- Boka G, Anglade P, Wallach D, Javoy-Agid F, Agid Y, Hirsch EC. Immunocytochemical analysis of tumor necrosis factor and its receptors in Parkinson's disease. Neurosci Lett. 1994;172:151–4. doi: 10.1016/0304-3940(94)90684-x. [DOI] [PubMed] [Google Scholar]
- Bredesen DE, Rao RV, Mehlen P. Cell death in the nervous system. Nature. 2006;443:796–802. doi: 10.1038/nature05293. [DOI] [PMC free article] [PubMed] [Google Scholar]
- Brunger AT. Structure and function of SNARE and SNARE-interacting proteins. Q Rev Biophys. 2005;38:1–47. doi: 10.1017/S0033583505004051. [DOI] [PubMed] [Google Scholar]
- Burke R. The concept and mechanisms of programmed cell death. In: Factor SA, Weiner WJ, editors. Parkinson's disease: diagnosis and clinical management. New York: Demos Medical Publishing, Inc.; 2007. pp. 1–16. [Google Scholar]
- Burke RE. Programmed cell death and new discoveries in the genetics of parkinsonism. J Neurochem. 2008;104:875–90. doi: 10.1111/j.1471-4159.2007.05106.x. [DOI] [PMC free article] [PubMed] [Google Scholar]
- Cantuti-Castelvetri I, Keller-McGandy C, Bouzou B, Asteris G, Clark TW, Frosch MP, et al. Effects of gender on nigral gene expression and parkinson disease. Neurobiol Dis. 2007;26:606–14. doi: 10.1016/j.nbd.2007.02.009. [DOI] [PMC free article] [PubMed] [Google Scholar]
- Cookson MR. The biochemistry of Parkinson's disease. Annu Rev Biochem. 2005;74:29–52. doi: 10.1146/annurev.biochem.74.082803.133400. [DOI] [PubMed] [Google Scholar]
- de Carvalho Aguiar P, Sweadner KJ, Penniston JT, Zaremba J, Liu L, Caton M, et al. Mutations in the Na+/K+ -ATPase alpha3 gene ATP1A3 are associated with rapid-onset dystonia parkinsonism. Neuron. 2004;43:169–75. doi: 10.1016/j.neuron.2004.06.028. [DOI] [PubMed] [Google Scholar]
- Doniger SW, Salomonis N, Dahlquist KD, Vranizan K, Lawlor SC, Conklin BR. MAPPFinder: using Gene Ontology and GenMAPP to create a global gene-expression profile from microarray data. Genome Biol. 2003;4:R7. doi: 10.1186/gb-2003-4-1-r7. [DOI] [PMC free article] [PubMed] [Google Scholar]
- Duke DC, Moran LB, Kalaitzakis ME, Deprez M, Dexter DT, Pearce RK, et al. Transcriptome analysis reveals link between proteasomal and mitochondrial pathways in Parkinson's disease. Neurogenetics. 2006;7:139–48. doi: 10.1007/s10048-006-0033-5. [DOI] [PubMed] [Google Scholar]
- Ferrer I, Blanco R, Cutillas B, Ambrosio S. Fas and Fas-L expression in Huntington's disease and Parkinson's disease. Neuropathol Appl Neurobiol. 2000;26:424–33. doi: 10.1046/j.1365-2990.2000.00267.x. [DOI] [PubMed] [Google Scholar]
- Goldsteins G, Keksa-Goldsteine V, Ahtoniemi T, Jaronen M, Arens E, Akerman K, et al. Deleterious role of superoxide dismutase in the mitochondrial intermembrane space. J Biol Chem. 2008;283:8446–52. doi: 10.1074/jbc.M706111200. [DOI] [PubMed] [Google Scholar]
- Gomez C, Bandez MJ, Navarro A. Pesticides and impairment of mitochondrial function in relation with the parkinsonian syndrome. Front Biosci. 2007;12:1079–93. doi: 10.2741/2128. [DOI] [PubMed] [Google Scholar]
- Grunblatt E, Mandel S, Jacob-Hirsch J, Zeligson S, Amariglo N, Rechavi G, et al. Gene expression profiling of parkinsonian substantia nigra pars compacta; alterations in ubiquitin-proteasome, heat shock protein, iron and oxidative stress regulated proteins, cell adhesion/cellular matrix and vesicle trafficking genes. J Neural Transm. 2004;111:1543–73. doi: 10.1007/s00702-004-0212-1. [DOI] [PubMed] [Google Scholar]
- Grundemann J, Schlaudraff F, Haeckel O, Liss B. Elevated alpha-synuclein mRNA levels in individual UV-laser-microdissected dopaminergic substantia nigra neurons in idiopathic Parkinson's disease. Nucleic Acids Res. 2008;36:e38. doi: 10.1093/nar/gkn084. [DOI] [PMC free article] [PubMed] [Google Scholar]
- Hartmann A, Mouatt-Prigent A, Faucheux BA, Agid Y, Hirsch EC. FADD: A link between TNF family receptors and caspases in Parkinson's disease. Neurology. 2002;58:308–10. doi: 10.1212/wnl.58.2.308. [DOI] [PubMed] [Google Scholar]
- Hartmann A, Troadec JD, Hunot S, Kikly K, Faucheux BA, Mouatt-Prigent A, et al. Caspase-8 is an effector in apoptotic death of dopaminergic neurons in Parkinson's disease, but pathway inhibition results in neuronal necrosis. J Neurosci. 2001;21:2247–55. doi: 10.1523/JNEUROSCI.21-07-02247.2001. [DOI] [PMC free article] [PubMed] [Google Scholar]
- Hauser MA, Li YJ, Xu H, Noureddine MA, Shao YS, Gullans SR, et al. Expression profiling of substantia nigra in Parkinson disease, progressive supranuclear palsy, and frontotemporal dementia with parkinsonism. Arch Neurol. 2005;62:917–21. doi: 10.1001/archneur.62.6.917. [DOI] [PubMed] [Google Scholar]
- Kobayashi T, Ikeda K. G protein-activated inwardly rectifying potassium channels as potential therapeutic targets. Curr Pharm Des. 2006;12:4513–23. doi: 10.2174/138161206779010468. [DOI] [PubMed] [Google Scholar]
- Lee KH, Kim MY, Kim DH, Lee YS. Syntaxin 1A and receptor for activated C kinase interact with the N-terminal region of human dopamine transporter. Neurochem Res. 2004;29:1405–9. doi: 10.1023/b:nere.0000026404.08779.43. [DOI] [PubMed] [Google Scholar]
- Li J, Smyth P, Cahill S, Denning K, Flavin R, Aherne S, et al. Improved RNA quality and TaqMan Pre-amplification method (PreAmp) to enhance expression analysis from formalin fixed paraffin embedded (FFPE) materials. BMC Biotechnol. 2008;8:10. doi: 10.1186/1472-6750-8-10. [DOI] [PMC free article] [PubMed] [Google Scholar]
- Liss B, Haeckel O, Wildmann J, Miki T, Seino S, Roeper J. K-ATP channels promote the differential degeneration of dopaminergic midbrain neurons. Nat Neurosci. 2005;8:1742–51. doi: 10.1038/nn1570. [DOI] [PubMed] [Google Scholar]
- Livak KJ, Schmittgen TD. Analysis of relative gene expression data using real-time quantitative PCR and the 2(-Delta Delta C(T)) method. Methods. 2001;25:402–8. doi: 10.1006/meth.2001.1262. [DOI] [PubMed] [Google Scholar]
- Lu L, Neff F, Dun Z, Hemmer B, Oertel WH, Schlegel J, et al. Gene expression profiles derived from single cells in human postmortem brain. Brain Res Brain Res Protoc. 2004;13:18–25. doi: 10.1016/j.brainresprot.2003.12.003. [DOI] [PubMed] [Google Scholar]
- Lu L, Neff F, Fischer DA, Henze C, Hirsch EC, Oertel WH, et al. Regional vulnerability of mesencephalic dopaminergic neurons prone to degenerate in Parkinson's disease: a post-mortem study in human control subjects. Neurobiol Dis. 2006;23:409–21. doi: 10.1016/j.nbd.2006.04.002. [DOI] [PubMed] [Google Scholar]
- Lundvig D, Lindersson E, Jensen PH. Pathogenic effects of alpha-synuclein aggregation. Brain Res Mol Brain Res. 2005;134:3–17. doi: 10.1016/j.molbrainres.2004.09.001. [DOI] [PubMed] [Google Scholar]
- Luzzi V, Mahadevappa M, Raja R, Warrington JA, Watson MA. Accurate and reproducible gene expression profiles from laser capture microdissection, transcript amplification, and high density oligonucleotide microarray analysis. J Mol Diagn. 2003;5:9–14. doi: 10.1016/S1525-1578(10)60445-X. [DOI] [PMC free article] [PubMed] [Google Scholar]
- Maguire-Zeiss KA, Federoff HJ. Convergent pathobiologic model of Parkinson's disease. Ann NY Acad Sci. 2003;991:152–66. doi: 10.1111/j.1749-6632.2003.tb07473.x. [DOI] [PubMed] [Google Scholar]
- Martin LJ, Liu Z, Chen K, Price AC, Pan Y, Swaby JA, et al. Motor neuron degeneration in amyotrophic lateral sclerosis mutant superoxide dismutase-1 transgenic mice: mechanisms of mitochondriopathy and cell death. J Comp Neurol. 2007;500:20–46. doi: 10.1002/cne.21160. [DOI] [PubMed] [Google Scholar]
- Matsubayashi H, Inoue A, Amano T, Seki T, Nakata Y, Sasa M, et al. Involvement of alpha7- and alpha4beta2-type postsynaptic nicotinic acetylcholine receptors in nicotine-induced excitation of dopaminergic neurons in the substantia nigra: a patch clamp and single-cell PCR study using acutely dissociated nigral neurons. Brain Res Mol Brain Res. 2004;129:1–7. doi: 10.1016/j.molbrainres.2004.06.040. [DOI] [PubMed] [Google Scholar]
- Michel PP, Alvarez-Fischer D, Guerreiro S, Hild A, Hartmann A, Hirsch EC. Role of activity-dependent mechanisms in the control of dopaminergic neuron survival. J Neurochem. 2007;101:289–97. doi: 10.1111/j.1471-4159.2006.04424.x. [DOI] [PubMed] [Google Scholar]
- Miller RM, Callahan LM, Casaceli C, Chen L, Kiser GL, Chui B, et al. Dysregulation of gene expression in the 1-methyl-4-phenyl-1,2,3,6-tetrahydropyridine-lesioned mouse substantia nigra. J Neurosci. 2004;24:7445–54. doi: 10.1523/JNEUROSCI.4204-03.2004. [DOI] [PMC free article] [PubMed] [Google Scholar]
- Miller RM, Federoff HJ. Altered gene expression profiles reveal similarities and differences between Parkinson disease and model systems. Neuroscientist. 2005;11:539–49. doi: 10.1177/1073858405278330. [DOI] [PubMed] [Google Scholar]
- Miller RM, Kiser GL, Kaysser-Kranich TM, Lockner RJ, Palaniappan C, Federoff HJ. Robust dysregulation of gene expression in substantia nigra and striatum in Parkinson's disease. Neurobiol Dis. 2006;21:305–13. doi: 10.1016/j.nbd.2005.07.010. [DOI] [PubMed] [Google Scholar]
- Mogi M, Harada M, Kondo T, Mizuno Y, Narabayashi H, Riederer P, et al. The soluble form of Fas molecule is elevated in parkinsonian brain tissues. Neurosci Lett. 1996;220:195–8. doi: 10.1016/s0304-3940(96)13257-2. [DOI] [PubMed] [Google Scholar]
- Moore DJ, West AB, Dawson VL, Dawson TM. Molecular pathophysiology of Parkinson's disease. Annu Rev Neurosci. 2005;28:57–87. doi: 10.1146/annurev.neuro.28.061604.135718. [DOI] [PubMed] [Google Scholar]
- Mootha VK, Lepage P, Miller K, Bunkenborg J, Reich M, Hjerrild M, et al. Identification of a gene causing human cytochrome c oxidase deficiency by integrative genomics. Proc Natl Acad Sci USA. 2003;100:605–10. doi: 10.1073/pnas.242716699. [DOI] [PMC free article] [PubMed] [Google Scholar]
- Moran LB, Croisier E, Duke DC, Kalaitzakis ME, Roncaroli F, Deprez M, et al. Analysis of alpha-synuclein, dopamine and parkin pathways in neuropathologically confirmed parkinsonian nigra. Acta Neuropathol. 2007;113:253–63. doi: 10.1007/s00401-006-0181-6. [DOI] [PubMed] [Google Scholar]
- Moran LB, Duke DC, Deprez M, Dexter DT, Pearce RK, Graeber MB. Whole genome expression profiling of the medial and lateral substantia nigra in Parkinson's disease. Neurogenetics. 2006;7:1–11. doi: 10.1007/s10048-005-0020-2. [DOI] [PubMed] [Google Scholar]
- Moran LB, Graeber MB. Towards a pathway definition of Parkinson's disease: a complex disorder with links to cancer, diabetes and inflammation. Neurogenetics. 2008;9:1–13. doi: 10.1007/s10048-007-0116-y. [DOI] [PMC free article] [PubMed] [Google Scholar]
- Olanow CW. The pathogenesis of cell death in Parkinson's disease–2007. Mov Disord. 2007;22(Suppl 17):S335–42. doi: 10.1002/mds.21675. [DOI] [PubMed] [Google Scholar]
- Olanow CW, McNaught KS. Ubiquitin-proteasome system and Parkinson's disease. Mov Disord. 2006;21:1806–23. doi: 10.1002/mds.21013. [DOI] [PubMed] [Google Scholar]
- Quik M, Bordia T, O’Leary K. Nicotinic receptors as CNS targets for Parkinson's disease. Biochem Pharmacol. 2007;74:1224–34. doi: 10.1016/j.bcp.2007.06.015. [DOI] [PMC free article] [PubMed] [Google Scholar]
- Raza H, Robin MA, Fang JK, Avadhani NG. Multiple isoforms of mitochondrial glutathione S-transferases and their differential induction under oxidative stress. Biochem J. 2002;366:45–55. doi: 10.1042/BJ20020533. [DOI] [PMC free article] [PubMed] [Google Scholar]
- Ron D, Walter P. Signal integration in the endoplasmic reticulum unfolded protein response. Nat Rev Mol Cell Biol. 2007;8:519–29. doi: 10.1038/nrm2199. [DOI] [PubMed] [Google Scholar]
- Schapira AH. Future directions in the treatment of Parkinson's disease. Mov Disord. 2007;22(Suppl 17):S385–91. doi: 10.1002/mds.21679. [DOI] [PubMed] [Google Scholar]
- Scherzer CR, Eklund AC, Morse LJ, Liao Z, Locascio JJ, Fefer D, et al. Molecular markers of early Parkinson's disease based on gene expression in blood. Proc Natl Acad Sci USA. 2007;104:955–60. doi: 10.1073/pnas.0610204104. [DOI] [PMC free article] [PubMed] [Google Scholar]
- Schiesling C, Kieper N, Seidel K, Kruger R. Review: familial Parkinson's disease–genetics, clinical phenotype and neuropathology in relation to the common sporadic form of the disease. Neuropathol Appl Neurobiol. 2008;34:255–71. doi: 10.1111/j.1365-2990.2008.00952.x. [DOI] [PubMed] [Google Scholar]
- Schmittgen TD, Livak KJ. Analyzing real-time PCR data by the comparative C(T) method. Nat Protoc. 2008;3:1101–8. doi: 10.1038/nprot.2008.73. [DOI] [PubMed] [Google Scholar]
- Scorrano L. Multiple functions of mitochondria-shaping proteins. Novartis Found Symp. 2007;287:47–55. doi: 10.1002/9780470725207.ch4. discussion 55–9. [DOI] [PubMed] [Google Scholar]
- Singh S, Dikshit M. Apoptotic neuronal death in Parkinson's disease: involvement of nitric oxide. Brain Res Rev. 2007;54:233–50. doi: 10.1016/j.brainresrev.2007.02.001. [DOI] [PubMed] [Google Scholar]
- Stirling PC, Srayko M, Takhar KS, Pozniakovsky A, Hyman AA, Leroux MR. Functional interaction between phosducin-like protein 2 and cytosolic chaperonin is essential for cytoskeletal protein function and cell cycle progression. Mol Biol Cell. 2007;18:2336–45. doi: 10.1091/mbc.E07-01-0069. [DOI] [PMC free article] [PubMed] [Google Scholar]
- Surmeier DJ. Calcium, ageing, and neuronal vulnerability in Parkinson's disease. Lancet Neurol. 2007;6:933–8. doi: 10.1016/S1474-4422(07)70246-6. [DOI] [PubMed] [Google Scholar]
- Tatton WG, Chalmers-Redman R, Brown D, Tatton N. Apoptosis in Parkinson's disease: signals for neuronal degradation. Ann Neurol. 2003;53(Suppl 3):S61–70. doi: 10.1002/ana.10489. discussion S70–2. [DOI] [PubMed] [Google Scholar]
- Thomas B, Beal MF. Parkinson's disease. Hum Mol Genet. 2007;16(Spec No. 2):R183–94. doi: 10.1093/hmg/ddm159. [DOI] [PubMed] [Google Scholar]
- Tusher VG, Tibshirani R, Chu G. Significance analysis of microarrays applied to the ionizing radiation response. Proc Natl Acad Sci USA. 2001;98:5116–21. doi: 10.1073/pnas.091062498. [DOI] [PMC free article] [PubMed] [Google Scholar]
- Ungewickell EJ, Hinrichsen L. Endocytosis: clathrin-mediated membrane budding. Curr Opin Cell Biol. 2007;19:417–25. doi: 10.1016/j.ceb.2007.05.003. [DOI] [PubMed] [Google Scholar]
- Whitton PS. Inflammation as a causative factor in the aetiology of Parkinson's disease. Br J Pharmacol. 2007;150:963–76. doi: 10.1038/sj.bjp.0707167. [DOI] [PMC free article] [PubMed] [Google Scholar]
- Yi M, Horton JD, Cohen JC, Hobbs HH, Stephens RM. WholePathwayScope: a comprehensive pathway-based analysis tool for high-throughput data. BMC Bioinform. 2006;7:30. doi: 10.1186/1471-2105-7-30. [DOI] [PMC free article] [PubMed] [Google Scholar]
- Zhang Y, James M, Middleton FA, Davis RL. Transcriptional analysis of multiple brain regions in Parkinson's disease supports the involvement of specific protein processing, energy metabolism, and signaling pathways, and suggests novel disease mechanisms. Am J Med Genet B Neuropsychiatr Genet. 2005;137:5–16. doi: 10.1002/ajmg.b.30195. [DOI] [PubMed] [Google Scholar]
Associated Data
This section collects any data citations, data availability statements, or supplementary materials included in this article.
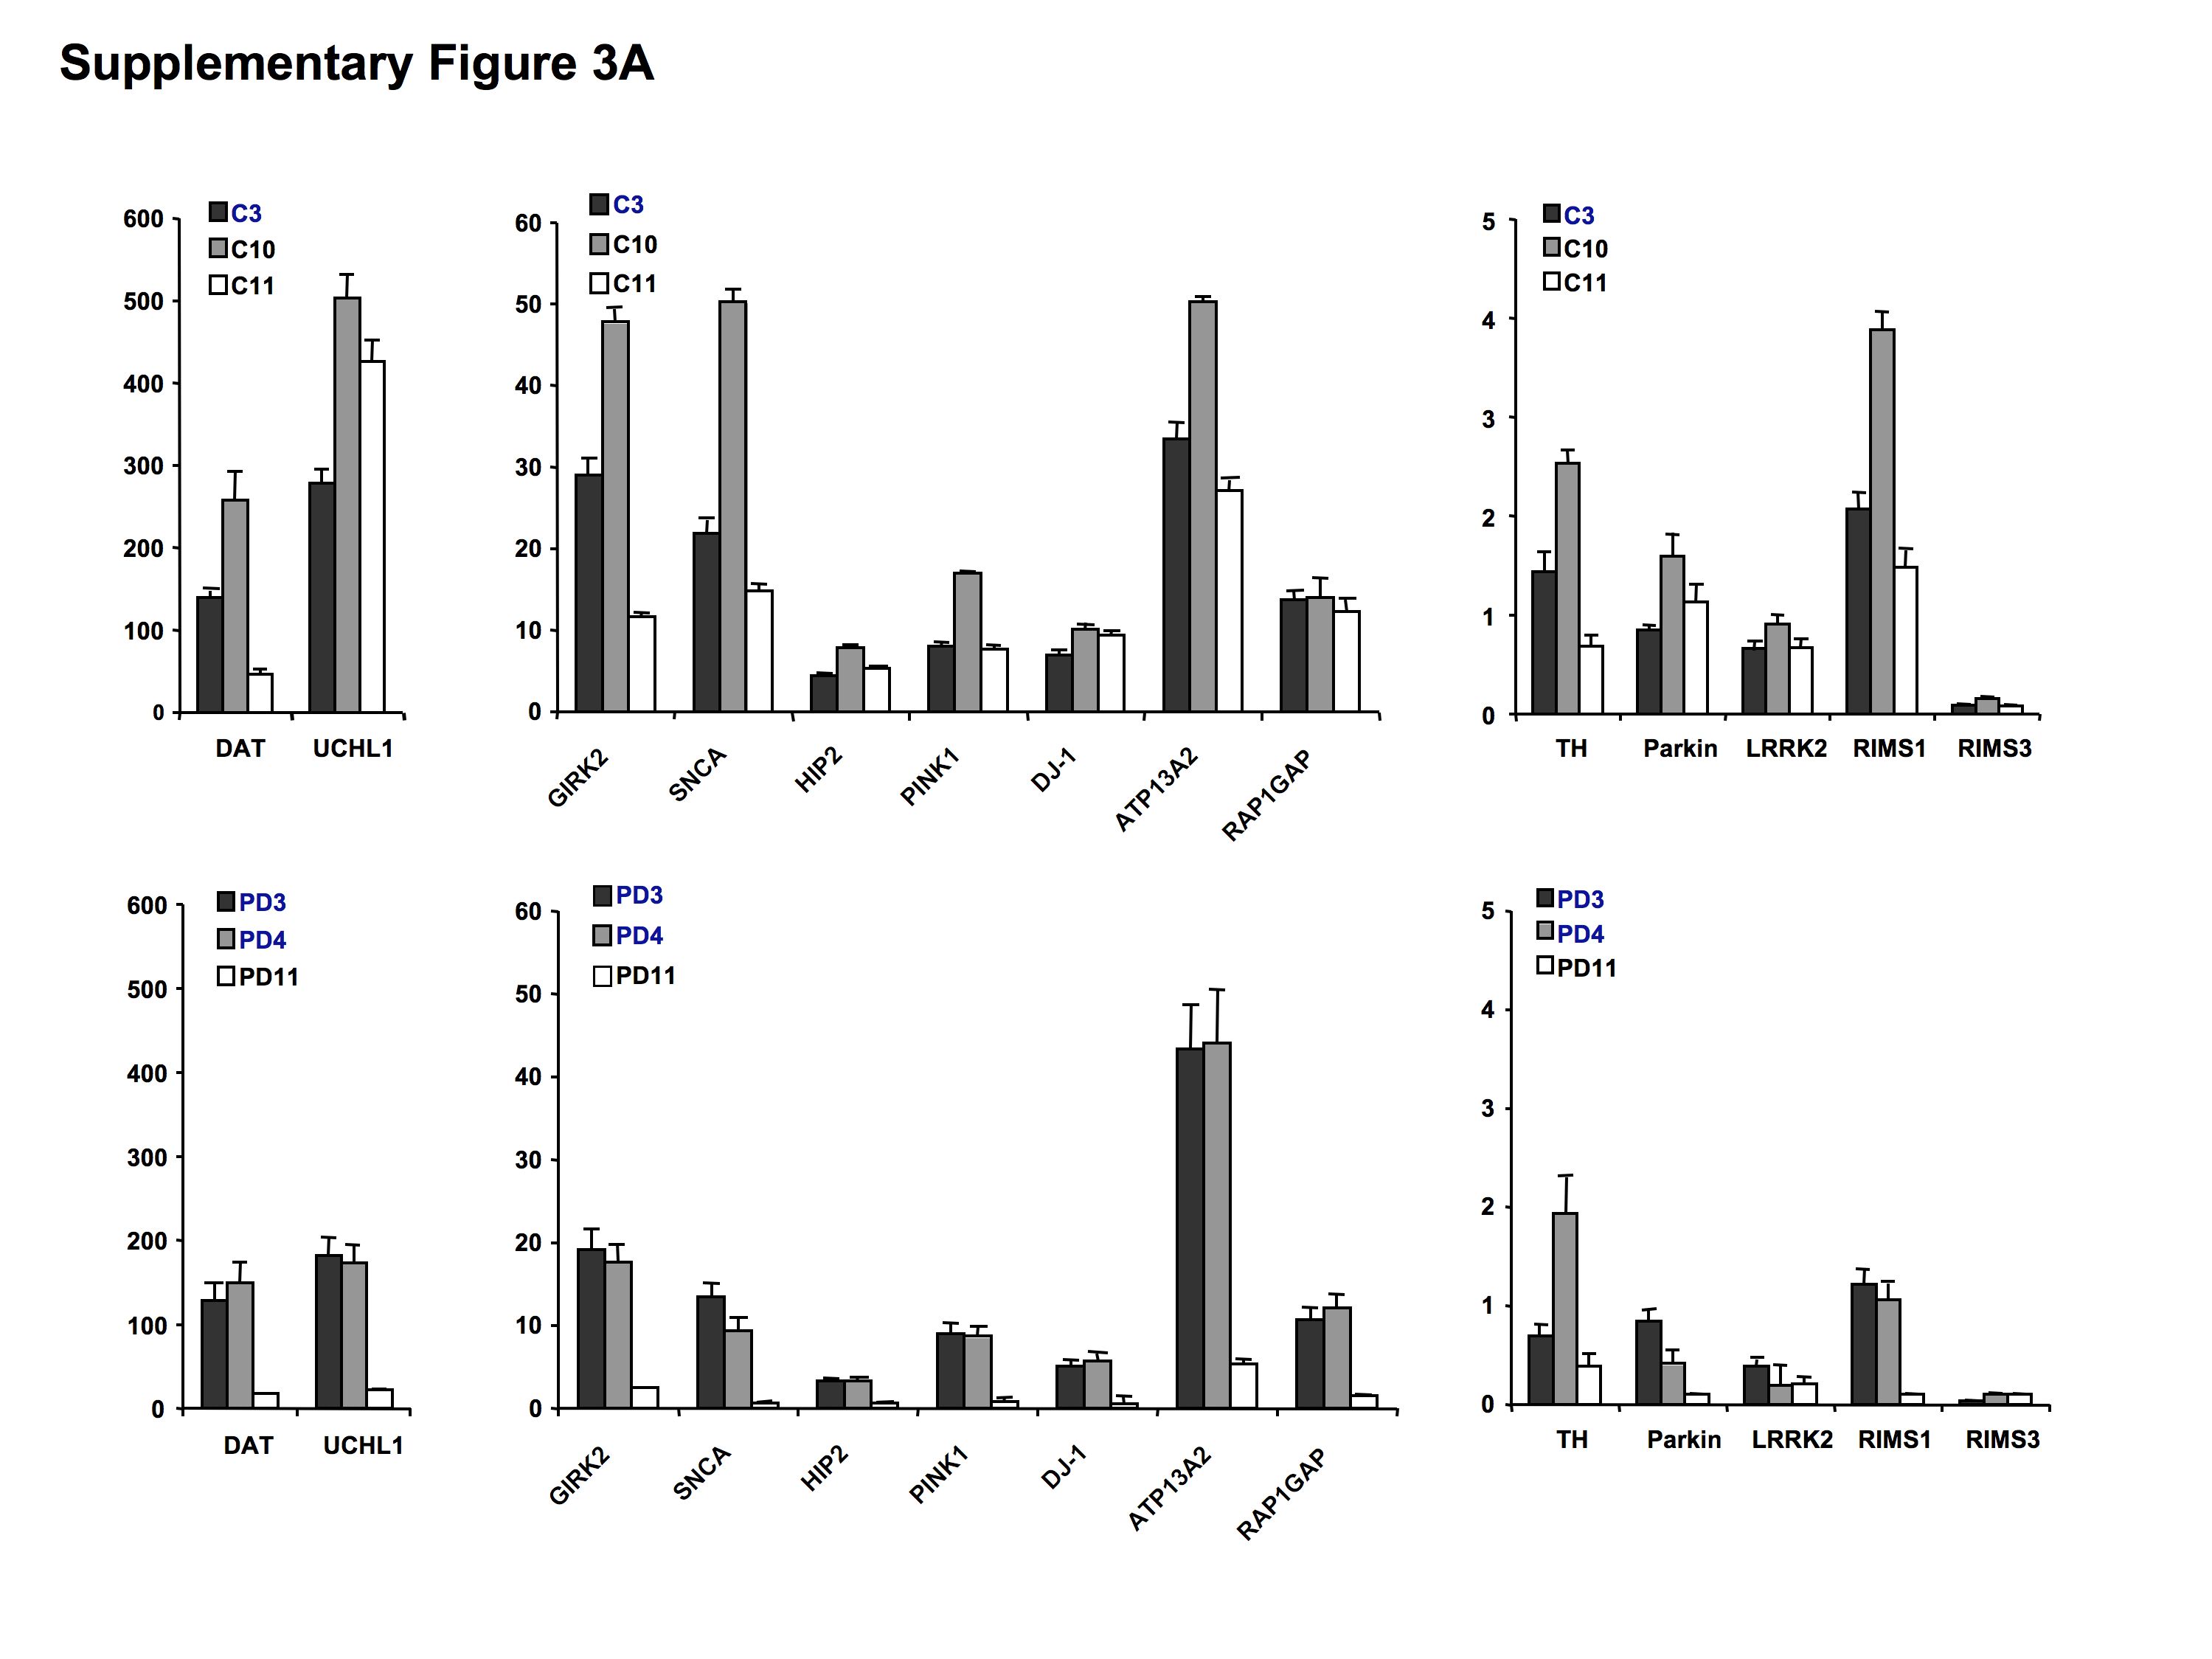
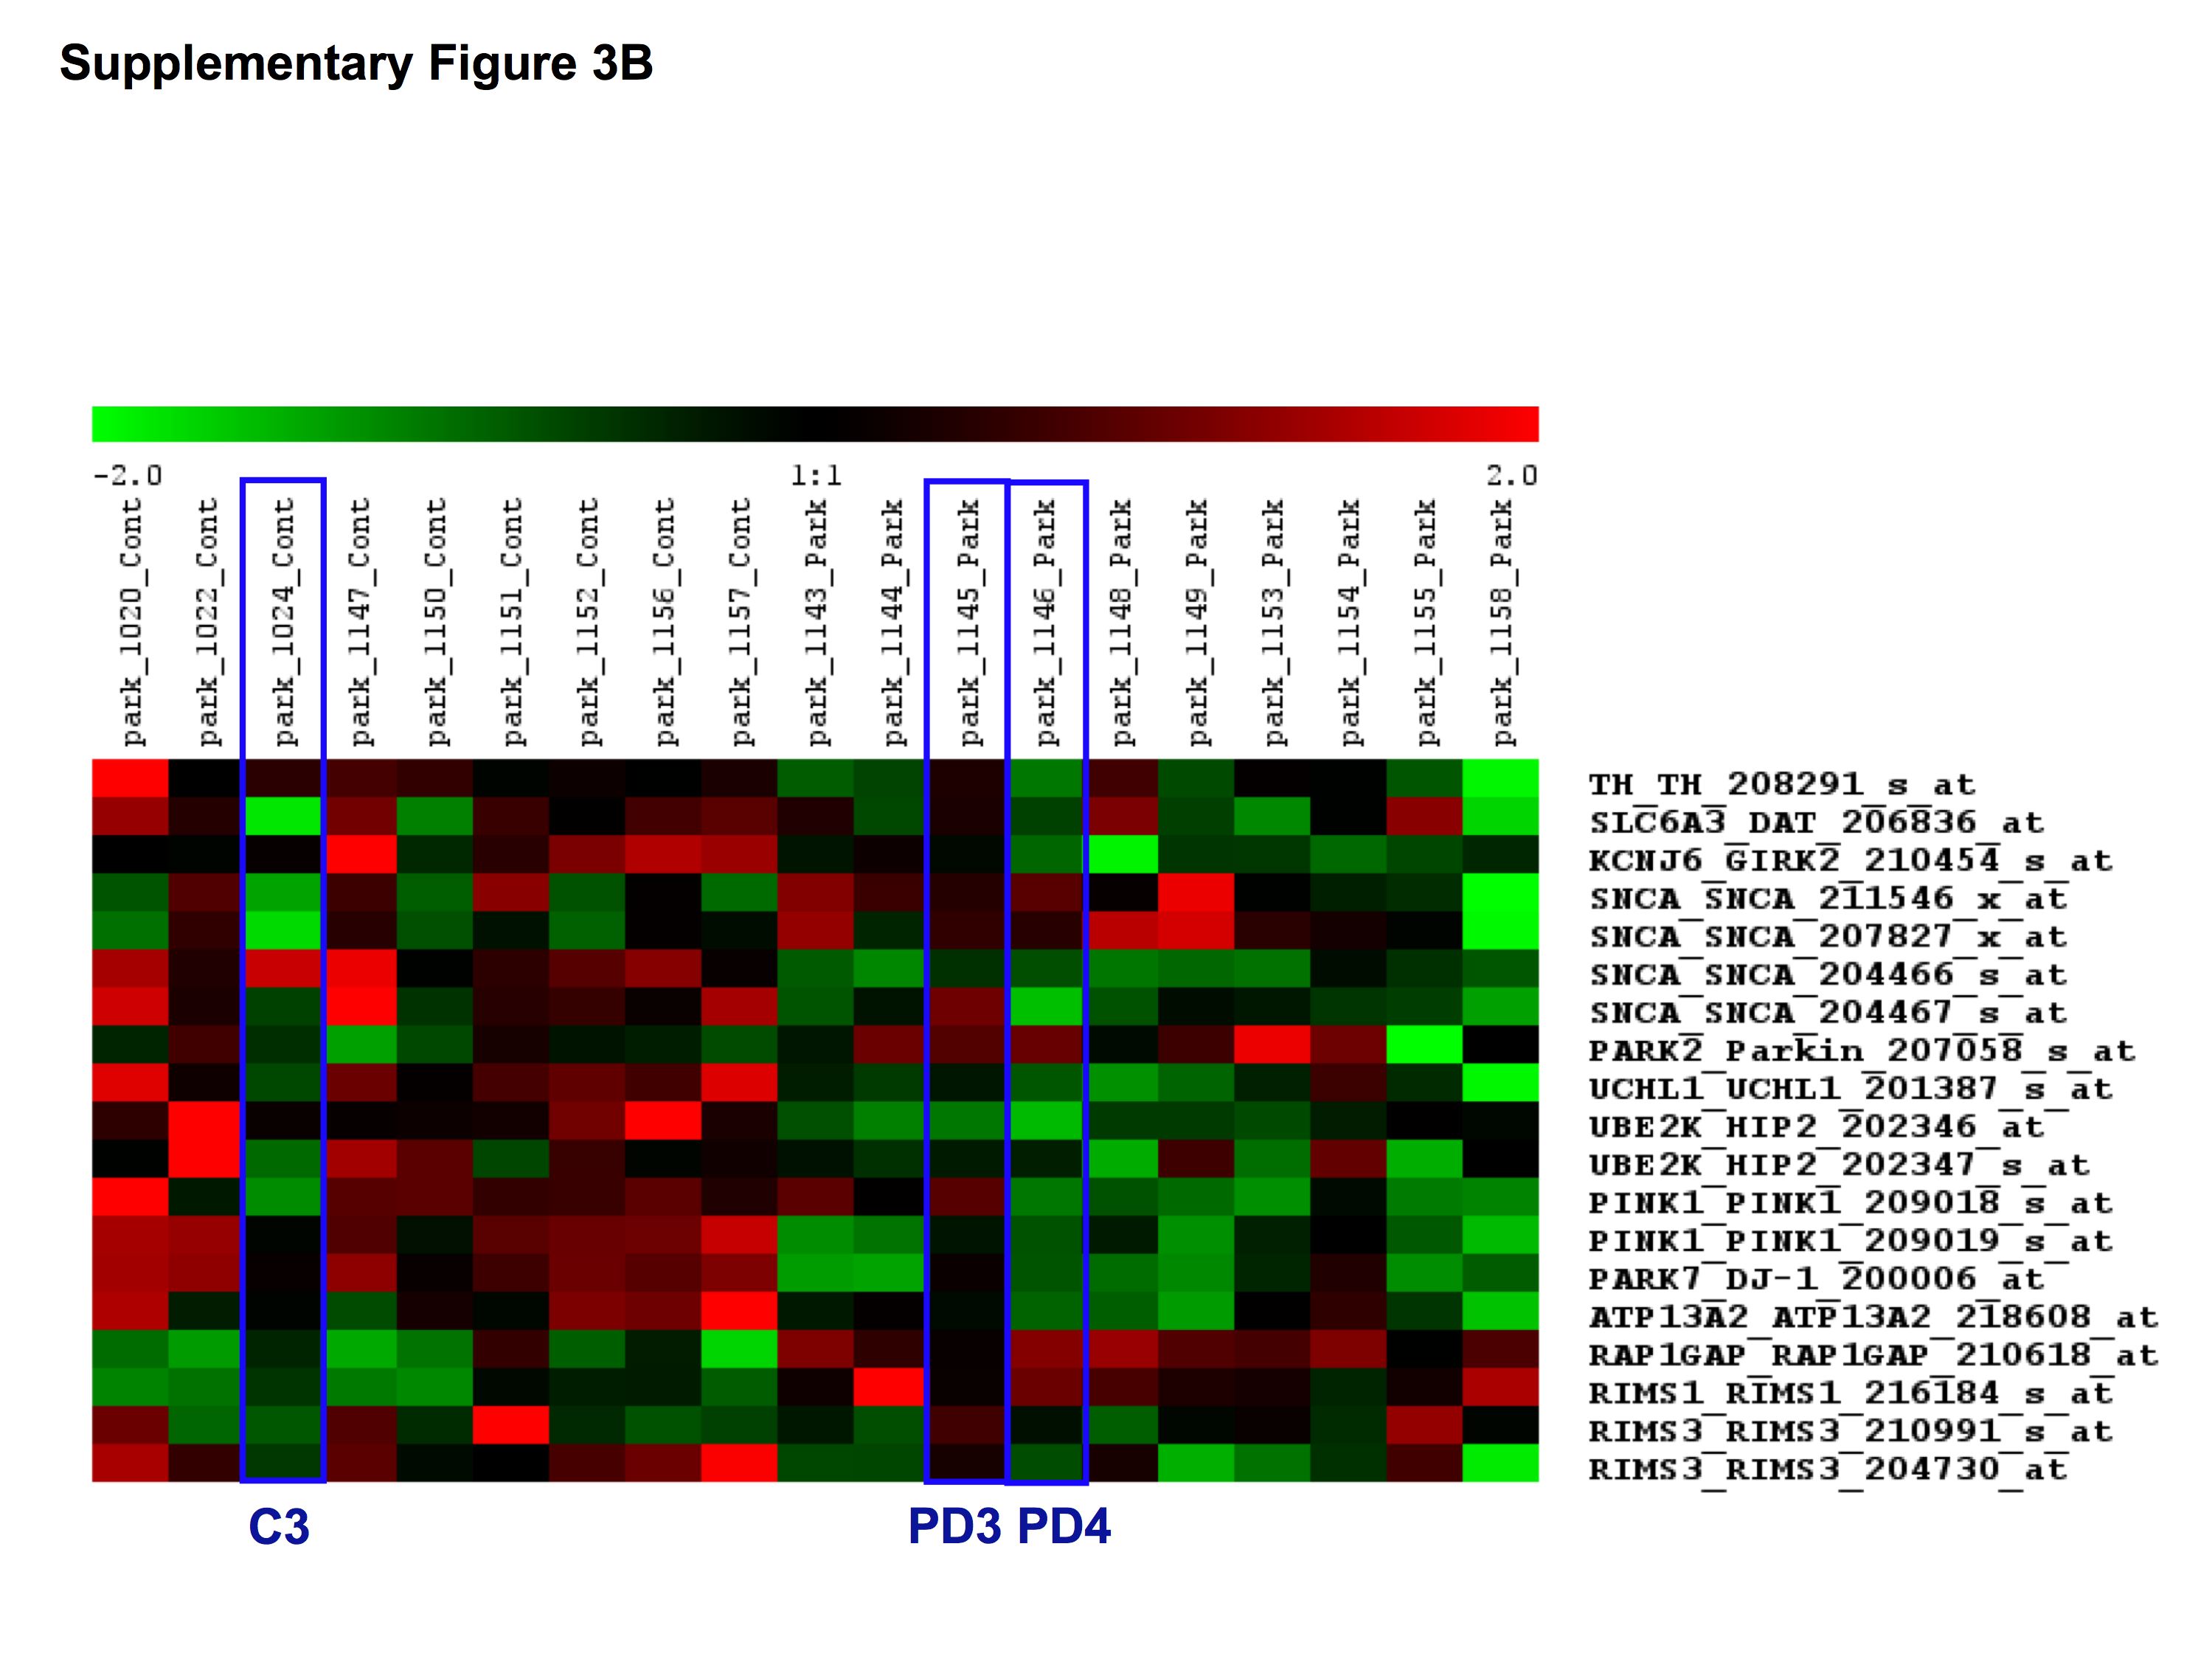