Abstract
The administration of high doses of therapeutic antibodies requires large-scale, efficient, cost effective manufacturing processes. An understanding of how the industry is using its available production capacity is important for production planning, and facility expansion analysis. Inaccurate production planning for therapeutic antibodies can have serious financial ramifications. In the recent 5th Annual Report and Survey of Biopharmaceutical Manufacturing Capacity and Production, 434 qualified respondents from 39 countries were asked to indicate, among other manufacturing issues, their current trends and future predictions with respect to the production capacity utilization of monoclonal antibodies in mammalian cell culture systems. While overall production of monoclonals has expanded dramatically since 2003, the average capacity utilization for mammalian cell culture systems, has decreased each year since 2003. Biomanufacturers aggressively attempt to avoid unanticipated high production demands that can create a capacity crunch. We summarize trends associated with capacity utilization and capacity constraints which indicate that biopharmaceutical manufacturers are doing a better job planning for capacity. The results have been a smoothing of capacity use shifts and an improved ability to forecast capacity and outsourcing needs. Despite these data, today, the instability and financial constraints caused by the current global economic crisis are likely to create unforeseen shifts in our capacity utilization and capacity expansion trends. These shifts will need to be measured in subsequent studies.
Key words: capacity, production, monoclonal antibody, survey, biopharmaceutical, manufacturing, constraints, facility
Building new capacity and improving existing systems to meet the demand for new monoclonal antibody (mAb) therapeutics, whether through in-house manufacturing or out-sourced contract manufacturing, has long-term cost implications for biotechnology firms. Bringing new capacity on line requires accurate market knowledge, lead-time, large capital expenditures and careful planning, and understanding trends in capacity utilization for the manufacture of mAbs can be critical to the planning process.
For the first three quarters of the twentieth century, the traditional and most efficient way of producing antibodies was to immunize a large vertebrate, bleed the animal and, from the serum, collect the polyclonal protein. Because of their hardy binding specificity, the value of immunoglobulins, especially as a potential therapeutic tool, was evident from the time of their discovery because scientists envisioned them as probes and transporters of therapeutic tools. Limitations of using polyclonals were also evident from early on. Therapeutic antibodies needed to be delivered in very high concentration, and polyclonals, a heterogeneous group of molecules, directed against many different epitopes of an antigenic source, could only be extracted from serum in tiny quantities.
A solution to at least some of the problems seemed to appear in 1984 when Kohler and Milstein1 described a novel method for producing antibodies from an immortalized cell line capable of continually producing a virtually unlimited amount of a single antibody, directed at a single epitope. The medical and scientific communities realized that this hybridoma technology could produce sufficient quantities of antibodies for therapy, and in 1986, the first mAb for human use (Orthoclone OKT3—Ortho Pharmaceuticals) was approved for the prevention of kidney transplant rejection.
As hybridoma technology evolved, it was clear that there were obstacles to overcome. The first mAbs were murine, but therapeutic candidates needed to be less immunogenic in order to avoid transplantation incompatibility. So chimeric antibodies and humanized mAbs (part murine, part human), and fully human mab production technologies were developed. The OKT3 approval was followed by a wave of mostly anti-cancer mAbs through the 1990's, and since then, these proteins have become a dominant component of the biopharmaceutical market, representing approximately 20% of all biologic products, with combined revenues of over $20 billion in 2006.2
Administration of high doses of therapeutic antibodies requires large-scale, efficient, cost effective manufacturing processes. Over the past few years, improvements have been made in cell line generation, expression vectors, transfection technology and large-scale cell culture production, allowing biotech firms to successfully move candidates through the pipeline. Today's technologies are enabling five times the concentration of antibody produced by technologies just 5 years ago.3 Biotechnology drugs, including mAbs, now make up more than one-quarter of the FDA filings for approval, and over 40% of preclinical trials are now large molecule candidates, and as a result, planning for biologics manufacturing will continue to require strategic approaches to avoid potentially disruptive production bottlenecks. The long lead-time required to successfully launch a mAb requires pre-planning for capacity. This planning demands a new level of partnership between manufacturers and suppliers to develop novel technologies that will keep pace with industry's need for capacity.
Utilization Rates
Production capacity utilization is the percentage of an industry's production capacity that is actually used, and it measures how effectively manufacturers and industries are using their fixed assets. In Bioplan Associates' 5th Annual Report and Survey of Biopharmaceutical Manufacturing Capacity and Production,4 respondents from 434 biotherapeutic developers and contract manufacturing organizations (CMOs) from 39 different countries were asked to indicate their production capacity utilization and constraints for mammalian cell culture systems leading up to the current state of production (2003–2007), and their predictions for the future of mAb capacity utilization (2008–2012).
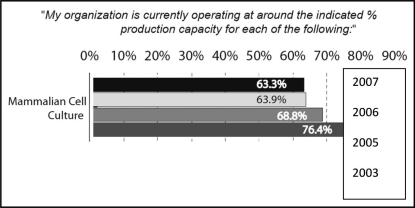
We have recently seen a leveling-off of fluctuations in manufacturing capacity, suggesting that companies within the biopharmaceutical industry are planning more effectively for the use of their existing capacity, and for shifts in demand for additional capacity over time. In 2003, the biopharmaceutical industry's capacity utilization rates exceeded 76%. The early 2000's was considered to be a capacity-crunch time that led to facility build-outs by both biotherapeutic developers and contract manufacturers. The resulting expanded capacity brought the utilization rate down so that by 2006 it appeared that a stable capacity utilization rate would be around 63%. In comparison to overall US industrial production, this biopharmaceutical capacity utilization rate is relatively low. For example, for all US industries the capacity utilization rate was 80.9%, in February 2008,5 although the rate had declined to 76.4% by October 2008.6
One of the possible reasons that the biopharmaceutical industry capacity utilization rate was approximately 18 percentage points lower than that for the overall US industry as of February 2008 is that biomanufacturers aggressively attempt to avoid unanticipated high production demands that can create a capacity crunch. This ‘flex’ or buffer capacity is important in to the business because the costs associated with not getting a company's therapeutic product to market in a timely manner can be devastating. On the other hand, the cost of an idle biomanufacturing facility must also be avoided. Currently, consistent biopharmaceutical industry utilization rates are due primarily to improved planning by manufacturers and the lack of new blockbuster drugs that might absorb substantial industry capacity.
Current Trends of Capacity Utilization and Constraints
We summarize in this paper the trends associated with capacity utilization and capacity constraints. Respondents were asked to indicate their production capacity utilization and capacity constraints for mammalian cell culture systems in the previous year, 2007. We compared these to responses we received from the same population in previous years, back to 2003. Respondents' answers and the trends identified were varied and insightful.
Because biologics can be produced in different systems, we differentiated between mammalian, microbial, yeast and plant systems. With respect to biopharmaceutical manufacturing using mammalian cell culture systems, the great majority of which is for mAb production, capacity utilization has dropped 13.1 percentage points, from 76.4% in 2003 to 63.3% in 2007 (a compound average rate of decline of −9.0%) (Fig. 1).
Figure 1.
Average production as percent of operating capacity, by system, 2007, 2006, 2005 and 2003.
Biotherapeutic Developers vs CMOs
We compared capacity utilization among biotherapeutic developers (drug innovators), vs. contract manufacturers (CMOs).7 We found that for mammalian cell culture, capacity utilization was higher among CMOs than for biotherapeutic developers (69.4% vs. 62.7%, respectively).
This is a shift from the previous year, when CMOs that utilized mammalian cell production systems had slightly more available capacity compared to biotherapeutic developers (61.8% for CMOs, vs 64.3% utilization for the biopharma manufacturers). In comparison, the year earlier, in 2005, biotherapeutic developers were indicating a significantly higher percentage of capacity utilization for mammalian cell culture than were CMOs (82.8% for and 63.7%, respectively). In 2005, biotherapeutic developers may have been experiencing a reduction of their internal capacity crunch, even as demand for biotherapeutics continued to grow. This was likely the result of significant additional manufacturing capacity coming on-line in 2005 and improvements in productivity, yield and operational efficiencies.
US vs Western Europe.
When we compared biomanufacturers (both therapeutic developers and CMOs) in the US to those in Western Europe in 2007, we found that mammalian cell culture manufacturing capacity utilization was slightly higher in the US than in Europe (66.4% vs. 61.4% respectively).
Factors Creating Capacity Constraints
Capacity utilization is, of course, tied to the constraints on production experienced by manufacturers. We measured organizations' perception of capacity constraints. Here, capacity utilization might be perceived as being too high, which might lead to insufficient ability to produce additional products or more production runs. With respect to production constraints, in 2007, 16.2% of all respondents, at all scales of manufacturing, agreed that their organization was currently experiencing either “severe” or “significant” constraints. This compares with 36.2% in 2006. However, the percentage of respondents who experienced “moderate” or “minor” constraints was 53.5% in 2007, 52.7% in 2006 and 54.6% in 2005. This suggests that, over time, more than half of the respondents consistently experience constraints—but their perceived degree of constraint has moved from “severe” to “moderate” since 2005.
Capacity Constraint, by Manufacturing Level
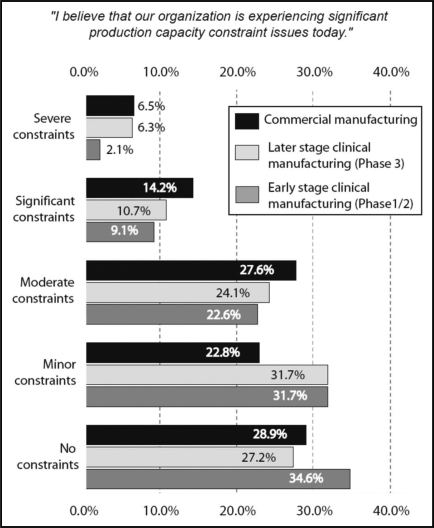
We also measured respondents' perception of capacity constraints, stratified by level of manufacturing. In 2007, 20.7% of respondents were experiencing severe or significant constraints in commercial manufacturing (with 48.3% experiencing greater than ‘minor’ constraints). In comparison, at “later-stage clinical manufacturing” (Phase 3), 17% of respondents were experiencing severe or significant constraints and 41.1% were experiencing greater than ‘minor’ constraints. At the early stage clinical manufacturing (Phase 1/2) level, 11.2% were experiencing severe or significant constraints, and 33.8% were experiencing greater than ‘minor’ constraints (Fig. 2).
Figure 2.
Capacity constraints 2007, by stage of production.
Future Predictions for Capacity Expansions
We aggregated respondents' projected plans for capacity expansion in mammalian cell culture production. On average, respondents indicated that they plan to increase overall mammalian cell culture production capacity by a total of 46% by 2012. This represents a minor drop in expansion projections for mammalian cell culture production compared with the previous year (52%), but a significant decrease when compared with the expansion projections that were made in 2003 (79%). This suggests that adequate capacity expansions took place during and after 2003.
Expansions for CMOs vs biotherapeutic developers.
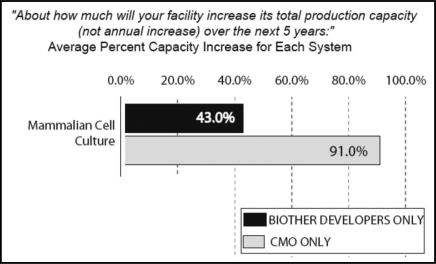
We also compared CMOs' 5-year planned capacity expansions to biotherapeutic developers. The CMO industry indicates it will be working to substantially increase production capacity in mammalian cell culture; over the next five years CMOs plan to increase production capacity by an average of 91%. In comparison, over the same time period, biotherapeutic developers expect a total increase in production capacity to average 43% (Fig. 3).
Figure 3.
Planned future capacity expansion: 5-year estimates, 2008 through 2012, biotherapeutic developers vs. CMOs.
US vs Western European respondents' capacity expansion plans.
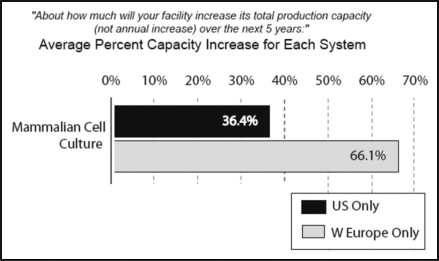
U.S. and Western European respondents differ significantly with respect to their predicted capacity utilization. CMO and biotherapeutic five-year expansion plans call for a total increase of 36.4% in the US, vs 66.1% in Europe (Fig. 4).
Figure 4.
Planned future capacity expansions: 5-year estimates, 2008 through 2012, US vs Western Europe.
Factors Creating Future Capacity Constraints
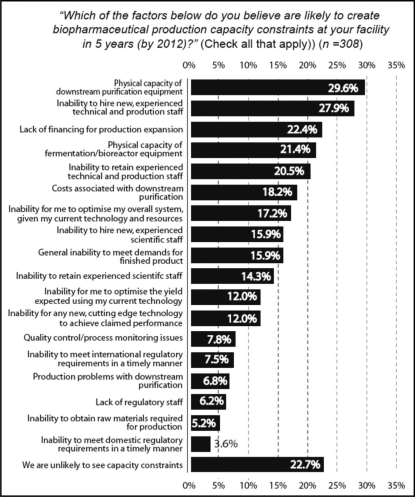
Respondents were asked to identify the major factors that might impact their organization's production capacity over the next five years. In 2007, “physical capacity of downstream purification equipment” was predicted to produce the greatest constraint (29.6%). This was a shift from 2005 and 2006 when the “inability to hire new, experienced technical and production staff” topped the list, with over 30% of respondents indicating it would be the major factor in production capacity constraints. In 2007 the hiring concern declined in importance somewhat, to the second constraint ‘slot’, as indicated by 27.9% of respondents. This number continued to decline from 2003 when over 52% of respondents felt that the lack of experienced production staff would be the major capacity bottleneck. In 2005, 39.6% felt hiring would be the primary source of bottlenecks in ‘5-years’ (by 2010). “Lack of financing for production expansion” was third on the list with 22.4%. “Physical capacity of fermentation/bioreactor equipment,” which shared the top spotlight with the “inability to hire new, experienced technical and production staff” in the 2006 survey, only received 21.4% of respondents' votes and is fourth on the list in the 2007 survey. Only 22.7% of respondents indicated that “we are unlikely to see capacity constraints in 2012.” (Fig. 5).
Figure 5.
Factors creating future capacity constraints.
When comparing responses from biotherapeutic manufacturers (both drug innovators and CMOs) in the US vs Western Europe, we found significant differences with respect to their identification of causes of capacity constraints. The greatest difference was in their perspective on hiring new, experienced technical and production staff. The “inability to hire new, experienced technical and production staff” was a future prediction by nearly 37.1% of European facilities, compared to 25.4% of US respondents.
Discussion
The overall capacity utilization rate for mammalian production continues to decline, although at a much slower rate than around 2003 when there was a perceived production capacity crunch and available capacity was tight. In addition, there has been a slight shift in mammalian capacity utilization by CMOs vs.biotherapeutic developers. In 2007, CMO mammalian capacity utilization not only increased over 2006, it was also higher than the utilization by biotherapeutic developers. This may be a result of a number of factors: (1) Biotherapeutic developers have increased their internal mammalian capacity faster than they can fill it; (2) CMOs have filled their capacity faster than they are expanding it; or (3) Biotherapeutic developers are outsourcing more of their mammalian production, thus using less of their available capacity and filling the CMO capacity. The specific causes of these shifts will require additional research and further analysis.
Of particular note is the general decrease in projected expansion this year versus that predicted in 2003. This general trend toward decreasing estimates of needed future capacity is possibly due to an underestimation in 2003 of the gains that process development activities would have on production yield. Over the last five years, there have been very large gains in yield and titers of antibodies produced in mammalian cell culture. Antibody titers, which drive much of the mammalian capacity requirement, have gone from the several hundred mg range in the early 2000s to multiple g/L today. In fact, we found that the average titer for both late-stage clinical scale production and commercial scale production mAb titers in 2007 was around 1.9 g/L. One example of how new technologies can affect expansion of biologics manufacturing capacity is the development of the PER.C6® cell line. Scientists working at Percevia (Cambridge, MA), the PER.C6® Development Center joint venture between DSM and Crucell, reached a record level titer of 15 g/L at harvest for an antibody product. This type of performance enables the production of previously uneconomical drug candidates. It also makes technologies such as single-use platforms possible. It is now theoretically possible to make the same amount of product in a 1,000 L single-use bioreactor that was previously only possible using a 10,000 L stainless steel tank.
Technologies being developed can enable approaches to manufacturing biologics that significantly decrease both the capital expenditures and operating expenses required to construct and operate biologics manufacturing facilities in the future. New facilities constructed around disposable technologies will be smaller, less complex and less expensive than traditional stainless steel tank manufacturing plants. Existing traditional manufacturing facilities with stainless steel bioreactors can be retrofitted to increase output. As a result of such successes in increased yields, expenditure in future capacity expansions may be reduced.
The decrease in the perception of capacity constraint between 2003 and 2007 probably reflects better overall capacity management by the industry, since overall product growth has continued to be relatively constant. Better capacity management could follow from better market and production forecasting, productivity enhancements and improved access by product development companies to external sources of additional capacity, such as CMOs or other biotherapeutic developers. With regard to the future of capacity utilization and capacity constraints, the growing rate of increase for CMOs correlates with general indications of continued growth. The mammalian system numbers are significantly higher for CMOs than for biotherapeutics developers. This suggests that the industry has grown comfortable with the outsourcing of mammalian cell culture activities. This is not surprising, as it is the most mature segment of work at CMOs, and most of the established CMOs offer mammalian cell production capacity. Some of this expansion may not take place in Europe if the biotech industry in Asia, especially India, China, Singapore and Korea, can succeed in attracting this growth as outsourced capacity.
CMOs are generally experiencing greater capacity constraints today, and they expect these constraints to continue in the future. This may be due, in part, to the growing tendency for biotherapeutic developers to outsource more of their production requirements. Other current trends associated with mAb production by both biotherapeutic developers and CMOs are evident. For example, both predict that the physical capacity of downstream purification equipment will be the greatest constraint on overall capacity. Improved efficiencies and productivity of existing downstream equipment are still needed. In addition, both CMOs and biotherapeutic developers must develop long-term solutions to hiring issues if they are to avoid ongoing shortages of experienced technical and production staff. This may be particularly true among European manufacturers. CMOs feel that increased training and education in regulatory, technical and scientific areas will also be important, so that future capacity constraints can be avoided.
Today, biopharmaceutical manufacturers are doing a better job planning for capacity, and their methods used for planning are maturing. By necessity, companies are implementing more effective capacity management techniques, and planning for future requirements, and this is being considered at more strategic levels within most organizations. The results have been a smoothing of capacity use shifts and an improved ability to forecast capacity and outsourcing needs. Despite these data and trend lines, today, the instability and financial constraints caused by the current global economic crisis are likely to create unforeseen shifts in our capacity utilization and capacity expansion trends. These shifts will very likely play an important role in global biopharmaceutical industry expansion plans and will need to be measured in subsequent studies.
Methodology
The 5th Annual Report and Survey of Biopharmaceutical Manufacturing Capacity and Production4 is the fifth in a series of annual evaluations by BioPlan Associates, Inc., The study involves a web-based quantitative survey that is administered annually by BioPlan Associates. To ensure broad, global coverage, it is done in conjunction with a number of association and media partners, including BioProcessUK, BayBio, EuropaBio, MassBio and BioProcess International (media partner). In this study, we cover issues in biopharmaceutical manufacturing faced by global biotherapeutic developers and CMOs. Respondents were asked to answer 52 open- and closed-ended questions associated with capacity utilization, constraints, future expansions, use of new technologies such as disposable (single-use) products, downstream purification problems, quality issues, batch failure rates, training and hiring issues and other current manufacturing issues. We survey biomanufacturers involved in mammalian cell culture, microbial fermentation, yeast, plant and other systems. This year's study yields a composite view from 434 responsible individuals at biopharmaceutical manufacturers and contract manufacturing organizations involved in R&D, process development, scale-up production and commercial manufacturing. This year, we covered biomanufacturers in 32 different countries. The methodology also, separately, encompassed an additional 126 direct suppliers of materials, services and equipment to this industry.
We note that the definitions of ‘capacity’ and ‘capacity utilization’ can vary. To ensure consistency, our study attempts to reflect the definition used by the US Federal Reserve Board, which defines capacity in its surveys as “The maximum level of production that [an] establishment could reasonably expect to attain under normal and realistic operating conditions fully utilizing the machinery and equipment in place… It assumes normal downtime, maintenance, repair and cleanup.8 In contrast, the Institute for Supply Management surveys ask respondents to measure current output relative to “normal capacity.” The definition of normal capacity is left to the respondent. In our study, respondents were asked to indicate at what percentage of total production capacity their facility is currently operating. Thus, we are leaving the definition of “total capacity” to the individual. We believe, however, that respondents provide their total ‘operational’ capacity (e.g., fully employed, but with scheduled down-time for maintenance, product changeover, run failure, not a ‘theoretical’ capacity number.
This study methodology regarding capacity expansion is intended to provide directional information rather than quantitative volume analysis. In these annual studies we evaluate respondents' expectation of how much they believe they will increase their production capacity over the next 5-year period. As such, we are evaluating and averaging individuals' perception of their own facility activity. That is, we are measuring perception of near-term growth, rather than actual change in physical volume. For more information, visit www.bioplanassociates.com.
Footnotes
Previously published online as a mAbs E-publication: http://www.landesbioscience.com/journals/mabs/article/7802
References
- 1.Kohler G, Milstein C. Continuous cultures of fused cells secreting antibody of predefined specificity. Nature. 1975;256:495–497. doi: 10.1038/256495a0. [DOI] [PubMed] [Google Scholar]
- 2.Das RC, Morrow KJ. Antibody technologies rise to new challenges. Am Biotechnol Lab. 2007;25:9–11. [Google Scholar]
- 3.Butler M. Animal cell cultures: recent achievements and perspectives in the production of biopharmaceuticals. Appl Microbiol Biotechnol. 2005;68:283–291. doi: 10.1007/s00253-005-1980-8. [DOI] [PubMed] [Google Scholar]
- 4.5th Annual Report and Survey of Biopharmaceutical Manufacturing Capacity and Production. Bioplan Associates, Inc; 2008. [Google Scholar]
- 5.Source: US Federal Reserve Statistical Release, Industrial Production Capacity and Utilization. 2008
- 6.Source: US Federal Reserve Statistical Release, Industrial Production Capacity and Utilization. 2008. Nov 17, [2008]. http://www.federalreserve.gov/releases/G17/Current/
- 7.Ranshoff T. BioPharm International. 2007. According to industry data, by 2005, the biopharmaceutical contract manufacturing industry had grown to an estimated $1.5 billion. CMOs now hold between 15–29% of the industry-wide capacity for both mammalian cell culture and microbial fermentation. [Google Scholar]
- 8.Morin N, Stevens J. Diverging Measures of Capacity Utilization: An Explanation, Divisions of Research & Statistics and Monetary Affairs, Federal Reserve Board. Washington DC: 2004. [2009]. http://www.federalreserve.gov/pubs/feds/2004/200458/200458pap.pdf. [Google Scholar]


