Abstract
The Tagging/Retagging model of short term memory was introduced earlier (Tarnow in Cogn Neurodyn 2(4):347–353, 2008) to explain the linear relationship between response time and correct response probability for word recall and recognition: At the initial stimulus presentation the words displayed tag the corresponding long term memory locations. The tagging process is linear in time and takes about one second to reach a tagging level of 100%. After stimulus presentation the tagging level decays logarithmically with time to 50% after 14 s and to 20% after 220 s. If a probe word is reintroduced the tagging level has to return to 100% for the word to be properly identified, which leads to a delay in response time. This delay is proportional to the tagging loss. The tagging level is directly related to the probability of correct word recall and recognition. Evidence presented suggests that the tagging level is the level of depletion of the Readily Releasable Pool (RRP) of neurotransmitter vesicles at presynaptic terminals. The evidence includes the initial linear relationship between tagging level and time as well as the subsequent logarithmic decay of the tagging level. The activation of a short term memory may thus be the depletion of RRP (exocytosis) and short term memory decay may be the ensuing recycling of the neurotransmitter vesicles (endocytosis). The pattern of depleted presynaptic terminals corresponds to the long term memory trace.
Keywords: Short term memory, Exocytosis, Endocytosis, Memory trace
Introduction
Cognitive psychologists attempt to quantify the properties of short term memory.1 Unfortunately this work has not led to a theoretical convergence. Various models of memory stores have been introduced and survive in text books even though they may have been disproven (Cowan 1984). The lack of an accepted theory is due, in part, to a lack of connection of the cognitive literature to the details of the underlying biochemistry. Without this “harder science” connection it is difficult to convince various parts of the community of the supremacy of one theoretical model over another.
One way to make a connection from cognitive psychology to the underlying biochemistry is to look at functional forms and see whether a particular memory process may decay, for example, exponentially in time with a time constant that corresponds to a known biochemical reaction. In a recent contribution (Tarnow 2008) the current author showed that short term memory correct recall and recognition probabilities are linearly related to response times over a large time range (from 6 to 600 s). I interpreted this observation according to the Tagging/Retagging model of short term memory in which long term memory locations are tagged linearly in time. When the tagging level is 100% the subject has identified the word. As time passes the tagging level decays. For a subject to identify the word again the tagging level has to retutn to 100% leading to a delay in response time. The tagging level decay function is the same for recall and recognition and is logarithmic with time.
The current paper addresses what might be the biochemical underpinning of the tagging model and by extension short term memory. I start by describing the tagging model, the evidence for the tagging process being linear in time and the subsequent tagging decay being logarithmic in time. The underlying biochemical process needs the same two properties: (a) an active process linear in time with (b) a logarithmic decay time. I suggest that exocytosis, the process of depletion of presynaptic neurotransmitter vesicles corresponds to the tagging process and endocytosis, the process of rebuilding presynaptic neurotransmitter vesicles corresponds to the tagging level decay. A brief summary concludes the paper.
The tagging model
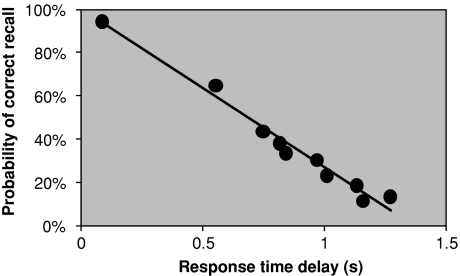
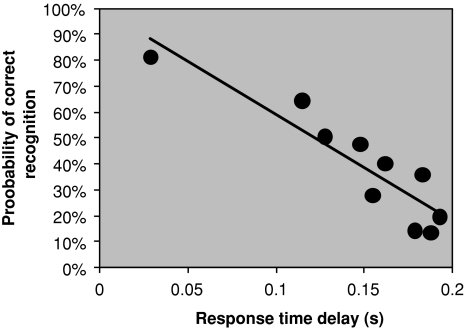
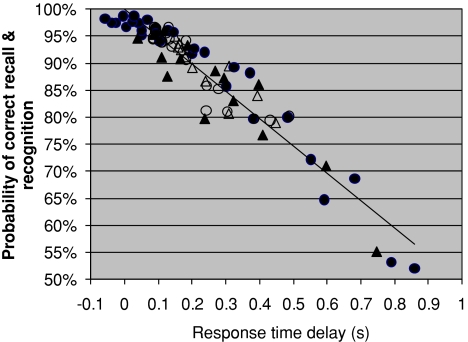
In Tarnow (2008), I pointed out the linear relationship between the probability of recall/recognition and response time in experiments testing recall/recognition of words (Rubin et al. 1999; Anderson 1981) (see linear relationships in Figs. 1, 2, 3). A recent item requires a short response time and an item almost forgotten requires a longer response time. The simplicity of the linear relationship suggests that it describes a core property of short term memory. I attempted to rationalize this relationship by introducing the Tagging/Retagging model of short term memory:
Fig. 1.
The probability of correct recall as a function of response time delay (see Tarnow 2008) (the overall response time for an item recalled with 100% probability has been subtracted)
Fig. 2.
Probability of correct recognition as a function of response time delay (see Tarnow 2008) (the overall response time for an item recalled with 100% probability has been subtracted)
Fig. 3.
Probability of correct recognition as a function of response time delay (unfilled symbols) and recall (filled symbols) from experiments on repeated learning (Anderson 1981) (see Tarnow (2008) for details. The overall response time for an item recalled with 100% probability has been subtracted)
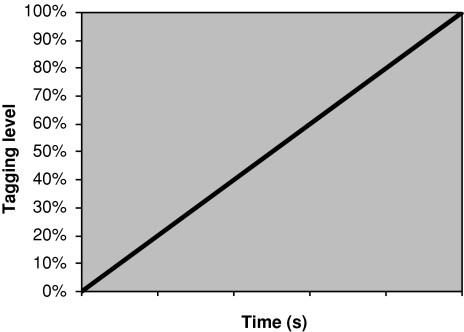
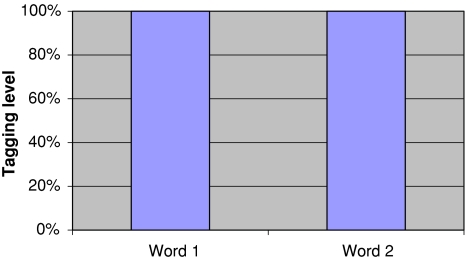
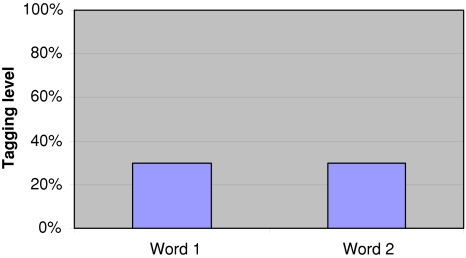
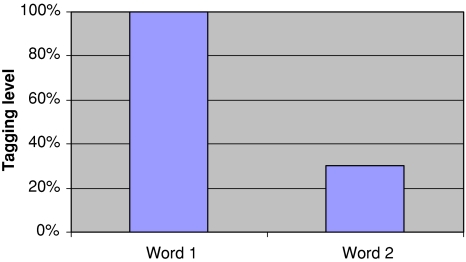
When presented with a word pair Word 1 and Word 2, a subject tags the words by marking long term memory locations. The tagging levels (probability of correct identification) for both words linearly increase with time (see Fig. 4) until they reach 100% (see Fig. 5). After the word is no longer displayed the tagging levels then slowly decay (Fig. 6). If Word 1 is reintroduced the tagging level of Word 1 goes back up (the same word is read again and subjected to the same procedure as the first time it was presented see Fig. 7). The retagging time can be inferred from the delay in the subject’s response. The probability of recalling Word 2 is given by the lower tagging level.
Fig. 4.
Tagging increases linearly with time
Fig. 5.
Initial tagging levels for recall experiment. A word pair is read in and forms a joint memory. Right after stimulus presentation both words are fully tagged
Fig. 6.
After 90 s the both words lost 70% of the tagging. Probability of finding either is the current tagging level of 30%
Fig. 7.
The display of recall prompt word 1 takes place at 90 s after stimulus presentation. Word 1 is now retagged. Word 2 is not retagged and the probability of finding it is still 30%
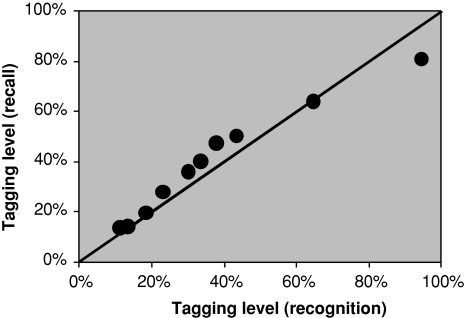
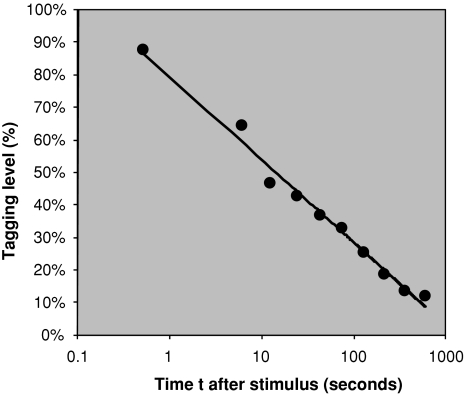
The tagging level decays equally fast for recognition and recall (see Fig. 8). In Fig. 9 is shown how the tagging level decays with time.2 It fits a logarithmic curve. The time for the tagging to decay to 50% is about 14 s. The time to drop to 20% is much longer—220 s—because of the logarithmic decay.
Fig. 8.
Recall and recognition tagging levels for the same delay times in Rubin et al. (1999). The line is the x = y function
Fig. 9.
Tagging remaining averaged over recall and recognition memory items from Anderson (1981). The curve represents a two parameter logarithmic fit, moving t = 0 to t = 0.5 s to avoid a divergence
The tagging model seems to explain the data. But any memory process is fundamentally one of biochemistry and the question arises, what could be the biochemical mechanism underlying the tagging model? We know that long term memory is related to long term synaptic changes presumably via protein synthesis (Kandel 2001). Short term behavior in aplysia can also be related to changes in the synapses: “serotonin leads to an increase in presynaptic cAMP, which activates PKA and leads to synaptic strengthening through enhanced transmitter release produced by a combination of mechanisms” (Kandel 2001). It is tempting to search for something that quickly tags synapses and more slowly untags them and does so in a reversible fashion.3 Such a system is the cycle of exocytosis and endocytosis of neurotransmitter vesicles in the presynaptic terminal.
The cycle of exocytosis and endocytosis
Neurotransmitter is stored in small vesicles in the presynaptic terminal (for introductions see Purves et al. 2004 pp. 105–107 and Shtrahman et al. 2005) and one can surmise that “all presynaptic functions, directly or indirectly, involve synaptic vesicles” (Sudhof 2004).4
When an action potential occurs in the presynaptic neuron, the Ca2+ channels open and in 10–20% of cases (Goda and Sudhof 1997; Dobrunz 2002) cause one (Dobrunz 2002) vesicle to fuse to the plasma membrane of the presynaptic terminal and open up a pore into the synaptic cleft and release neurotransmitter into the synaptic cleft (exocytosis). After repeated stimulation available vesicles in what is called the Readily Releasable Pool of vesicles (RRP, for reviews of the RRP see Besterman and Low 1983 and Sudhof 2004) can be depleted.
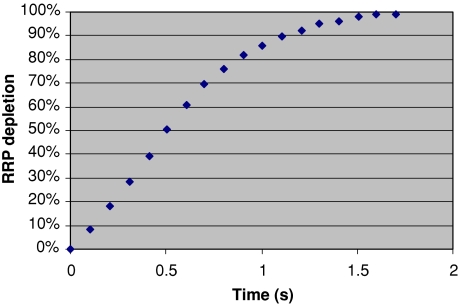
Exocytosis is a possible candidate for the tagging process. In Fig. 10 is shown the average time course for exocytosis (depletion of the Readily Releasable Pool (RRP) of neurotransmitter vesicles) in a rat hippocampal culture (Dobrunz 2002). It is quasi-linear and the overall time is a little over 1 s, consistent with the tagging time in the experiments quoted (calculated in Tarnow (2008) to range from 0.2 to 1.8 s). Full tagging corresponds to a state of the synapse in which the presynaptic neurons are no longer actively influencing the postsynaptic neuron, in effect, focusing the overall neural excitation corresponding to the recalled or recognized word.
Fig. 10.
Average time course of depletion of the RRP for 16 synapses, each normalized to its initial RRP size (Dobrunz 2002). Compare with Fig. 4
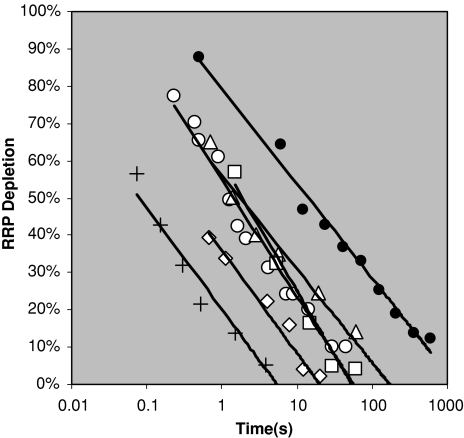
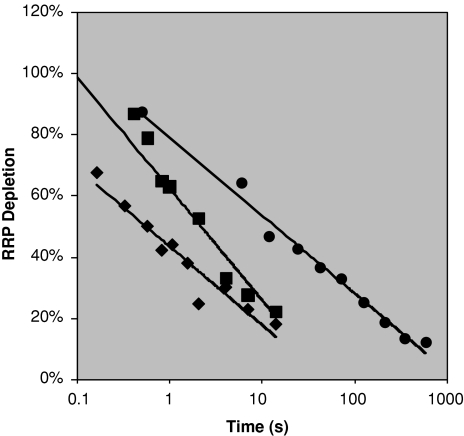
Endocytosis, the reversal of the RRP depletion, is a possible candidate for the tagging decay. Figure 11 displays the endocytosis of synaptic vesicles from a variety of paired-pulse experiments on hippocampal mouse synapses and one on the rat calyx of Held synapses. Included are also the tagging level decay curve from above. Experiments not included on this graph which do not fit straight lines were those on chromaffin (Smith et al. 1998) and mossy-fiber-CA3 synapses (Suyama et al. 2007). All other data sets investigated show a straight line5 and the slope is remarkably similar to the memory decay (0.11–0.14 s−1 for endocytosis experiments vs. 0.11 s−1 for the memory curve). There is a spread in the experimental offset this spread does not seem to overlap with the memory curve. The experimental curves are each averages over several synapses and it could be that the memory curve is determined by the synapses with the slowest response perhaps explaining the discrepancy in offset (see difference between a collection of fast and slow cells from Otsu et al. (2004) in Fig. 12) or that human synapses have a different offset than those of mice.6
Fig. 11.
Endocytosis from a variety of paired-pulse experiments. Filled circles indicate the tagging level decay from Fig. 9. Plus symbols show data from mouse inner hair cell, normalized by the current author to a total number of vesicles of 10, from Fig. 5 in Moser and Beutner (2000). Unfilled circles show data from autaptic synapses from a culture of mouse hippocampal CA1 and CA3 cells from Fig. 4C in Otsu et al. (2004). Unfilled diamonds show data from rat calyx of Held from Fig. 7D in Xu and Wu (2005). Unfilled triangles show data from hippocampal neurons from mouse fetuses according to Fig. 9A in Cabin et al. (2002). Unfilled squares show data from a culture of hippocampal synapses from newborn mice from Fig. 2A in Garcia-Perez and Wesseling (2008). All data can be well fitted with straight lines with similar slopes but there is a spread in offsets
Fig. 12.
Vesicle recovery from slow cells (filled squares) and fast cells (filled diamonds) from Otsu et al. (2004) with the tagging level from Fig. 9 in filled circles
In Fig. 13 is shown a pictorial representation of the Tagging/Retagging model in terms of synaptic exocytosis/endocytosis. A particular neuron is connected to other neurons (not shown) via a multitude of synapses. Before a word is read into memory the synapses have full RRPs and the surface areas of the synapses are minimal (see left panel). After a word is fully tagged the RRPs are emptied and the surface areas of the synapses are maximal (see right panel).
Fig. 13.
Stylized drawings of proposed short term memory. In the left panel is shown a neuron with synapses before tagging/exocytosis. In the right panel is shown the same neuron with expanded synapses after tagging/exocytosis (The synapses are shown as expanded since the vesicles fuse with the presynaptic membranes increasing their surface areas). In the right panel the neuron is part of a tagged long term memory trace
Summary
Exocytosis in a presynaptic terminal occurs until the action potentials have stopped or all the vesicles in the RRP have released their transmitter under prolonged firing of the action potentials. In the Tagging/Retagging model of short term recall and recognition, a word is read by a subject causing prolonged firing which depletes the RRPs in presynaptic terminals. The pattern of depleted presynaptic terminals represents the long term memory trace of the word and the depletion itself (the tagging) of this trace is the short term memory. After the action potential firing has slowed down, endocytosis causes the word to decay from short term memory. If the endocytosis is allowed to finish (the word is not read again and is not being rehearsed), the pattern of exhausted postsynaptic terminals becomes invisible and, in our model, the short term memory of the word is gone. The long term memory remains as the metastable pattern of the neuronal excitations. The evidence presented includes corresponding qualitative and quantitative functional forms for tagging (exocytosis) and tagging decay (endocytosis). The role of endocytosis argued for in this paper suggests that neurons exhibit self-focusing of excitations. Excitations likely start out less defined and then become more defined after prolonged excitation leads to complete endocytosis which creates all (inhibitory synapses) or nothing (excitatory synapses) situations for excitations traveling past the exhausted synapses. The end product of the self-focusing is the activated long term memory trace.
The self-focusing is consistent with my previous finding (Tarnow 2008) that meaningful words take longer to tag than nonsense words—the pattern of excitations would be larger and would likely to take longer to focus (just like the projections on the cortex is larger for fingers than for less meaningful toes).
Two other facts are consistent with exocytosis/endocytosis being short term memory. First, the failure to effect human memory below a certain exposure time has a parallel in the endocytosis. The time course of endocytosis of a variety of synapse (including hippocampal cultured synapses) is stimulus-dependent—the longer the stimulation the much longer the endocytosis takes (Sun and Wu 2001; Sun et al. 2002). Sun et al. (2002) found that the time for endocytosis was 56 ms after single-vesicle exocytosis but could increase to 8.3 s after longer stimulation suggesting that subliminal stimulation may only lead to an incomplete tagging (priming) that lasts a tenth of a second.7 Second, this split in short and long time scales of endocytosis is consistent with the evidence for two phases of short term memory (Cowan 1984).
I am proposing a link between a microscopic biochemical process (exocytosis and endocytosis) and macroscopic behavior (subjects reporting recall and recognition of words). One referee suggested a discussion of averaging effects that presumably occur as the scale increases. The parallel processing of the visual system, for example, decreases the signal noise and allows for more accuracy—the more rods and cones the better the visual acuity. It is not clear to me how the averaging would occur in the Tagging/Retagging model. If the model is correct, we do not know how many of the synapses are affected and whether the long term memory trace is one or several structures in a one, two, three or non-integer dimension. We also do not know whether the affected synapses are excitatory, inhibitory or both. Priming experiments in which a category is consciously or subliminally suggested to a subject seem to diminish the time to categorize subsequently displayed items of same category, thus suggesting a hierarchical organization. However, such a hierarchical organization has, as far as the author knows, not been demonstrated on the level of neural projections.
Appendix: The functional form of endocytosis
Typically the endocytosis curves are fit with two exponentials that each has an associated time constant with the hope in mind that there are one or perhaps two enzyme-catalyzed reactions with a corresponding well defined exponential decay constant. To check whether the customary double exponential fit is an appropriate fit, I tabulated some of the exponential fitting time constants for the experiments of Fig. 10 in Table 1. There seems to be little correlation of the different time constants suggesting that a double exponential fit is inappropriate.8 In contrast, the logarithmic fits of Fig. 11 give slopes that are very similar and thus seem more appropriate.
Table 1.
Time constants used to fit the RRP endocytosis curves of the various articles
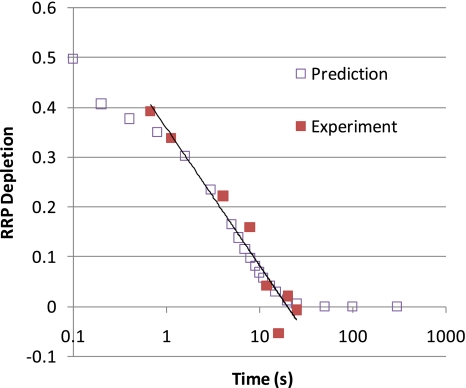
The correct functional form of the endocytosis curve can presumably be derived from the findings of Sun et al. (2002). They found that single-vesicle endocytosis occurs with a decaying exponential with the time constant of 56 ms (in young rat calyx of Held). When three or more vesicle were fused per active zone (with roughly 600 active zones in the calyx) then each vesicle added about 1,900 ms to the time constant (Sun et al. (2002) fitted 1,700 ms). If each active zone releases the same number of vesicles then the ensuing endocytosis is a sum of two exponentials—the fast 56 ms for the first two vesicles and then a slow 1,900 times the number of vesicles ms time constant for the subsequent vesicles. In Fig. 14 I show the experimental data from Garcia-Perez and Wesseling (2008) and compare it with the predicted data from a normal distribution causing an average of two vesicles to release per active zone with a standard deviation of one vesicle per active zone. The overlap is excellent.
Fig. 14.
Comparison between data on rat Calyx (Garcia-Perez and Wesseling 2008) and prediction based on a normal distribution of depleted RRP vesicles with average of two depleted vesicles and a standard deviation of one. The prediction used the constants fit from the data in Royle and Lagnado (2003)
I inquired into what change in parameters would cause the calyx curve to coincide with the memory decay curve from Fig. 9. One possibility is to increase the 1.9 s multiplicative time constant to 100 times the number of vesicles, another one is to increase the number of vesicles per active zone or increasing the average number of vesicles released after an action potential train.
Footnotes
For a review see Cowan (1997).
For the average of the two data sets calculated from Rubin et al (1999) and Anderson (1981) did not test memory as a function of time but as a function of repeated learning so it is not included.
If the changes are not reversible, it would be long term memory rather than short term memory.
Logarithmic decay—please see “Appendix” for a further discussion of the decay functional form.
The author is not aware of data on short term memory decay in mice or on endocytosis in human synapses.
The experimental results plotted in Fig. 11 result from complete depletion of the RRP, the predicted experimental results from incomplete depletion of the RRP in the rat Calyx is shown in Fig. 14.
There is a correlation of the fitted individual long and short time constants—the larger the short time constant, the exponentially larger becomes the large time constant. The author is not sure why that is.
References
- Anderson JR (1981) Interference: the relationship between response latency and response accuracy. J Exp Psychol [Hum Learn] 7:326–343. doi:10.1037/0278-7393.7.5.326 [DOI]
- Besterman JM, Low RB (1983) Endocytosis: a review of mechanisms and plasma membrane dynamics. Biochem J 210:1–13 [DOI] [PMC free article] [PubMed]
- Brown MW, Aggleton JP (2001) Recognition memory what are the roles of the perirhinal cortex and hippocampus? Nat Neurosci 2(1):51–61. doi:10.1038/35049064 [DOI] [PubMed]
- Cabin DE, Shimazu K, Murphy D, Cole NB, Gottschalk W, McIlwain KL, Orrison B, Chen A, Ellis CE, Paylor R, Lu B, Nussbaum RL (2002) Synaptic vesicle depletion correlates with attenuated synaptic responses to prolonged repetitive stimulation in mice lacking α-synuclein. J Neurosci 22:8797–8807 [DOI] [PMC free article] [PubMed]
- Cowan N (1984) On short, long auditory stores. Psychol Bull 6:341–370 [DOI] [PubMed]
- Cowan N (1997) Attention and memory: an integrated framework. Oxford University Press, Oxford
- Dobrunz LE (2002) Release probability is regulated by the size of the readily releasable vesicle pool at excitatory synapses in hippocampus. Int J Dev Neurosci 20:225–236. doi:10.1016/S0736-5748(02)00015-1 [DOI] [PubMed]
- Garcia-Perez E, Wesseling JF (2008) Augmentation controls the fast rebound from depression at excitatory hippocampal synapses. J Neurophysiol 99:1770–1786. doi:10.1152/jn.01348.2007 [DOI] [PubMed]
- Goda Y, Sudhof TC (1997) Calcium regulation of neurotransmitter release: reliably unreliable? Curr Opin Cell Biol 9(4):513–518. doi:10.1016/S0955-0674(97)80027-0 [DOI] [PubMed]
- Hagler DJ, Goda Y (2001) Properties of synchronous, asynchronous release during pulse train depression in cultured hippocampal neurons. J Neurophysiol 85:2324–2334 [DOI] [PubMed]
- Kandel ER (2001) The molecular biology of memory storage a dialogue between genes and synapses. Science 294:1030–1038 [DOI] [PubMed]
- Moser T, Beutner D (2000) Kinetics of exocytosis and endocytosis at the cochlear inner hair cell afferent synapse of the mouse. Proc Natl Acad Sci USA 97:883–888. doi:10.1073/pnas.97.2.883 [DOI] [PMC free article] [PubMed]
- Otsu Y, Shahrezaei V, Li B, Raymond LA, Delaney KR, Murphy TH (2004) Competition between phasic and asynchronous release for recovered synaptic vesicles at developing hippocampal autaptic synapses. J Neurosci 24:420–433. doi:10.1523/JNEUROSCI.4452-03.2004 [DOI] [PMC free article] [PubMed]
- Purves D, Augustine GJ, Fitzpatrick D, Hall WC, LaMantia A-S, McNamara JO, Williams SM (2004) Neuroscience, 3rd edn. Sinauer Associates, Sutherland
- Royle L, Lagnado SJ (2003) Endocytosis at the synaptic terminal. J Physiol 553:345–355. doi:10.1113/jphysiol.2003.049221 [DOI] [PMC free article] [PubMed]
- Rubin DC, Hinton S, Wenzel A (1999) The precise time course of retention. J Exp Psychol Learn Mem Cogn 25:1161–1176. doi:10.1037/0278-7393.25.5.1161 [DOI]
- Shtrahman M, Yeung C, Nauen DW, Bi G-q, Wu X-l (2005) Probing vesicle dynamics in single hippocampal synapses. Biophys J 89:3615–3627. doi:10.1529/biophysj.105.059295 [DOI] [PMC free article] [PubMed]
- Smith C, Moser T, Xu T, Neher E (1998) Cytosolic Ca2+ acts by two separate pathways to modulate the supply of release-competent vesicles in chromaffin cells. Neuron 20:1243–1253 [DOI] [PubMed]
- Sudhof TC (2004) The synaptic vesicle cycle. Annu Rev Neurosci 27:509–547. doi:10.1146/annurev.neuro.26.041002.131412 [DOI] [PubMed]
- Sun J-Y, Wu L-G (2001) Fast kinetics of exocytosis revealed by simultaneous measurements of presynaptic capacitance, postsynaptic currents at a central synapse. Neuron 30:171–182. doi:10.1016/S0896-6273(01)00271-9 [DOI] [PubMed]
- Sun J-Y, Wu X-S, Wu L-G (2002) Single and multiple vesicle fusion induce different rates ofendocytosis at a central synapse. Nature 417:555–559. doi:10.1038/417555a [DOI] [PubMed]
- Suyama S, Hikima T, Sakagami H, Ishizuka T, Yawo H (2007) Synaptic vesicle dynamics in the mossy fiber-CA3 presynaptic terminals of mouse hippocampus. Neurosci Res 59:481–490 [DOI] [PubMed]
- Tarnow E (2008) Response probability and response time: a straight line, the Tagging/Retagging interpretation of short term memory, an operational definition of meaningfulness and short term memory time decay and search time. Cogn Neurodyn 2(4):347–353 [DOI] [PMC free article] [PubMed]
- Xu J, Wu L-G (2005) The decrease in the presynaptic calcium current is a major cause of short-term depression at a calyx-type synapse. Neuron 46:633–645. doi:10.1016/j.neuron.2005.03.024 [DOI] [PubMed]


