

Abstract
This report presents the strategies underlying the automated identification and quantification of individual lipid molecular species through array analysis of multi-dimensional mass spectrometry-based shotgun lipidomics (MDMS-SL) data which are acquired directly from lipid extracts after direct infusion and intrasource separation. The automated analyses of individual lipid molecular species in the program employ a strategy where MDMS-SL data from building block analyses using precursor-ion and/or neutral loss scans are used to identify individual molecular species followed by quantitation. Through this strategy, the program screens and identifies species in a high throughput fashion from a built-in database of over 36,000 potential lipid molecular species constructed employing known building blocks. The program then uses a two-step procedure for quantitation of the identified species possessing a linear dynamic range over three orders of magnitude and re-verifies the results when necessary through redundant quantification of multi-dimensional mass spectra. This program is designed to be easily adaptable for other shotgun lipidomics approaches which are currently used for mass spectrometric analysis of lipids in the field. Accordingly, the development of this program should greatly accelerate high throughput analysis of lipids using MDMS-based shotgun lipidomics.
Keywords: Automation, high throughput, intrasource separation, lipidomics, multidimensional mass spectrometry, shotgun lipidomics
In the current practice of lipidomics, multi-dimensional mass spectrometry (MDMS)-based shotgun lipidomics (MDMS-SL)1-3 is a well-recognized platform to analyze individual lipid molecular species directly from lipid extracts of biological samples. Through exploiting the unique chemistries of different lipid classes in MDMS-SL the need for chromatography is largely replaced for even extremely low abundant molecular species. For example, differential hydrophobicity and differential sensitivity to base treatment are exploited during a multiplexed extraction approach4. Through exploiting the differential electrical properties of lipid classes to selectively ionize a certain category of lipid classes under multiplexed experimental conditions the intrasource separation of the many lipid classes is accomplished analogous to the electrophoretic separation of different compounds possessing different pI values5.
The unique chemical structure of the majority of lipid molecular species is comprised of linear combinations of a small number of building blocks that include backbones, head groups, and aliphatic chains1, 6. We have exploited these building blocks through the use of two powerful tandem MS techniques (i.e., neutral loss scan (NLS) and precursor-ion scan (PIS)) in a mass-ramp fashion and developed MDMS to identify individual lipid molecular species1, 7. MDMS is totally analogous to multi-dimensional nuclear magnetic resonance (NMR) spectroscopy except that axes of mass in MDMS instead of frequency in NMR are routinely used1. In MDMS, the use of crossed peaks of the scanned fragments (i.e., lipid building blocks) with any given molecular ion allows us to determine the molecular identities of ions without individual fragmentation of each ion1, 6.
Moreover, the uniqueness of individual lipid classes can be exploited to identify and quantify the individual molecular species of the lipid class of interest. For example, the presence of two phosphate moieties in the cardiolipin chemical structure is unique, which is reflected as doubly-charged ions in mass spectra acquired under certain conditions8. By searching the [M − 2H + 1]2- isotopologues from the resulting doubly-charged ion pattern of cardiolipin species, recognition of cardiolipin molecular species can be readily achieved. The presence of a primary amine in phosphoethanolamine-containing molecular species is also unique in the cellular lipidome and has been exploited to tag the phosphoethanolamine-containing lipid molecular species using fluorenylmethoxylcarbonyl (Fmoc) chloride9. The facile loss of Fmoc from the tagged lipid molecular species allowed us to readily identify these species with unprecedented sensitivity.
After collision-induced dissociation (CID), the majority of lipid classes possess a unique fragment pattern that can usually be predicted based upon the covalent structures of these lipid classes. The fragment ion(s) resulting either from the head group or after the neutral loss of the head group are usually diagnostic of the lipid class of interest, and PIS or NLS, respectively, is employed to identify the individual molecular species. These diagnostic ions are exploited not only for identification, but also for quantification through direct comparison of the peak intensity of an ion with that of the selected standards (i.e., ratiometric comparison) in the same mass spectrum in MDMS-SL. Unlike the source ionization of individual molecular species in a class of interest, the CID process depends on the chemical structure of each individual ionized molecular species10, 11. This is largely because the source ionization mainly depends on the electrical properties of the analytes while CID fragmentation is dependent upon their kinetic and thermodynamic properties. This fact has led us to establish a two-step method for quantitation of the identified individual lipid molecular species3, 4, 7, 12. In this two-step methodology, the molecular species of the class of interest that are abundant and not overlapping with species in any other classes are quantified by ratiometric comparison with the selected internal standard of the class by using a full MS scan. Then, some or all of these quantified molecular species plus the original internal standard are employed as standards to quantitate other low abundance and/or overlapped molecular species in the class by using one or more class-specific PIS and/or NLS. Using this two-step methodology, the dynamic range of quantitation can be increased by at least two orders of magnitude as previously demonstrated13 and now can routinely performed through automated bioinformatic analyses as described herein.
In theory, all these processes used in MDMS-SL, except multiplexed sample preparations, can be achieved with a computer-aided program. In practice, such a program for automated identification and quantitation of individual lipid molecular species in a cellular lipidome using MDMS-SL has only been briefly discussed previously3 and used only in our own laboratories. Herein, we describe the strategies underlying this program (hereafter called AMDMS-SL (automation of multi-dimensional mass spectrometry-based shotgun lipidomics)) to facilitate the understanding of the processes employing MDMS-based shotgun lipidomics. AMDMS-SL will be made accessible through our website (www.shotgunlipidomics.com).
Multiple algorithms/programs have previously been reported in the literature based on other strategies or platforms than MDMS-SL for identification and/or quantification of certain lipid classes and individual molecular species14-21. However, MDMS-SL has been developed as a unique, but much broader technology from the multiplexed sample preparation to the two-step quantitation as discussed above. AMDMS-SL may share some aspects with these previously published programs to a certain degree (e.g., deisotoping of ion peaks, uploading molecular species information from a database, etc). This makes AMDMS-SL easily adaptable for the other programs, particularly those developed based on shotgun lipidomics approaches. Accordingly, high throughput, non-targeted global lipidomic analysis should be greatly accelerated with the development of this program.
Materials and Methods
Materials
All internal standards are purchased from Avanti Polar Lipids, Inc. (Alabaster, AL), Matreya, Inc. (Pleasant Gap, PA), or Nu Chek, Inc (Elysian, MN) as previously specified22. All the solvents were obtained from Burdick and Jackson (Honeywell International Inc., Muskegon, MI). All other chemicals were purchased from Sigma-Aldrich (St. Louis, MO).
Preparation of Lipid Extracts from Biological Samples
All lipid extracts from mouse tissue samples were prepared as described previously22. Each individual lipid extract was reconstituted with a volume of 500 μl/mg of protein in 1:1 CHCl3/MeOH. The lipid extracts were finally flushed with nitrogen, capped, and stored at -20 °C for ESI/MS (typically analyzed within one week) as previously described22.
Mass Spectrometric Analysis of Lipids
A TSQ Quantum Ultra Plus triple-quadrupole mass spectrometer (Thermo Fisher Scientific, San Jose, CA) equipped with an automated nanospray apparatus (i.e., Nanomate HD, Advion Bioscience Ltd., Ithaca, NY) and Xcalibur system software were utilized in the study13. Ionization voltages of -1.1, -0.95, and +1.2 kV and gas pressures of 0.3, 0.15, and 0.3 psi were employed on the nanomate apparatus for the analyses of anionic lipids, PE, and PC, respectively. The nanomate was controlled by Chipsoft 7.2.0 software. Each lipid extract solution prepared above was diluted to less than 50 pmol of total lipids/μl with CHCl3/MeOH/isopropanol (1:2:4 by volume) prior to infusion to the mass spectrometer with the nanomate. This concentration was estimated based on the protein content and the total lipid content that is normalized to protein content from prior studies or previous experience. This procedure uses low concentrations of lipid to prevent lipid aggregation during analysis and to minimize any effects of residual inorganic components carried over during lipid extraction on ion suppression and/or chemical noise.
The first and third quadrupoles were used as independent mass analyzers with a mass resolution setting of 0.7 Thomson while the second quadrupole served as a collision cell for tandem mass spectrometry. Typically, a 1 to 2-min period of signal averaging in the profile mode was employed for each full MS scan. For tandem mass spectrometry, a collision gas pressure was set at 1.0 mTorr but the collision energy varied with the classes of lipids as indicated or described previously3, 7. For each tandem MS mass spectrum, a 2 to 5-min period of signal averaging in the profile mode was employed. All the full MS scans and tandem MS scans were automatically acquired by a customized sequence subroutine operated under Xcalibur software. Data from biological samples were normalized to the protein content and all data are presented as the mean ± SD of multiple samples from different animals.
Results and Discussion
Establishment of the Database of Lipid Classes and Individual Molecular Species for MDMS-Based Shotgun Lipidomics
MDMS-SL analyzes lipid molecular species in a non-targeted approach. Therefore, the database for MDMS-SL should be as broad and flexible as possible. The former is to cover all possible naturally occurring lipid molecular species, while the latter is to allow one to modify or expand the database as necessary. The molecular species that potentially exist in a cellular lipidome, but are below the limit of detection of a method or an instrument at the current level of sensitivity are eliminated during the identification stage leaving a set of hundreds to thousands of peaks of sufficient intensity with appropriate internal standards to analyze (see below).
MDMS-SL extensively employs the building block concept regarding lipid molecular structures (see Introduction). The built-in database of the program is also constructed using the building blocks of lipids. Based on the differences of these building blocks, the majority of lipid classes present in the mammalian cellular lipidomes are classified into five categories including glycerophospholipids, glycerolipids, sphingolipids, sterols, and metabolites (Tables 1 and S1-S4).
Table 1.
A schematic representation of the database used for glycerophospholipidsa
| Lipid class | Lipid subclasses | Backbone | Head group (Building block III) | Side chains (Building blocks I & II) | Sum formula | Negative ion mode | Positive ion mode | Number of possible speciesb |
|---|---|---|---|---|---|---|---|---|
| PC | diacyl PC | C3H5O3 | C5H13O3PN | CmH2m-2n-2O2 | Cm+8H2m-2n+16O8PN | [M+Cl]- | [M+Li]+, [M+Na]+ | 314 |
| alkenyl-acyl PC | CmH2m-2n-2O | Cm+8H2m-2n+16O7PN | 314 | |||||
| alkyl-acyl PC | CmH2m-2nO | Cm+8H2m-2n+18O7PN | 314 | |||||
| PE | diacyl PE | C2H7O3PN | CmH2m-2n-2O2 | Cm+5H2m-2n+10O8PN | [M-H]-, [M-H+Fmoc]-(i.e., [M+C15H9O2]-) | 314 | ||
| alkenyl-acyl PE | CmH2m-2n-2O | Cm+5H2m-2n+10O7PN | 314 | |||||
| alkyl-acyl PE | CmH2m-2nO | Cm+5H2m-2n+12O7PN | 314 | |||||
| PS | diacyl PS | C3H7O5PN | CmH2m-2n-2O2 | Cm+6H2m-2n+10O10PN | [M-H]- | 314 | ||
| alkenyl-acyl PS | CmH2m-2n-2O | Cm+6H2m-2n+10O9PN | 314 | |||||
| alkyl-acyl PS | CmH2m-2nO | Cm+6H2m-2n+12O9PN | 314 | |||||
| PG | C3H8O5P | CmH2m-2n-2O2 | Cm+6H2m-2n+11O10P | [M-H]- | 314 | |||
| PI | C6H12O8P | CmH2m-2n-2O2 | Cm+9H2m-2n+15O13P | [M-H]- | 314 | |||
| PA | H2O3P | CmH2m-2n-2O2 | Cm+3H2m-2n+5O8P | [M-H]- | 314 | |||
| lysoPC | acyl-LPC | C5H13O3PN | CmH2m-2nO | Cm+8H2m-2n+18O7PN | [M+Cl]- | [M+Li]+, [M+Na]+ | 82 | |
| alkenyl-LPC | CmH2m-2n | Cm+8H2m-2n+18O6PN | 82 | |||||
| alkyl-LPC | CmH2m-2n+2 | Cm+8H2m-2n+20O6PN | 82 | |||||
| lysoPE | acyl-LPE | C2H7O3PN | CmH2m-2nO | Cm+5H2m-2n+12O7PN | [M-H]-, [M-H+Fmoc]-(i.e., [M+C15H9O2]) | 82 | ||
| alkenyl-LPE | CmH2m-2n | Cm+5H2m-2n+12O6PN | 82 | |||||
| alkyl-LPE | CmH2m-2n+2 | Cm+5H2m-2n+14O6PN | 82 | |||||
| lysoPS | acyl-LPS | C3H7O5PN | CmH2m-2nO | Cm+6H2m-2n+12O9PN | [M-H]- | 82 | ||
| alkenyl-LPS | CmH2m-n | Cm+6H2m-2n+12O8PN | 82 | |||||
| alkyl-LPS | CmH2m-2n+2 | Cm+6H2m-2n+14O8PN | 82 | |||||
| lysoPG | C3H8O5P | CmH2m-2nO | Cm+6H2m-2n+13O9P | [M-H]- | 82 | |||
| lysoPI | C6H12O8P | CmH2m-2nO | Cm+9H2m-2n+17O12P | [M-H]- | 82 | |||
| lysoPA | H2O3P | CmH2m-2nO | Cm+3H2m-2n+7O7P | [M-H]- | 82 | |||
| CL | (C3H5O3)2 | C3H8O7P2 | CmH2m-2n-4O4 | Cm+9H2m-2n+14O17P2 | [M-2H]2- | 1081 | ||
| mono-lysoCL | (C3H5O3)2 | C3H8O7P2 | CmH2m-2n-2O3 | Cm+9H2m-2n+16O16P2 | [M-2H]2- | 622 | ||
| Total | 6455 | |||||||
The database is constructed with the building blocks I, II, and III in glycerophospholipids as indicated in Scheme 1A by using the variables m and n. The variable m represents the number of total carbon atoms of acyl chains (m = 12 – 26, 24 – 52, 36 – 78, and 48 – 104 for species having one, two, three, and four fatty acyl chains, respectively) while the variable n represents the number of total double bonds of the acyl chains (n = 0 – 7, 0 – 14, 0 – 21, and 0 – 28 for species having one, two, three, and four fatty acyl chains, respectively). The ion modes indicate the ionization mode(s) used to analyze the indicated lipid class in MDMS-SL.
The regioisomers and the isomers resulting from the different locations of double bond(s) are not considered. The number of molecular species are calculated based on the naturally occurring fatty acids containing the highest degree of unsaturation for acyl chains of 12 – 26 carbon atoms are 12:1, 13:1, 14:3, 15:3, 16:5, 17:3, 18:5, 19:3, 20:6, 21:5, 22:7, 23:5, 24:7, 25:6, and 26:7 respectively that were previously identified.
Glycerol in which three protons are replaced with building blocks (C3H5O3) is the characteristic backbone for all lipid classes in the categories of both glycerophospholipids (Scheme 1A) and glycerolipids (Scheme 1B). The phosphodiester-containing head group (Column 4 of Table 1) linked to the oxygen atom of glycerol at its sn-3 position is a class-specific building block (i.e., building block III) in the glycerophospholipid classes (Column 1 of Table 1). The difference between glycerolipids and glycerophospholipids is that the building block of glycerolipids at this position is not a phosphodiester, but either an aliphatic chain in triglycerides (TG), a proton or an aliphatic chain in diglycerides (DG) and monoglycerides (MG) (which is combined into the side chain building blocks (Column 5 of Table S1)), or a hexosyl moiety (Column 4 of Table S1) in glycolipids.
Scheme 1.

The general structures of glycerophospholipid, glycerolipid, and sphingolipid with building blocks.
The oxygen atom of glycerol at sn-1 position is connected to an aliphatic chain (i.e., building block I) through an ester, ether, or vinyl ether bond in both glycerophospholipids and glycerolipids. These different linkages define the subclasses (Column 2 of Table 1) of a glycerophospholipid class, which are called phosphatidyl-, plasmanyl-, and plasmenyl- according to the IUPAC-recommended nomenclature, corresponding to the ester, alkyl ether, and vinyl ether linkage, respectively. Thus, these subclasses are abbreviated as prefix “d”, “a”, and “p” throughout the paper. To date, the plasmanyl and plasmenyl subclasses have only been identified in choline, ethanolamine, and serine glycerophospholipids (PC, PE, and PS, respectively) in mammalian lipidomes. These different linkages have also been found in DG and TG23. Therefore, the subclasses of both DG and TG are also considered in the study and are separately listed (Column 2 of Table S1). This aliphatic building block varies with the number of carbon atoms and the number of double bonds as well as the location of double bonds in the aliphatic chains. In the current study, identification of the location of double bonds is not considered. However, methods for their identification have been previously reported24, 25.
The building block replacing the proton at the sn-2 position of glycerol (i.e., building block II) is usually a fatty acyl chain in all lipid classes of both glycerophospholipids and glycerolipids except the proton may still exist in the classes of DG and MG (see below for the case of lysoglycerophospholipids). Again, this building block of fatty acyl chain varies with the number of carbon atoms and the number of double bonds as well as the location of double bonds in the aliphatic chains. We combined building blocks I and II for each subclass of an individual glycerophospholipid class as well as monohexosyl diacylglycerol and combined building blocks I, II and III for MG, DG and TG classes with variables of m and n (representing m carbon atoms and n double bonds, respectively, in these two or three building blocks) (Column 5 of Tables 1 and S1)). Accordingly, the entire subclass of molecular species in each individual aforementioned lipid class can be represented by these two variables of m and n (Column 6 of Tables 1 and S1).
A database of molecular species for each individual lipid class including total carbon atoms, total double bonds, chemical formulas, accurate monoisotopic mass, and others can be constructed with the two variables of m and n. An example of the database of PI molecular species is given with m varying from 24 to 52 carbon atoms and n varying from 0 to 14 double bonds (Table S5 of the supplementary materials). The classes of lysophospholipids are the special cases of the glycerophospholipid classes. The database of each lysophospholipid class, therefore, is constructed with its corresponding glycerophospholipid class (Table 1).
Similar to the glycerophospholipids, sphingolipids can also be interrogated using three building blocks (Scheme 1C) (see previous reviews6, 26 for detailed structures). The building block I represents a different polar moiety (linked to the oxygen at the C1 position of the sphingoid base) including hydrogen, phosphoethanolamine, phosphocholine, galactose, glucose, lactose, sulfated galactose, and other complex sugar groups (corresponding to ceramide, ceramide phosphoethanolamine, sphingomyelin, galactosylceramide, glucosylceramide, lactosylceramide, sulfatide, and other glycosphingolipids such as gangliosides, respectively). The building block II represents fatty acyl chains (acylated to the primary amine at the C2 position of the sphingoid base) with or without the presence of a hydroxyl group which is usually located at the α- or occasionally ω-position. The building block III are parts of the different aliphatic chains in all possible sphingoid bases, which are linked by a carbon-carbon bond at the C3 position of the sphingoid bases and vary with the aliphatic chain length, the degree of unsaturation, the presence of branch, and the presence of an additional hydroxyl group.
However, in distinction to ions resulting from glycero(phospho)lipid classes, the presence of the sphingoid base is essential for all sphingolipid molecular species (Column 4 of Table S2). Therefore, the database of each sphingolipid class contains four variables for both sphingoid base (i.e., building block III, x and y) and fatty acyl amide chain (i.e., building block II, m and n). Variables x and m account for carbon atoms in the sphingoid base and fatty acyl chain, respectively, while y and n are the corresponding numbers of the double bonds. Commonly, a hydroxyl group may be present at the α- (or occasionally ω-) position of the fatty acyl chain. This feature usually classifies each sphingolipid class into two subclasses (Columns 2 and 6 of Table S2). Accordingly, the molecular species of each subclass of each individual sphingolipid class are represented by the four variables of x, y, m, and n (Column 7 of Table S2) in the program.
The constructed formulas of the majority of sphingolipid classes which are potentially present in lipid extracts of mammalian samples are summarized (Table S2). A database of molecular species for each individual sphingolipid class including carbon atoms and double bonds in both sphingoid base and fatty acyl chain, chemical formulas, accurate monoisotopic mass, and others can be constructed with the variables of m (varying from 12 to 26 carbon atoms), n (varying from 0 to 7 double bonds), × (varying from 11 to 19 carbon atoms), and y (varying from 0 to 2 double bonds).
Gangliosides are not included in Table S2 since these classes of sphingolipids are present in the aqueous phase during Bligh and Dyer or Folch extraction and since the methods for quantitative analyses of ganglioside molecular species in shotgun lipidomics are still in development. The low abundant metabolites of the listed sphingolipid classes including sphingosine and its analogs, sphingoid base-1-phosphate, psychosine, and other lysosphingolipid classes are handled as special cases of ceramide, ceramide-1-phosphate, galactosylceramide, and other corresponding sphingolipid classes, respectively. It should be particularly noted that although, with the sensitivity of current commercially-available instruments, only sphingosine and sphinganine analogs of these metabolites can be determined, the other sphingoid based analogs have been incorporated into the database.
The majority of molecular species in sterol lipids can be constructed with the cholesterol ring as a backbone. Specifically, replacement of a proton at the sterol ring with a hydroxyl accounts for some common oxysterols which can be represented with an addition of an oxygen atom to the formula of cholesterol. Replacement of the proton of the hydroxyl group of cholesterol with a fatty acyl chain forms the class of cholesteryl ester molecular species which can be represented by a formula combining cholesterol backbone and the acyl chain (CmH2m-2n-1O), where m and n account for the carbon atoms and the double bonds in each fatty acyl chain as described above. By varying m (12 to 26) and n (0 to 7), a database of cholestery esters is constructed in the program (Table S3).
Solvent-extractable and relatively abundant metabolites which are not included in other categories of lipids as described above include free fatty acids, fatty acyl carnitines, and fatty acyl-CoAs. The fatty acyl chains are the fundamental building blocks of the molecular species in these lipid classes. Therefore, a general formula of molecular structure with the varied carbon atoms (m) and double bonds (n) in fatty acyl chains can be given for each of these metabolites (Table S4). It should be pointed out that since it has previously been shown that incomplete β-oxidation of fatty acids is present in mitochondria under some physiological conditions, the fatty acyl chains in acyl carnitines and acyl-CoAs may carry a hydroxy moiety27. It is convenient to classify the classes of fatty acyl carnitine and acyl-CoA into two subclasses with or without the presence of a hydroxy group at the α-position of the fatty acyl chains.
In summary, the molecular species which are included in the databases of the program are approximately 6,500 glycerophospholipid species, 3,200 glycerolipid species, 26,000 sphingolipid species, 100 sterol lipids, and 410 metabolites. Therefore, a total of over 36,000 molecular species, not counting regioisomers, oxidized lipids or other covalently modified entities, are included in the initial construction of the database of the program (Tables 1, and S1-S4). Moreover, by modifying the general chemical formulas, the constructed databases can be easily extended to cover any new species and/or subclasses in each lipid class when the sensitivity of mass spectrometers is further improved and/or any unusual lipid profiles are analyzed from a biological sample.
Automated Identification of Individual Molecular Species of a Class of Interest present in a Cellular Lipidome
In AMDMS-SL, identification of individual lipid molecular species is performed using an individual lipid class. This is achieved by using the following three determinants unless otherwise specified. First, each lipid class or category is selectively ionized through intrasource separation which has been previously described5 and outlined in the introduction. Second, a full MS scan detecting the precursor ions corresponding to the molecular species of a class of interest is specifically acquired in the appropriate mass region. Finally, when a low mass accuracy/unit mass resolution mass spectrometer (e.g., QqQ) or a moderately high mass accuracy/high mass resolution mass spectrometer (e.g., QqTOF)16, 28 is employed, multiple PIS and/or NLS related to the lipid class(es) of interest are acquired in the mass regions (Table 2), among which one or more PIS or NLS are sensitive and specific to the lipid class or the category of lipid classes of interest (Table 2). When a sensitive and specific PIS or NLS to a lipid class or a category of lipid classes of interest is absent (which is rare), a special method was developed as described previously2, 8, 10. The full MS scan and the set of PIS and/or NLS are referred to as to the 2D mass spectrometric data (Scheme 2) since these scans are used to construct a 2D mass spectrum as previously described1 and as exemplified below. When a high mass accuracy/high mass resolution mass spectrometer such as Orbitrap or FTMS is available for lipid analysis, the full MS scan with high mass accuracy (e.g., < 5 ∼ 10 ppm for most lipid classes) can be used to replace the above mentioned specific PIS or NLS as previously demonstrated29 (Scheme 2).
Table 2.
Summary of the building blocks in each lipid class used to identify individual molecular speciesa
| Lipid classrefs. | Ion format | Scans for class specific prescreen | Scans for identification of acyl chain and/or regioisomers | Primary scans for the second step quantitation |
|---|---|---|---|---|
| PC34 | [M+Li]+ | NLS189.1, -35eV | NLS(59.0+FA), -40eV | NLS183.1, -35eV for polyunsaturated acyl chain containing species NLS59.0, -24eV for plasmalogen species NLS189.1, -35eV for all the other species |
| lysoPC34 | [M+Na]+ | NLS59.0, -22eV | PIS104.1, -34eV | NLS59.0, -22eV |
| NLS205.0, -34eV | PIS147.1, -34eV | NLS205.0, -34eV | ||
| PE, lysoPE9 | [M-H]- | PIS196.1, 50eV for [M-H]- | ||
| [M-H+Fmoc]- ([M+C15H9O2]-) | NLS222.2, 30eV | PIS(FA-H), 30eV | NLS222.2, 30eV for [M-H+Fmoc]- | |
| PI, lysoPI3 | [M-H]- | PIS241.1, 45eV | PIS(FA-H), 47eV | PIS241.1, 45eV |
| PS, lysoPS3 | [M-H]- | NLS87.1, 24eV | PIS(FA-H), 30eV | NLS87.1, 24eV |
| PG, PA, lysoPG, lysoPA3 | [M-H]- | PIS153.1, 35eV | PIS(FA-H), 30eV | PIS153.1, 35eV |
| CL, mono-lysoCL8 | [M-2H]2- | Full MS at high resolution | PIS(FA-H) at high resolution, 25eV; NLS(FA-H2O) at high resolution, 22eV |
|
| TG2 | [M+Li]+ | NLS(FA), -35eV | ||
| Sphingomyelin34 | [M+Li]+ | NLS213.2, -50eV | NLS(neutral fragments from sphingoid backbone) | NLS213.2, -50eV |
| Ceramide10 | [M-H]- | NLS(neutral fragments from sphingoid backbone), (e.g., NLS256.2, 32eV for d18:1 non-hydroxyl species) | NLS(neutral fragments from sphingoid backbone), (e.g., NLS256.2, 32eV for d18:1 non-hydroxyl species) | NLS(neutral fragments from sphingoid backbone), (e.g., NLS256.2, 32eV for d18:1 non-hydroxyl species) |
| Hexosyl ceramide37, 38 | [M+Li]+ | NLS162.2, -50eV | NLS(neutral fragments from sphingoid backbone) | NLS162.2, -50eV |
| Sulfatide39 | [M-H]- | PIS 97.1, 65eV | NLS(neutral fragments from sphingoid backbone) | PIS97.1, 65eV |
| Sphingoid base-1-phosphate40 | [M-H]- | PIS79.1, 24eV | PIS79.1, 24eV | |
| Sphingoid base4 | [M+H]+ | NLS48.0, -18eV | NLS48.0, 18eV | |
| Psychosine41 | [M+H]+ | NLS180.0, -24eV | NLS180.0, -24eV | |
| Cholesterol12 | [cholesteryl methoxyacetate +MeOH+Li]+ | PIS97.1, -22eV | PIS97.1, -22eV | |
| Acyl carnitine27 | [M+H]+ | PIS85.1, -30eV | PIS85.1, -30eV for all species; PIS145.1, -30eV for hydroxyl species |
PIS85.1, -30eV |
| Acyl-CoA42 | [M-H]-, [M-2H]2- [M-3H]3- | PIS134.0, 30eV | PIS134.0, 30eV | PIS134.0, 30eV |
NLS and PIS stand for neutral loss scan and precursor ion scan, respectively. FA and (FA-H) denote free fatty acid and fatty acyl carboxylate anion, respectively. The abbreviations of phospholipid classes are given in the text.
Scheme 2.

A schematic of the workflow used in AMDMS-SL to identify individual molecular species in a lipid class of interest.
The workflow for identification of individual lipid molecular species of a class of interest (including regioisomers) through the automated processing of the 2D MS data in the program is outlined in Scheme 2. First, an ion peak list of the molecular species in a lipid class of interest present in the analyzed lipid extract is generated. One of the following scans is used to generate the list by matching the m/z values of the detected ion peaks in the scan with those of the candidate species in the above established database of the lipid class of interest: (1) a tandem MS scan (i.e., PIS or NLS) which is specific to the lipid class of interest when a low mass accuracy/unit mass resolution mass spectrometer or a moderately high mass accuracy/high mass resolution mass spectrometer is employed (Table 2), or (2) a full MS scan when a high mass accuracy/high mass resolution mass spectrometer is used. This peak list represents all the detectable species of the specific class including isomeric species and contains information about the total number of carbon atoms and the total number of double bonds of the aliphatic chain(s) from the lipid database of the program. Next, the detailed structures of individual isomeric species (including regioisomers) of each individual ion in the list are identified. Identification of acyl chain moieties is achieved by loading all PIS or NLS data to a spreadsheet. As restricted with the total number of carbon atoms and the total number of double bonds present in the acyl chains identified for each individual species, the combination of the paired aliphatic chains in a diacyl species is determined while the paired rule of fatty acyl chains for ether phospholipids is applied as previously described29.
In the program, the regiospecificity of each identified diacyl species in the negative ion mode is assessed by comparison of the intensities of the paired acyl carboxylates in their corresponding PIS which is similar to those as described with product ion analyses30 after considering correction for the effects of any M + 2 13C isotopologues on these intensities as previously described10. It should be specifically noted that a reduced abundance of fatty acyl carboxylate containing multiple double bonds (e.g., 22:6, 22:5, 22:4, 20:5, 20:4, 20:3, and 18:3) during CID is present due to the facile loss of CO2 as previously demonstrated16, 29, 31. The high mass accuracy and high resolution of the Orbitrap mass spectrometer can distinguish the fragment ion at m/z 283.26 representing 18:0 carboxylate and the fragment ion at m/z 283.24 representing 22:6 carboxylate with a loss of CO229. Correction factors for these fatty acyl carboxylates have been derived from the high mass accuracy and high resolution product ion spectra of the bovine heart lipid extracts and mouse cerebellum lipid extracts which both contain abundant polyunsaturated acyl chain-containing diacyl PE and plasmalogen PE species. The correction factors for these species for the instruments facilitating CID through a multiple collision process have been integrated into the program. The ratios of sn-1 and sn-2 acyl carboxylates (after the correction if multiple double bonds are present) are found to range from 2.4 - 3.7 and center at 2.9 ± 0.2 for molecular species in PE class by extensive examination of numerous product ion spectra and the ratios for the species in other lipid classes are similarly determined, which are used to determine the regiospecificity of diacyl lipid species in the program. The resultant pair of lysoglycerophospholipid fragments from the product ion analysis of a glycerophospholipid species has previously been used to distinguish regiospecificity of a “pure” species32, 33. These paired fragments are relatively less abundant in comparison to the pair of ions corresponding to fatty acyl carboxylates although the difference between the intensities of these paired lysoglycerophospholipid fragments is much larger than that of the pair of fatty acyl carboxylates. It is difficult to quantify these low abundant lysoglycerophospholipid fragments in a MDMS format. Therefore, we used the PIS-determined intensities of fatty acyl carboxylates to assess both aliphatic chain identities and their regiospecificity in individual glycerophospholipid molecular species in AMDMS-SL.
As an example, we present the identification of PI molecular species present in lipid extracts of mouse myocardium using the program. The sequence for acquisition of a full MS scan and all tandem MS scans were automatically controlled using Xcalibur software. Figure 1 shows the total ion chromatograph of each scan for the analysis of PI molecular species as listed in Table 2. The individual scans acquired in the profile mode in a segment of interest were averaged to minimize the noise level. A representative scan from PIS329.3 (i.e., precursor ion analysis of 22:5 FA) is displayed (Figure 1B). These scans are shown in the 2D mass spectrum format (Figure 2). A peak list including m/z values and intensities from each of these scans is generated by Xcalibur and then either manually or automatically transported into the program as raw data.
Figure 1.

Total ion current chromatogram of stepwise acquisition of MS and tandem MS spectra for identification and quantitation of phosphatidylinositol molecular species in the lipid extracts of mouse myocardium. The lipid extract from mouse myocardium was analyzed in the negative-ion mode after infusion of the diluted lipid extract directly with a nanomate device. The stepwise acquisition of MS and tandem MS spectra as indicated (Panel A) was conducted using a sequential and customized program operating under Xcalibur software. Each segment of individual PIS was taken for 2 min in the profile mode. Panel B shows an example of the PIS averaged from all of scans acquired in the segment corresponding to PIS329 (i.e., 22:5 FA).
Figure 2.

A representative two-dimensional mass spectrometric analysis of phosphatidylinositol molecular species present in the lipid extracts of mouse myocardium. Each MS or MS/MS scan of the 2D ESI mass spectrum was acquired by sequentially programmed, customized scans operating under Xcalibur software. All scans were displayed after being normalized to the base peak in each individual scan. “IS” denotes internal standard (at m/z 871.5); “GPI” stands for glycerophosphoinositol.
Specifically, the full MS scan for analysis of PI species which are generally present in the mass region of m/z 800 to 925 was acquired in the negative-ion mode since individual PI species carries a phosphate and can be selectively ionized in this mode (i.e., intrasource separation) (the top scan in Figure 2). PIS241.1 (i.e., cyclic inositol phosphate) as indicated is quite specific to this phospholipid class in this mass region and sensitive (see insets above PIS241.1 in Figure 2). However, any anionic lipid molecular species containing a 15:0 FA or a 15:1 FA (resulting from the monoisotopic ion or the M + 2 13C isotopologue, respectively) also shows a peak in PIS241.1 under the experimental conditions. PIS241.1 of mouse myocardial lipid extracts displays 87 ion peaks including isotopologues (Column 2 of Table 3) after a baseline correction with a selected threshold of S/N > 3.
Table 3.
Phosphatidylinositol molecular species present in mouse myocardial lipid extracts
| m/z of ion peaks in PIS241a | The species matched with the database of PI speciesb | Identified species by PIS of FA chainsc | Contentd | |
|---|---|---|---|---|
| 1 | 801.5 | |||
| 2 | 807.5 | |||
| 3 | 815.6 | d33:4 | 18:3-15:1/15:1-18:3 (tr) | 0.02 ± 0.01 |
| 4 | 816.6 | |||
| 5 | 817.3 | |||
| 6 | 820.5 | |||
| 7 | 831.6 | |||
| 8 | 832.4 | |||
| 9 | 833.5 | d34:2 | 16:0-18:2, 18:0-16:2/16:2-18:0 (tr), 17:1-17:1 (tr) | 0.05 ± 0.02 |
| 10 | 834.5 | |||
| 11 | 835.5 | d34:1/d35:8 | 18:1-16:0, 17:0-17:1 (tr) | 0.01 ± 0.01 |
| 12 | 836.7 | |||
| 13 | 837.4 | |||
| 14 | 838.7 | |||
| 15 | 839.7 | |||
| 16 | 841.7 | |||
| 17 | 844.4 | |||
| 18 | 845.6 | |||
| 19 | 846.4 | |||
| 20 | 847.6 | d36:9/d35:2 | 18:0-17:2/17:2-18:0 (tr), 15:1-20:1/20:1-15:1 (tr) | 0.01 ± 0.01 |
| 21 | 848.6 | |||
| 22 | 849.5 | |||
| 23 | 851.6 | d36:7/d35:0 | ||
| 24 | 852.6 | |||
| 25 | 853.5 | |||
| 26 | 855.3 | |||
| 27 | 857.6 | d36:4 | 16:0-20:4, 15:0-21:4 (tr) | 0.19 ± 0.02 |
| 28 | 858.4 | |||
| 29 | 859.5 | d36:3 | 18:1-18:2/18:2-18:1, 15:0-21:3 (tr) | 0.16 ± 0.02 |
| 30 | 860.5 | |||
| 31 | 861.6 | d36:2/d37:9 | 18:0-18:2 | 0.93 ± 0.07* |
| 32 | 862.6 | |||
| 33 | 863.7 | d36:1/d37:8 | 15:1-21:0 | 0.03 ± 0.01 |
| 34 | 864.6 | |||
| 35 | 865.6 | d36:0/d37:7 | ||
| 36 | 866.8 | |||
| 37 | 867.7 | |||
| 38 | 868.7 | |||
| 39 | 869.6 | |||
| 40 | 870.8 | |||
| 41 | 871.6 | d38:11/d37:4 | 17:0-20:4 (IS), 15:0-22:4 (tr) | 2.00* |
| 42 | 872.6 | |||
| 43 | 873.5 | d38:10/d37:3 | 17:0-20:3, 15:1-22:2 (tr) | 0.04 ± 0.01 |
| 44 | 874.6 | |||
| 45 | 875.4 | d38:9/d37:2 | ||
| 46 | 876.6 | |||
| 47 | 877.3 | |||
| 48 | 879.8 | |||
| 49 | 881.5 | d38:6 | 16:0-22:6, 17:1-21:5 (tr) | 0.10 ± 0.01 |
| 50 | 882.4 | |||
| 51 | 883.6 | d38:5 | 18:1-20:4 (88%), 16:0-22:5 (12%) | 0.30 ± 0.02 |
| 52 | 884.8 | |||
| 53 | 885.6 | d38:4 | 18:0-20:4 | 6.21 ± 0.34* |
| 54 | 886.6 | |||
| 55 | 887.5 | d38:3/d39:10 | 18:0-20:3, 19:1-19:2/19:2-19:1 (tr) | 0.59 ± 0.05* |
| 56 | 888.6 | |||
| 57 | 889.4 | d38:2/d39:9 | ||
| 58 | 890.7 | |||
| 59 | 891.7 | d38:1/d39:8 | 17:1-21:0 | 0.01 ± 0.01 |
| 60 | 892.5 | |||
| 61 | 893.6 | d38:0/d39:7 | ||
| 62 | 894.5 | |||
| 63 | 895.6 | d39:6 | ||
| 64 | 896.4 | |||
| 65 | 897.6 | d40:12/d39:5 | 22:3-17:2 | 0.01 ± 0.01 |
| 66 | 898.9 | |||
| 67 | 899.5 | d40:11/d39:4 | 19:0-20:4, 17:2-22:2 (tr), 17:1-22:3 (tr) | 0.04 ± 0.01 |
| 68 | 900.6 | |||
| 69 | 901.6 | |||
| 70 | 905.5 | d40:8/d39:1 | ||
| 71 | 906.4 | |||
| 72 | 907.6 | d40:7/d39:0 | ||
| 73 | 908.8 | |||
| 74 | 909.5 | d40:6 | 18:0-22:6 | 0.57 ± 0.04* |
| 75 | 910.5 | |||
| 76 | 911.6 | d40:5 | 18:0-22:5 (95%), 19:0-21:5 (5%), 21:3-19:2 (tr) | 0.24 ± 0.02 |
| 77 | 912.6 | |||
| 78 | 913.6 | d40:4/d41:11 | 18:0-22:4, 21:3-19:1/19:1-21:3 (tr) | 0.08 ± 0.01 |
| 79 | 914.7 | |||
| 80 | 915.6 | d40:3/d41:10 | 19:3-21:0/21:0-19:3 (tr) | tr |
| 81 | 917.7 | d40:2/d41:9 | 18:2-22:0 (tr), 19:1-21:1 (tr), 19:2-21:0 (tr) | tr |
| 82 | 919.6 | d40:1/d41:8 | ||
| 83 | 920.6 | |||
| 84 | 921.5 | d40:0/d41:7 | 22:6-19:1/19:1-22:6, 20:5-21:2/21:2-20:5 (tr) | 0.03 ± 0.01 |
| 85 | 922.7 | |||
| 86 | 923.7 | d42:13/d41:6 | 22:3-19:3/19:3-22:3 | 0.01 ± 0.01 |
| 87 | 924.7 | |||
| Total | 87 | 33 | 24 ions, 42 species (isomers not counted) | 9.61 ± 0.63 |
The ions were detected in PIS241 after corrections for the baseline drift and background noise.
The ions shown in Column 2 matched with the species in the database of phosphatidylinositol (Table S1) for prescreening (Scheme 2; see text for details). The prefix “d” denotes diacyl species.
Phosphatidylinositol species prescreened out by PIS241 (column 3) were used for identification of fatty acyl (FA) chains. The presence of potential FA chains which meet the total number of carbon atoms and double bonds with the species prescreened by PIS241 was identified by PIS of naturally-occurring FAs. The intensities of ions detected by PIS of naturally-occurring FAs were subject to corrections for baseline drift and background noise. These intensities were further subjected to corrections for 13C isotope distribution and the loss of CO2 from carboxylate ions prior to identification of phosphatidylinositol species including regioisomers. The numbers in the parentheses indicate the molar ratio of each isomer in the ion peak. The abbreviation “tr” indicates the species is only present in a trace amount (i.e., < 0.01 nmol/mg protein) in the samples.
The content of each identified phosphatidylinositol molecular species was determined using a two-step procedure as illustrated in Scheme 3 and described in the text in detail. The species indicated with asterisks were quantified in the first step of quantification and the contents of these species were used as standards for the second step quantification. “IS” represents internal standard (at m/z 871.6).
These ions are then matched with the species in the database of PI molecular species (Table S5) by a data filter set in the program to yield a list of PI species present in the analyzed lipid extract (Column 3 of Table 3) in an m:n format (where m is the number of total carbon atoms while n is the number of total double bonds in the aliphatic chains). The data filter is set up according to the nominal mass of the ions in the PI database (as formulated in Table 1 and displayed in Table S5), the mass resolution, and the detection threshold of an ion peak. The peaks present in column 2 but absent in column 3 represent the peaks which have been excluded by the filter. These excluded peaks represent (1) a non-PI species (e.g., a 15:0 FA or 15:1 FA-containing species in other anionic lipid classes, ceramide phosphoinositol or an unknown compound); (2) an isotopologue of a PI or non-PI species which has even mass and thus one mass unit different from a species in the PI database); or (3) a PI species in low abundance and overlapping with an isotopologue of an abundant species. In the third case, the ion peak has an m/z matching with one in the PI database but its abundance after 13C deisotoping is not more intense than the detection threshold determined by the dynamic range. By this approach, we detected 33 ion peaks (Column 3 of Table 3).
Next, the ions which were detected by PIS of naturally-occurring fatty acyl carboxylates and whose m/z values match with the ions listed in the column 3 of Table 3 are subjected to the identification of fatty acyl constituents of a species by the program through selection of a pair of ions to match the total number of carbon atoms and the total number of double bonds to the species (Columns 4 of Table 3). Baseline correction and 13C deisotoping are performed in the program for all these scans and a threshold is set to determine the presence of such an ion. This threshold can be in a default setting (i.e., S/N >1) or specified (e.g., S/N > 3 for PIS for PI identification in Table 3) by the user of the program. The abundance of these ions is then used to identify the acyl moieties and the regiospecificity of individual molecular species of each isomeric ion in the program. For example, an ion peak is present at m/z 861.5 in PIS241.1 (Figure 2) and matched the PI species containing m:n of 36:2 or 37:9 by the program (Row 45 of Table 3). The PIS data of naturally-occurring fatty acyl carboxylates indicate that the ion peak at m/z 861.5 is present in both PIS283.2 (i.e., 18:0 FA) and PIS279.2 (i.e., 18:2 FA) (left broken line in Figure 2) after baseline correction and de-isotoping in an intensity ratio of approximately 1.5 which is a typical ratio of ion intensities resulted from sn-1 and sn-2 acyl chains of a diacyl PI species. AMDMS-SL from these results determines that this PI ion at the current limit of detection only contains one species which contains 18:0 FA and 18:2 FA at the sn-1 and 2 positions, respectively.
In the case of the presence of lipid species containing 15:0 FA or 15:1 FA or other fragments that could lead to the generation of an ion present in PIS241.1, there exist two possibilities. First, if the ion peak present in PIS241.1 does not match with a molecular species in the PI database, the program immediately eliminates this ion from the list (Column 3 of Table 3). Second, if this ion peak matched with a species with m:n and is therefore present in column 3 while the combination of the detected fatty acyl fragments in PIS of all naturally-occurring fatty acyl carboxylates does not match with m:n, the program also rejects the presence of a PI species at this ion peak from the list (Column 4 of Table 3). By this approach, AMDMS-SL identifies 24 ion peaks corresponding to 42 PI molecular species in the lipid extracts of mouse myocardium as tabulated (Column 4 of Table 3).
Similarly, the regiospecificity of each identified diacyl species in the positive-ion mode (e.g., diacyl PC) is assessed by comparison of the intensities of the paired ions resulted from the neutral losses of fatty acyl constituents in their corresponding NLS (e.g., NLS of FA plus trimethylamine for PC species34).
Quantification of Individual Molecular Species of a Class of Interest Present in a Cellular Lipidome Using AMDMS-SL
Quantification of the identified individual molecular species of a class of interest using AMDMS-SL is performed in a two-step procedure as outlined previously1, 28, 35. A workflow of lipid quantitation using this two-step procedure in the program is shown in Scheme 3. Specifically, AMDMS-SL first determines whether there exist overlapping or low abundance peaks in the peak list of interest to be quantitated (see below). If there exist exclusively non-overlapping and high abundance peaks in the peak list of interest, the program then performs the one-step quantitation procedure (Route A in Scheme 3); if there exist either overlapping or low abundance peaks or both, the program accordingly performs the two-step quantitation procedures (Routes A and B in Scheme 3).
Scheme 3.
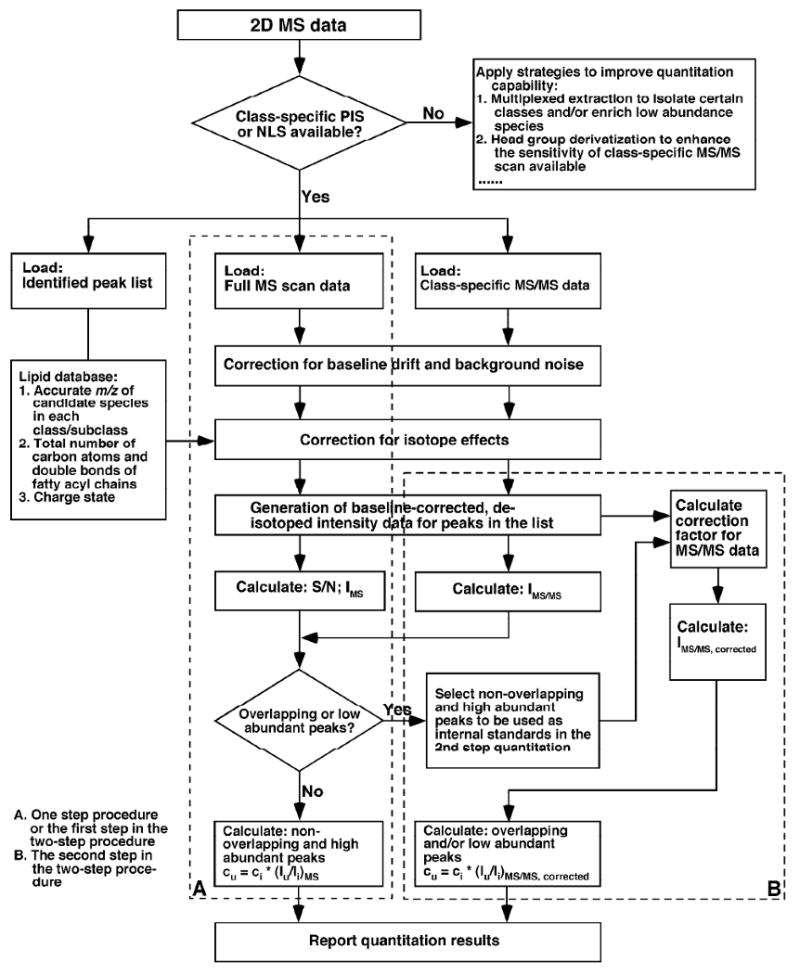
A schematic of the workflow used in AMDMS-SL to quantify individual molecular species in a lipid class of interest. The IMS and IMS/MS are the normalized peak intensities in the full MS scan and the MS/MS scan which is specific to the lipid class of interest, respectively. The cu and ci are the content of individual species in the list and the selected internal standard, respectively, and Iu and Ii are the peak intensities of the species and the selected internal standard, respectively, after 13C de-isotoping.
To determine whether there are overlapping or low abundance peaks, a list of the identified ions (i.e., m/z) of a class of interest along with the number of total carbon atoms of those ions, the peak intensities of individual ions present in the full MS scan and those present in the class-specific PIS or NLS are arrayed in a spreadsheet. The peak intensities which are normalized to that of the selected internal standard for the class of interest in both MS and MS/MS scans are calculated followed by the calculation of the intensity ratio y:
| (1) |
where the IMS and IMS/MS are the normalized peak intensities in the full MS scan and the MS/MS scan which is specific to the lipid class of interest, respectively.
AMDMS-SL first identifies the peaks in the list with either an S/N < 10 or the normalized intensity IMS less than 0.2 as the low abundance peaks. Then, to identify the overlapping species from the rest high abundance ion peaks, a linear regression of y vs. Δm (i.e., the difference of the total numbers of carbon atoms between a species and internal standard) is performed with an intercept set at 1. This intercept is set at 1 (i.e, y = 1 at Δm = 0 for internal standard) since the selected internal standard is a pre-determined non-overlapping species. The program determines an ion peak as an overlapping peak if its determined y value is deviated >15% from the calculated y value above the regression line. This deviation of 15% is pre-set in default in the program after considering the following factors. First, there exists the possible instrument fluctuation and/or experimental errors (e.g., 5 - 10%). Second, the varied unsaturation of individual species may differentially affect the fragmentation kinetics and/or thermodynamics of each individual species. This latter factor may render the fluctuation of the determined y values resulting in the deviation of a determined y value from the regression whereas only the total numbers of carbon atoms of each species is taken into consideration during the regression analysis. Therefore, the peaks with the determined y values either within a deviation of 15% from the regression or >15% from the calculated y value below the regression line are considered as the non-overlapping peaks while the overlapping peaks have the determined y values deviated >15% from the calculated y value above the regression line. The large negative deviation is likely from the contribution of the considerably different unsaturation of individual species from that of the internal standard. The contributions to the differential fragmentation kinetics and/or thermodynamics of individual species from their differential unsaturation are corrected in the second step of quantitation procedure (see below).
After identifying the low abundant or overlapping peaks from the list of molecular species of a class of interest, the program performs the one-step quantitation procedure to quantitate those non-overlapping and high abundance species. Specifically, a list of the identified ions (i.e., m/z) of a class of interest along with the number of total carbon atoms of these ions, and the peak intensity data of the full MS scan are loaded to a spreadsheet. Baseline correction and de-isotoping are performed for the data. The baseline-corrected, de-isotoped peak intensities are then generated and used to quantitate the content of each peak by ratiometric comparison with the selected internal standard of the class of interest as follows:
| (2) |
where cu and ci are the contents of individual species in the list and the selected internal standard, respectively, while Iu and Ii are the peak intensities of the species and the selected internal standard, respectively, after 13C de-isotoping. The determined contents of these non-overlapping and abundant species are reported as the final results when no overlapping and low abundant species are determined from the sample, or used as the standards for the second step of quantitation when needed. It should be pointed out that ion intensities in the class-specific tandem MS scan(s) might depend on a fashion of subclasses or subtypes of species as previously described34. Therefore, different standards from these subclasses or subtypes of species for the second step quantitation are selected in the program (Table 2)34.
The second step quantitation in the two-step quantitation procedure is next performed to quantitate the rest overlapping and/or low abundance species by using the species quantitated above as the standards. The necessity of the utilization of multiple standards in this second step is due to the presence of the differential fragmentational kinetics and/or thermodynamics of individual lipid molecular species of a class owing to the presence of differential carbon atoms and/or double bonds as previously demonstrated36. An algorithm is generated by AMDMS-SL based on two variations (i.e., the number of total carbon atoms and the number of total double bonds present in side chains of each individual molecular species) by using multi-variants least square regression as follows:
| (3) |
where Iu and Iu' are the peak intensities in the full MS scan and in the class-specific tandem MS scan of the species of interest after 13C de-isotoping, respectively; w, x, y and z are the number of total carbon atoms (m) of acyl chains in each species, m2, total double bond number (n) of acyl chains in each species, and m*n, respectively; a, b, c, d and e are the correction factors due to the presence of differential fragmentation kinetics and/or thermodynamics of different molecular species of a class. AMDMS-SL determines these factors using the least square regression of the above selected standards as follows:
| (4) |
where [I], [I'], [W], [X], [Y] and [Z] represent the matrices of the determined peak intensities in the full MS scan, the determined peak intensities in the tandem MS scan, the total carbon atom number (m), m2, total double bond number (n), and m*n of the selected standards, respectively. The selected standards as described above are exclusively non-overlapping and abundant species, which guarantee the accurate determination of the [I] from the full MS scan. The determined correction factors are thereafter used to calculate the Iu of the overlapping and/or low abundance species from their Iu' in tandem MS scan by equation (3). The tandem MS scan is class-specific and/or of higher sensitivity compared to the full MS scan, which renders much more accurate determination of peak intensities (i.e., Iu') for overlapping and/or low abundance species. The contents cu of those species are quantitated by equation (2) using the above calculated Iu in the program.
It should be pointed out that when only two species including the pre-selected internal standard meet the criteria for being selected as the standards for the second step, the program uses a simple linear equation based only on the number of total carbon atoms as similarly demonstrated previously36 as follows:
| (5) |
where Iu and Iu' are the peak intensities in the full MS scan and in the class-specific tandem MS scan of the species of interest after 13C de-isotoping, respectively; x is the number of total carbon atoms (m) of the acyl chains in the species; the constants a and b are the correction factors due to the presence of differential fragmentation kinetics and/or thermodynamics of different molecular species of a class. Similarly, AMDMS-SL determines these factors using the least square regression of the standards as follows:
| (6) |
where [I], [I'], and [X] represent the matrices of the determined peak intensities in full MS scan, the determined peak intensities in the tandem MS scan, and the number of total acyl chain carbon atoms (m) of the two selected standards, respectively. Other overlapped and/or low abundant molecular species of the class are quantified with this linear equation according to the number of total carbon atoms present in each individual molecular species. In this case, the presence of different numbers of double bonds might affect the accurate quantification of those overlapped and/or low abundant molecular species. This effect is relatively small particularly to the total content of the class since the selected standard contains a certain number of double bonds and the determined high abundant species largely contributes to the content of this particular class. Importantly, there is a big difference between the approach described above and the previously reported method36. All quantified individual molecular species in the current approach are pre-identified by the program using 2D MS data as described above and therefore, any artifactual peaks that are present in the tandem mass spectrum used for quantification have been eliminated prior to quantification (Table 3).
Through this second step in the quantitation process, the linear dynamic range of quantitation is dramatically extended by eliminating background noise and by filtering the overlapping molecular species through a MDMS approach as demonstrated previously7, 13. However, it is very important to use the molecular species with the most abundance determined from the first step as standards for quantification of other molecular species of the class in the second step to guarantee the accuracy in quantification. The selection of the most abundant molecular species as standards used in the second step is to minimize any potential error propagation. The levels of each identified PI species determined using the program are tabulated (Column 5 of Table 3). Table 2 summarizes the primary PIS or NIS used for the second step for quantification. It should be pointed out that all other headgroup-related PIS or NLS of each lipid class if present and sensitive enough can be applied for quantitation of individual molecular species in the second step. This redundant process is useful for refining the quantitative data and serves as internal checks for the accuracy of quantitation.
Finally, to the lipid class which a specific PIS or NIS is not present, e.g., TG, ceramide, and cardiolipin, the two-step procedure can not be applied as described above. A special quantitation method for each of these lipid classes has been developed in AMDMS-SL2, 8, 10.
Summary
This study presents the details of a program for automated identification and quantification of individual lipid molecular species by array analysis of mass spectrometric data (i.e., multi-dimensional mass spectrometric (MDMS) analysis) acquired after direct infusion and intrasource separation (i.e., MDMS-SL). The automatic analyses of individual lipid molecular species are uniquely established based on a building block concept which has been used in both database construction and MDMS analysis. Therefore, the presence of a broad spectrum of lipid molecular species (over 36,000 potential species) is automatically screened and accurately identified in a high throughput fashion by AMDMS-SL. The identified species are then automatically quantified using a two-step procedure with a broad linear dynamic range (over three orders of magnitude) in the program. The AMDMS-SL is designed to be flexible to accommodate new lipids and classes of lipids with identification of alterations in species content during different pathophysiologic perturbations and their response to treatment.
Supplementary Material
Acknowledgments
This work was supported by National Institutes of Health Grant P01 HL57278 and National Institutes of Health/National Institute on Aging Grant R01 AG31675. The authors are grateful to Ms Zhongdan Zhao for her technical help. RWG and XH serve as consultants for the LipoSpectrum LLC.
Abbreviation
- CID
collision-induced dissociation
- DG
diglycerides(s)
- ESI/MS
electrospray ionization mass spectrometry
- PC
choline glycerophospholipid
- PE
ethanolamine glycerophospholipid
- PG
phosphatidylglycerol
- PI
phosphatidylinositol
- PS
serine glycerophospholipid
- a
alkyl ether
- d
acyl ester (diacyl-)
- MG
monoglyceride(s)
- MDMS
multi-dimensional mass spectrometry
- MDMS-SL
MDMS-based shotgun lipidomics
- NLS
neutral loss scan
- PIS
precursor-ion scan
- p
vinyl ether (plasmalogen)
- TG
triglyceride(s)
References
- 1.Han X, Gross RW. Expert Rev Proteomics. 2005;2:253–264. doi: 10.1586/14789450.2.2.253. [DOI] [PubMed] [Google Scholar]
- 2.Han X, Gross RW. Anal Biochem. 2001;295:88–100. doi: 10.1006/abio.2001.5178. [DOI] [PubMed] [Google Scholar]
- 3.Han X, Yang J, Cheng H, Ye H, Gross RW. Anal Biochem. 2004;330:317–331. doi: 10.1016/j.ab.2004.04.004. [DOI] [PubMed] [Google Scholar]
- 4.Jiang X, Cheng H, Yang K, Gross RW, Han X. Anal Biochem. 2007;371:135–145. doi: 10.1016/j.ab.2007.08.019. [DOI] [PMC free article] [PubMed] [Google Scholar]
- 5.Han X, Yang K, Yang J, Fikes KN, Cheng H, Gross RW. J Am Soc Mass Spectrom. 2006;17:264–274. doi: 10.1016/j.jasms.2005.11.003. [DOI] [PubMed] [Google Scholar]
- 6.Han X. Front Biosci. 2007;12:2601–2615. doi: 10.2741/2258. [DOI] [PMC free article] [PubMed] [Google Scholar]
- 7.Han X, Gross RW. Mass Spectrom Rev. 2005;24:367–412. doi: 10.1002/mas.20023. [DOI] [PubMed] [Google Scholar]
- 8.Han X, Yang K, Yang J, Cheng H, Gross RW. J Lipid Res. 2006;47:864–879. doi: 10.1194/jlr.D500044-JLR200. [DOI] [PMC free article] [PubMed] [Google Scholar]
- 9.Han X, Yang K, Cheng H, Fikes KN, Gross RW. J Lipid Res. 2005;46:1548–1560. doi: 10.1194/jlr.D500007-JLR200. [DOI] [PMC free article] [PubMed] [Google Scholar]
- 10.Han X. Anal Biochem. 2002;302:199–212. doi: 10.1006/abio.2001.5536. [DOI] [PubMed] [Google Scholar]
- 11.DeLong CJ, Baker PRS, Samuel M, Cui Z, Thomas MJ. J Lipid Res. 2001;42:1959–1968. [PubMed] [Google Scholar]
- 12.Cheng H, Jiang X, Han X. J Neurochem. 2007;101:57–76. doi: 10.1111/j.1471-4159.2006.04342.x. [DOI] [PMC free article] [PubMed] [Google Scholar]
- 13.Han X, Yang K, Gross RW. Rapid Commun Mass Spectrom. 2008;22:2115–2124. doi: 10.1002/rcm.3595. [DOI] [PMC free article] [PubMed] [Google Scholar]
- 14.Forrester JS, Milne SB, Ivanova PT, Brown HA. Mol pharmacol. 2004;65:813–821. doi: 10.1124/mol.65.4.813. [DOI] [PubMed] [Google Scholar]
- 15.Hermansson M, Uphoff A, Kakela R, Somerharju P. Anal Chem. 2005;77:2166–2175. doi: 10.1021/ac048489s. [DOI] [PubMed] [Google Scholar]
- 16.Ejsing CS, Duchoslav E, Sampaio J, Simons K, Bonner R, Thiele C, Ekroos K, Shevchenko A. Anal Chem. 2006;78:6202–6214. doi: 10.1021/ac060545x. [DOI] [PubMed] [Google Scholar]
- 17.Haimi P, Uphoff A, Hermansson M, Somerharju P. Anal Chem. 2006;78:8324–8331. doi: 10.1021/ac061390w. [DOI] [PubMed] [Google Scholar]
- 18.Fahy E, Cotter D, Byrnes R, Sud M, Maer A, Li J, Nadeau D, Zhau Y, Subramaniam S. Methods Enzymol. 2007;432:247–273. doi: 10.1016/S0076-6879(07)32011-9. [DOI] [PubMed] [Google Scholar]
- 19.Song H, Hsu FF, Ladenson J, Turk J. J Am Soc Mass Spectrom. 2007;18:1848–1858. doi: 10.1016/j.jasms.2007.07.023. [DOI] [PMC free article] [PubMed] [Google Scholar]
- 20.Schwudke D, Liebisch G, Herzog R, Schmitz G, Shevchenko A. Methods Enzymol. 2007;433:175–191. doi: 10.1016/S0076-6879(07)33010-3. [DOI] [PubMed] [Google Scholar]
- 21.Song H, Ladenson J, Turk J. J Chromatogr B. 2009 doi: 10.1016/j.jchromb.2008.1012.1043. [DOI] [Google Scholar]
- 22.Han X, Yang J, Yang K, Zhao Z, Abendschein DR, Gross RW. Biochemistry. 2007;46:6417–6428. doi: 10.1021/bi7004015. [DOI] [PMC free article] [PubMed] [Google Scholar]
- 23.Bartz R, Li WH, Venables B, Zehmer JK, Roth MR, Welti R, Anderson RG, Liu P, Chapman KD. J Lipid Res. 2007;48:837–847. doi: 10.1194/jlr.M600413-JLR200. [DOI] [PubMed] [Google Scholar]
- 24.Thomas MC, Mitchell TW, Blanksby SJ. J Am Chem Soc. 2006;128:58–59. doi: 10.1021/ja056797h. [DOI] [PubMed] [Google Scholar]
- 25.Van Pelt CK, Brenna JT. Anal Chem. 1999;71:1981–1989. doi: 10.1021/ac981387f. [DOI] [PubMed] [Google Scholar]
- 26.Han X, Jiang X. Eur J Lipid Sci Technol. 2009;111:39–52. doi: 10.1002/ejlt.200800117. [DOI] [PMC free article] [PubMed] [Google Scholar]
- 27.Su X, Han X, Mancuso DJ, Abendschein DR, Gross RW. Biochemistry. 2005;44:5234–5245. doi: 10.1021/bi047773a. [DOI] [PubMed] [Google Scholar]
- 28.Schwudke D, Oegema J, Burton L, Entchev E, Hannich JT, Ejsing CS, Kurzchalia T, Shevchenko A. Anal Chem. 2006;78:585–595. doi: 10.1021/ac051605m. [DOI] [PubMed] [Google Scholar]
- 29.Yang K, Zhao Z, Gross RW, Han X. PLoS ONE. 2007;2:e1368. doi: 10.1371/journal.pone.0001368. [DOI] [PMC free article] [PubMed] [Google Scholar]
- 30.Han X, Gross RW. J Am Soc Mass Spectrom. 1995;6:1202–1210. doi: 10.1016/1044-0305(95)00568-4. [DOI] [PubMed] [Google Scholar]
- 31.Kerwin JL, Wiens AM, Ericsson LH. J Mass Spectrom. 1996;31:184–192. doi: 10.1002/(SICI)1096-9888(199602)31:2<184::AID-JMS283>3.0.CO;2-2. [DOI] [PubMed] [Google Scholar]
- 32.Hsu FF, Turk J. J Am Soc Mass Spectrom. 2000;11:892–899. doi: 10.1016/S1044-0305(00)00159-8. [DOI] [PubMed] [Google Scholar]
- 33.Ekroos K, Ejsing CS, Bahr U, Karas M, Simons K, Shevchenko A. J Lipid Res. 2003;44:2181–2192. doi: 10.1194/jlr.D300020-JLR200. [DOI] [PubMed] [Google Scholar]
- 34.Yang K, Zhao Z, Gross RW, Han X. J Chromatogr B. 2009 doi: 10.1016/j.jchromb.2009.1001.1016. [DOI] [Google Scholar]
- 35.Han X, Cheng H, Mancuso DJ, Gross RW. Biochemistry. 2004;43:15584–15594. doi: 10.1021/bi048307o. [DOI] [PubMed] [Google Scholar]
- 36.Brugger B, Erben G, Sandhoff R, Wieland FT, Lehmann WD. Proc Natl Acad Sci USA. 1997;94:2339–2344. doi: 10.1073/pnas.94.6.2339. [DOI] [PMC free article] [PubMed] [Google Scholar]
- 37.Han X, Cheng H. J Lipid Res. 2005;46:163–175. doi: 10.1194/jlr.D400022-JLR200. [DOI] [PubMed] [Google Scholar]
- 38.Hsu FF, Turk J. J Am Soc Mass Spectrom. 2001;12:61–79. doi: 10.1016/S1044-0305(00)00194-X. [DOI] [PubMed] [Google Scholar]
- 39.Hsu FF, Bohrer A, Turk J. Biochim Biophys Acta. 1998;1392:202–216. doi: 10.1016/s0005-2760(98)00034-4. [DOI] [PubMed] [Google Scholar]
- 40.Jiang X, Han X. J Lipid Res. 2006;47:1865–1873. doi: 10.1194/jlr.D600012-JLR200. [DOI] [PMC free article] [PubMed] [Google Scholar]
- 41.Jiang X, Yang K, Han X. J Lipid Res. 2009;50:162–172. doi: 10.1194/jlr.D800036-JLR200. [DOI] [PMC free article] [PubMed] [Google Scholar]
- 42.Kalderon B, Sheena V, Shachrur S, Hertz R, Bar-Tana J. J Lipid Res. 2002;43:1125–1132. doi: 10.1194/jlr.m200060-jlr200. [DOI] [PubMed] [Google Scholar]
Associated Data
This section collects any data citations, data availability statements, or supplementary materials included in this article.