Abstract
Ex-vivo-generated Epstein–Barr virus (EBV)-specific cytotoxic T lymphocytes (CTL) have been used for cellular adoptive immunotherapy of EBV-associated lymphomas. Here we investigated the phenotypes, cytolytic mechanisms, polyfunctionality and T-cell receptor (TCR) usage in growing and established CTL, generated by weekly stimulation with an EBV-transformed autologous lymphoblastoid cell line (LCL). Our results showed that phenotypically mature CTL developed within the first 4 weeks of culture, with an increase in CD45RO and CD69, and a decrease in CD45RA, CD62L, CD27 and CD28 expression. Spectratyping analysis of the variable β-chain of the TCR revealed that TCR repertoire remained diverse during the course of culture. Cytotoxicity of CTL was significantly inhibited by concanamycin A (P < 0·0001) and ethylene glycol-bis tetraacetic acid (P < 0·0001), indicating that a calcium and perforin-mediated exocytosis pathway with the release of granzyme B was the principal cytotoxic mechanism. The CTL mainly produced interferon-γ (IFN-γ) or tumour necrosis factor-α (TNF-α) upon restimulation with autologous LCL, although there were some polyfunctional cells producing IFN-γ and TNF-α. Granzyme B, perforin and Fas ligand were detected in CD8+ and CD4+ cells in all CTL; however, a greater proportion of CD8+ than CD4+ T cells expressed granzyme B (P < 0·0001) and more granzyme B was detected in CD8+ T cells than in CD4+ T cells (P = 0·001). This difference was not observed with Fas ligand or perforin expression. Our results provide insight into the basic characteristics of ex-vivo-generated CTL.
Keywords: cytolytic pathways, cytotoxic T lymphocytes, Epstein–Barr virus, T-cell receptor
Introduction
Epstein–Barr virus (EBV) is a ubiquitous human herpesvirus which generally infects subclinically in early childhood and thereafter persists in the host for life. The virus is mainly spread orally in saliva and targets tonsillar B lymphocytes in a new susceptible host, eventually establishing a latent infection in memory B cells.1,2 In this latent state the virus evades host immunosurveillance, but when virus genes are expressed during lytic replication, infected cells become targets for immune recognition.
Epstein–Barr virus-specific CD8+ cytotoxic T lymphocytes (CTL) develop during primary infection, are readily detectable in the blood of all healthy EBV-seropositive individuals, and are the key to controlling persistent infection. Clonal analysis reveals that the latent Epstein–Barr nuclear antigens 3A, B and C are immunodominant, and many human leucocyte antigen (HLA) class I-restricted epitopes have been identified.3,4 Recently the importance of EBV-specific CD4-positive T cells has been recognized, not only in enhancing and maintaining the CD8 response but also in lysis of specific target cells.5,6
Epstein–Barr virus has tumorigenic potential, carrying a unique set of latent genes that act in concert to transform resting B cells into proliferating lymphoblasts. Cells expressing these latent antigens in vivo are generally eliminated by immune T cells, but in the immunosuppressed host these cells may grow uncontrollably causing B lymphoproliferative disease, which occurs most commonly in transplant recipients who are iatrogenically immunosuppressed to prevent graft rejection. Immunosuppressive drugs such as ciclosporin and tacrolimus inhibit the function of EBV-specific CTL, whereas monoclonal antibodies like OKT3 deplete these T cells from the circulation. These regimens allow EBV-infected B cells to accumulate and proliferate, which increases the risk of post-transplant lymphoproliferative disease (PTLD).7 There is no universally accepted treatment protocol for PTLD, which carries a mortality of around 50%. Reduction of immunosuppression is used as first-line treatment in all transplant centres, aiming to restore EBV-specific CTL activity. Adoptive T-cell immunotherapy is a novel treatment for PTLD developed to overcome the shortcomings and side-effects of conventional therapies.8–13 First pioneered in bone marrow transplant recipients, EBV-specific CTL grown ex vivo from bone marrow transplant donor blood were used successfully to prevent and treat recipient PTLD.8 Some studies have treated PTLD with autologous (recipient) CTL,9,10 and we have recently used allogeneic CTL to treat PTLD on a best-HLA-matched basis.11,12
The present study was undertaken to define the phenotypes, growth characteristics and cytolytic pathways used, and to investigate the T-cell receptor (TCR) repertoire of developing and established EBV-specific CTL.
Materials and methods
Donor samples
Peripheral blood mononuclear cells (PBMC) from 12 healthy, EBV-seropositive blood donors of known HLA type were obtained with the ethical approval from the Scottish National Blood Transfusion Service, Edinburgh, UK. From each donation 2 × 10⁶ PBMC were infected with a concentrated EBV preparation and cultured in medium containing ciclosporin (10 μg/ml) to establish a lymphoblastoid cell line (LCL), while the remaining cells were stored frozen.
Generation of EBV-specific CTL
Once a LCL was available, autologous PBMC were thawed and used to generate CTL as reported previously.13 Briefly, PBMC were stimulated for 10 days with γ-irradiated LCL at a ratio of 40 : 1. Thereafter, cultures were restimulated weekly with LCL at a 4 : 1 ratio, and 20 IU/ml interleukin-2 (IL-2; Chiron Corporation, Emeryville, CA) added every 3 days. Cells were counted weekly, the concentration was adjusted to 106/ml, and a sample was frozen for later analysis.
Flow cytometry
The CTL were stained with a panel of antibodies specific for T cells (CD3, CD4, CD8, CD27, CD45RA, CD45RO, CD62L), B cells (CD19), natural killer cells (CD56), activated lymphocytes (CD28, CD69) (BD Pharmingen, Cowley, Oxford, UK), and for cytolytic molecules, perforin (BD Pharmingen), granzyme B and Fas ligand (FasL; Caltag Medsystems, Silverstone, Towcester, UK). For extracellular markers, antibody was added to 105 cells and incubated for 20 min at 4° in the dark, then washed and fixed for analysis. For intracellular staining, cells were incubated with 500 μl BD FACS™ permeabilizing solution 2 for 10 min at room temperature and washed before the addition of antibody. An unstained control sample was included in every experiment. Acquisition was performed on either the FACScan or the FACSCalibur machine (BD Biosciences, Cowley, Oxford, UK) and analysed using cellquest software (BD Biosciences).
The expression of each cytolytic molecule in the CTL was determining by taking the geometric mean of the mean fluorescence intensity (MFI) of perforin-, granzyme B- and FasL-expressing cells and subtracting from that the MFI of unstained control cells. The MFI was expressed as an arbitrary unit (AU).
FasL, granulysin, granzyme B and perforin reverse transcription–polymerase chain reaction
Primer sequences for FasL, granulysin, granzyme B and perforin were designed using the primer3 software.14 RNA was extracted from 5 × 10⁶ CTL using the RNeasy mini kit and Qiashredder system (Qiagen, Crawley, UK) following the manufacturer’s instructions. DNAse treatment (Promega, Southampton, UK) was performed on 1–2 μg extracted RNA and 1 μg DNAse-treated RNA was converted to complementary DNA (cDNA) using random hexamers and the Thermoscript RT system from Invitrogen (Paisley, UK). The cDNA was then stored at −70° until required for reverse transcription–polymerase chain reaction (RT-PCR). The β-actin PCR was performed on all cDNA to check integrity before further analysis. The cDNA (2·5 μl) was amplified in a reaction mix (25 μl) containing 1 × PCR buffer [50 mm KCl, 10 mm Tris–HCl (pH 9·0), 0·1% Triton-X-100], 1·5 mm MgCl2, 200 μm of each dATP, dTTP, dGTP, dCTP, 100 μm forward and reverse primers, 0·625 U Taq DNA polymerase (Promega). Cycling conditions were: 94° for 5 min, then 35 cycles of 95° for 30 seconds, 57° for 30 seconds and 72° for 45 seconds, followed by a final extension period at 72° for 8 min. Products were run on a 2% agarose gel containing ethidium bromide and visualized using a UVP transilluminator (Ultra-Violet Products, Cambridge, UK).
TCR Vβ spectrotyping by RT-PCR
Functionally rearranged TCR β-chain variable (βV) gene subfamilies were amplified across the complementarity determining region 3 (CDR3) encoding regions using 23 subfamily-specific primers and a FAM-conjugated β-chain-constant-region-specific primer by the method described by Foster et al.15 The PCR amplifications were performed on 1 μl cDNA in a total volume of 20 μl containing 10 mm Tris–HCl (pH 8·3), 50 mm KCl, 2 mm MgCl2, 200 μm each of dATP, dTTP, dGTP, dCTP, 1 μm of variable and constant primers and 0·5 U of AmpliTaq Gold polymerase (Applied Biosystems, Warrington, UK). Cycling conditions were 95° for 10 min followed by 30 cycles of 95° for 30 seconds, 58° for 30 seconds, 72° for 45 seconds, and a final extension at 72° for 5 min. One microlitre of PCR product was diluted in 10 μl nuclease-free water and then further diluted 1 : 10 with Hi-Di formamide (containing Genescan 500LIZ size standard) before electrophoresis in an ABI 3730 automated sequencer (Dye set 5). abi genemapper software (version 3.7) was used to analyse the data (Applied Biosystems).
Western blotting for granulysin
Cells were lysed in 125 μl cell lysis buffer, centrifuged at 15 000 g for 10 min at 4°, and the supernatant was loaded onto a precast gel. A lysate from a granulysin-positive CD56+-rich T-cell line was used as a positive control. Protein products were transferred to a Hybond® ECL nitrocellulose membrane (Amersham Biosciences, Little Chalfont, UK), blocked for 30 min at room temperature with blocking solution, washed, and incubated with anti-granulysin antibody (a kind gift from Professor C. Clayberger, Department Pediatrics, Stanford University, Stanford, CA) at a 1 : 1000 dilution for 30 min at room temperature and then overnight at 4°. The membrane was washed and incubated with goat anti-mouse immunoglobulin G (Fab-specific) alkaline phosphatase-conjugated antibody (1 : 1000 dilution; Sigma, Gillingham, UK) for 2 hr at room temperature before development with nitroblue tetrazolium dye/5-bromo-4-chloro-indolyl-phosphatase solution.
Chromium release assay
Specificity of CTL was assessed using the standard 4-hr chromium release assay. Each CTL was tested against three targets: autologous LCL, HLA-mismatched LCL, and the natural killer cell target line K562. The assays were performed in triplicate at effector : target ratios of 20 : 1, 10 : 1 and 5 : 1 in 200 μl culture medium. Controls included medium only (spontaneous release) and target cells plus 1% volume/volume Triton®-X-100 (maximum release).13
In some assays concanamycin A (CMA; 10 nm), brefeldin A (BFA; 40 μm) and ethylene glycol-bis (β-aminoethylether)-N,N,N ′,N ′-tetraacetic acid (EGTA; 3 mm) were added to the CTL for 2–3 hr before incubation with autologous LCL targets. The optimum doses of these inhibitors were selected by dose-escalation experiments (data not shown).
Intracellular cytokine production by CTL upon restimulation
Frozen CTL lines were thawed, and 1 × 10⁶ CTL were stimulated with 1 × 10⁶ autologous or HLA-mismatched LCL for 6 hr at 37° in a humidified 5% CO2 atmosphere. Control tubes containing CTL, autologous LCL or mismatched LCL were incubated separately until the staining process. Brefeldin A (10 μg/ml) was added after 2 hr to stimulated and non-stimulated cells. After the stimulation period, LCL and CTL of the non-stimulated control tubes were mixed. Cells were stained for CD8, fixed and permeabilized using a commercial kit according to the manufacturer’s instructions (Caltag Medsystems, Buckingham, UK). Anti-cytokine antibodies, fluorescein isothiocyanate-conjugated IL-2, phycoerythrin-conjugated tumour necrosis factor-α (TNF-α) or allophycocyanin-conjugated interferon-γ (IFN-γ) was added to the permeabilization step, cells were washed and fixed in 4% paraformaldehyde and at least 30 000 events were acquired using a FACSCalibur Flow Cytometer (BD Biosciences, San Jose, CA). The CTL were gated on forward and side scatters and CD8+ cells were analysed for cytokine production using flowjo software (Tree Star Inc., Ashland, OR).
Statistical analysis
The Mann–Whitney (non-parametric) test was used to analyse the results of cytotoxicity inhibition assays and the cytolytic molecule expression experiments. This was carried out using the software prism 4.0 (GraphPad Software Inc., San Diego, CA).
Results
Growth and phenotype of CTL
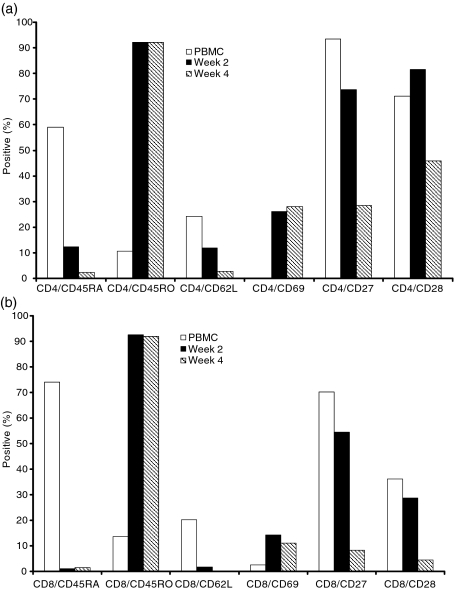
Analyses of the cell surface phenotype of eight CTL lines showed that by 12 weeks of culture, all CTL contained >97% CD3+ T cells, < 2% CD19+ B cells and < 1% CD56+ natural killer cells. In six of the eight CTL the majority of T cells were CD8-positive and in the other two CD4+ T cells predominated. Overall, the predominant phenotype (CD4+ or CD8+) was established early in culture and did not change thereafter. However, whereas in CD8+ CTL these cells dominated the culture from the outset, both the CD4-rich CTL lines were characterized by an initial fall in the percentage of CD4 cells before they rose to predominance. In all CTL there was a progressive reduction of cells coexpressing CD4 or CD8 and the naïve T-cell markers CD45RA, CD62L, CD27 and CD28, and an increase in cells coexpressing CD4 or CD8, the memory marker CD45RO and the activation marker CD69. This antigen-experienced phenotype was established by week 4 of the culture period (Fig. 1a,b).
Figure 1.
Immunophenotypes of cells in one cytoxic T lymphocyte (CTL) cell line, determined by fluorescence-activated cell sorting analyses. Percentage of (a) CD4-positive T cells and, (b) CD8-positive T cells, expressing activation and differentiation markers in CTL line.
Evolution of Vβ family usage and clonality in CTL
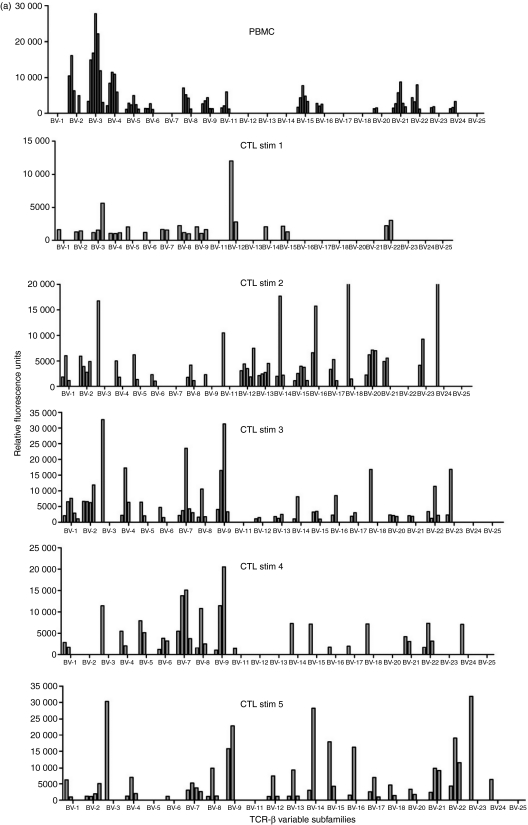
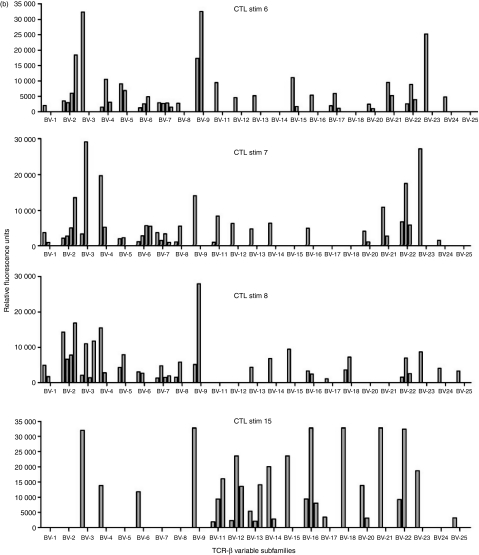
As LCL stimulation of CTL promoted phenotypic changes consistent with a mature/effector phenotype, TCR spectratyping was used to identify whether this extended to changes in the Vβ usage of eight CTL during culture. All CTL investigated used multiple Vβ families with the repertoire used by each line varying from week to week and showing no tendency to focus over time (Fig. 2). The average number of families used by each CTL per week varied from 9 to 20, with some families being more commonly used than others. No pattern of usage either within or between CTL emerged. The percentage of Vβ family usage by all CTL at each stimulation analysed is summarized in Table 1 where 100% indicates that a particular Vβ family was used by a CTL at all stimulation points and 50% denotes Vβ family usage in half of the time-points analysed. Three of the CTL (nos 2, 7 and 12) used all of the Vβ families during the course of culture and five did not, but overall no Vβ family usage pattern emerged (Table 1).
Figure 2.
T-cell receptor (TCR) variable β subfamily usage by one cytoxic T lymphocyte (CTL) cell line determined over time by spectratyping analyses. Each of the 23 subfamilies was analysed for polyclonal (more than two major peaks) and clonal (one or two major peaks) distribution patterns. PBMC, peripheral blood mononuclear cells; Stim, number of stimulations with autologous lymphoblastoid cell line.
Table 1.
Frequency of T-cell receptor Vβ family usage by cytotoxic T lymphocyte (CTL) lines during culture
| CTL lines (%) |
|||||||||
|---|---|---|---|---|---|---|---|---|---|
| Vβ families | 2 | 3 | 4 | 5 | 7 | 8 | 12 | 13 | Average (%) |
| Vβ-1 | 75 | 33 | 57 | 57 | 80 | 71 | 60 | 25 | 57 |
| Vβ-2 | 100 | 100 | 100 | 71 | 78 | 71 | 100 | 75 | 87 |
| Vβ-3 | 100 | 100 | 100 | 100 | 100 | 100 | 100 | 100 | 100 |
| Vβ-4 | 75 | 66 | 100 | 83 | 100 | 86 | 100 | 75 | 86 |
| Vβ-5 | 50 | 100 | 100 | 71 | 80 | 100 | 100 | 75 | 85 |
| Vβ-6 | 75 | 66 | 100 | 57 | 100 | 86 | 80 | 100 | 83 |
| Vβ-7 | 75 | 33 | 50 | 100 | 67 | 71 | 80 | 100 | 72 |
| Vβ-8 | 75 | 33 | 100 | 86 | 90 | 71 | 80 | 75 | 76 |
| Vβ-9 | 100 | 100 | 86 | 86 | 100 | 86 | 80 | 100 | 92 |
| Vβ-11 | 100 | 66 | 29 | 43 | 60 | 57 | 40 | 50 | 48 |
| Vβ-12 | 100 | 100 | 100 | 29 | 70 | 100 | 100 | 100 | 87 |
| Vβ-13 | 75 | 66 | 100 | 57 | 70 | 43 | 60 | 100 | 71 |
| Vβ-14 | 75 | 33 | 100 | 57 | 80 | 57 | 100 | 33 | 67 |
| Vβ-15 | 75 | 100 | 71 | 57 | 90 | 86 | 80 | 33 | 74 |
| Vβ-16 | 100 | 33 | 57 | 86 | 90 | 57 | 100 | 50 | 60 |
| Vβ-17 | 75 | 66 | 57 | 100 | 70 | 86 | 60 | 75 | 61 |
| Vβ-18 | 25 | 0 | 14 | 17 | 60 | 43 | 20 | 50 | 29 |
| Vβ-20 | 100 | 0 | 0 | 0 | 70 | 29 | 60 | 100 | 45 |
| Vβ-21 | 100 | 66 | 100 | 40 | 80 | 100 | 100 | 100 | 86 |
| Vβ-22 | 100 | 66 | 83 | 83 | 89 | 86 | 100 | 100 | 88 |
| Vβ-23 | 50 | 66 | 86 | 86 | 78 | 43 | 80 | 50 | 67 |
| Vβ-24 | 100 | 33 | 43 | 66 | 78 | 29 | 40 | 50 | 55 |
| Vβ-25 | 25 | 0 | 0 | 66 | 20 | 0 | 20 | 0 | 16 |
100% indicates that a particular Vβ family was used by a CTL at all stimulation points analysed and 50% denotes a Vβ family usage at half of the time-points analysed.
The evolution of clonality in Vβ families used in the eight CTL was investigated by sequence analysis of the Vβ RT-PCR products. Each family was categorized as either clonal (one or two major peaks) or polyclonal (more than two major peaks). In PBMC, polyclonal families predominated, and in five CTL, the number of these polyclonal families was either maintained or increased over time, although the number detected fluctuated from week to week. Figure 2 illustrates the evolution of one CTL line. In five CTL an increasing number of clonal families were detectable over the culture period, although the numbers of clones detected at each time-point for each CTL varied. In three of these CTL individual clonal Vβ families identified in PBMC samples persisted through the entire culture period (data not shown), but in the other two lines there was no persistence of Vβ clones. No particular Vβ family preferentially became clonal, and in each line the clonal populations only accounted for a minority of Vβ families used. These results indicate that the TCR in the CTL remain broad throughout the culture period.
Analysis of cytotoxic pathways used by CTL
To assess the cytolytic pathways used by the CTL, 12 lines were analysed for perforin, granzyme B, granulysin and FasL messenger RNA transcripts and protein expression, and functional assays using inhibitors of these pathways were carried out.
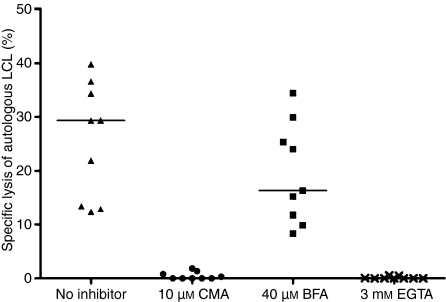
In standard chromium release assays, specific lysis of autologous LCL at an effector : target (E : T) ratio of 10 : 1 varied from 16·2% to 77·9% (average 38·7%). There was no significant lysis of HLA-mismatched allogeneic LCL or K-562 cells (data not shown). This assay was modified to identify the cytolytic pathways used by the CTL by preincubation of effector cells with inhibitors of specific effector mechanisms: CMA, which degrades perforin vacuoles; BFA, which inhibits Golgi-mediated transport of FasL; or EGTA, which inhibits exocytosis of cytolytic granules. At E : T ratios of 20 : 1, 10 : 1 and 5 : 1, both CMA and EGTA significantly inhibited specific cytotoxicity (at E : T ratio 10 : 1 P < 0·0001 for both), whereas specific lysis of cells preincubated in BFA did not differ significantly from controls (P = 0·25; Fig. 3). These results indicate that cell lysis was mediated by calcium-dependent exocytosis rather than by Golgi-dependent transport of cytolytic proteins.
Figure 3.
Cytotoxic T lymphocytes (CTL) were preincubated with inhibitors: concanamycin A (CMA), brefeldin A (BFA) and ethylene glycol-bis (β-aminoethylether)-N,N,N′,N′-tetraacetic acid (EGTA), and the cells were then used as effectors against autologous lymphoblastoid cell line targets at an effector : target ratio of 10 : 1 in a 4-hr chromium release assay. The optimum doses of these inhibitors were selected by dose-escalation experiments. The black bars show the median values (median value 0 for CMA and EGTA). There was significant reduction of cytotoxicity with CMA and EGTA (for both, P < 0·0001).
The RT-PCR identified messenger RNA transcripts for perforin, granzyme B, granulysin and FasL in all CTL. In addition, three lines examined weekly showed regular expression of perforin and granzyme B, but the expression of FasL was not regularly detected. However, as some of the LCL used to stimulate the CTL were found to express transcripts for perforin and granulysin (data not shown), these cells, potentially remaining in the cultures post-CTL stimulation, could have been the origin of the transcripts identified in CTL. We therefore used flow cytometry to detect protein expression of perforin, granzyme B and FasL on 12 CTL and to identify expression in CD4+ and CD8+ CTL populations. Granulysin expression was detected by Western blotting.
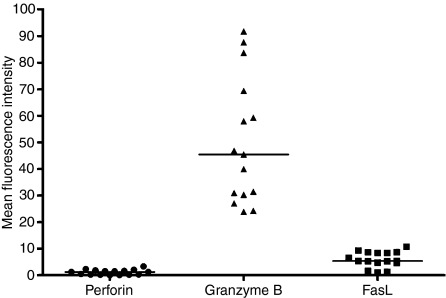
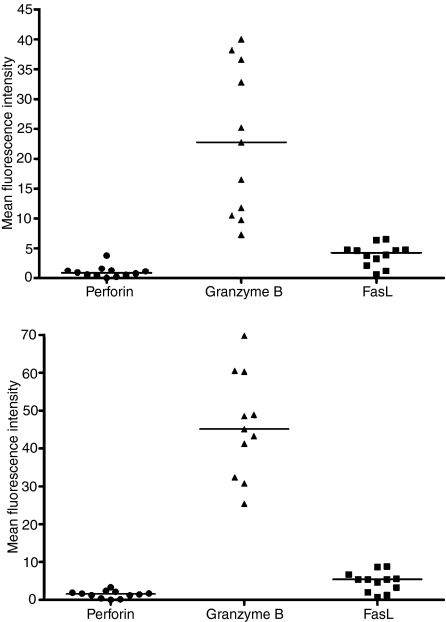
The percentage of cells expressing cytolytic molecules in 12 lines examined ranged from 0·4% to 3·3% for perforin, from 68·2 to 98·4% for granzyme B and from 0·5 to 27·8% for FasL. In all cases a higher proportion of cells expressed granzyme B than the other two molecules (Fig. 4). Granzyme B expression was high in both CD4+ and CD8+ cells within the CTL; however, a significantly greater proportion of CD8+ than CD4+ T cells expressed granzyme B (P < 0·0001) and significantly more granzyme B was detected in CD8+ T cells than in CD4+ T cells (P = 0·001; Fig. 5a,b). There was no significant difference between the levels of perforin and FasL expressed. Western blotting revealed granulysin protein expression in four of the 12 (33%) CTL. Granulysin was not expressed in the matching LCL used for the CTL stimulation. These results indicate that CTL in the stationary phase of growth exert their cytotoxic activity using a calcium-dependent mechanism in which granzyme B appears to be the principal effector molecule facilitated by small amounts of perforin.
Figure 4.
Mean fluorescence intensity (an arbitrary unit of fluorescence intensity) of perforin, granzyme B and Fas ligand (FasL) in the cytotoxic T lymphocyte (CTL) cell lines. Mean fluorescence intensity (MFI) was an arbitrary unit of fluorescence intensity. The black bars show the median values.
Figure 5.
Mean fluorescence intensity (an arbitrary unit of fluorescence intensity) of perforin, granzyme B and Fas ligand (FasL): (a) in CD4+ T cells in cytotoxic T lymphocytes (CTL) cell lines, and (b) in CD8+ T cells in CTL cell lines. The black bars show the median values.
Intracellular cytokine production
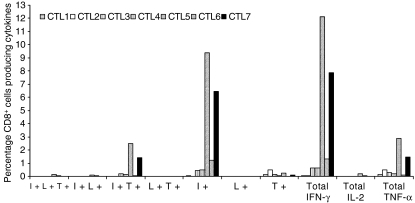
Seven CTL lines were examined to characterize the potential for multiple cytokine production upon restimulation with autologous LCL. CD8+ cells in all seven CTL lines produced intracellular IFN-γ (ranging from 0·06% to 12·12%) and TNF-α (ranging from 0·09% to 2·89%). The cells were mainly single cytokine producers (IFN-γ or TNF-α), although there were a small percentage (0·002–2·5%) of polyfunctional cells (producing both IFN-γ and TNF-α) in all CTL lines (Fig. 6). Not surprisingly, IL-2 production was negligible because these CTL were grown in IL-2-enriched growth medium.
Figure 6.
Percentage of CD8+ cells in each cytotoxic T lymphocytes (CTL) cell line producing intracellular cytokines [interferon-γ (IFNγ), interleukin-2 (IL-2) and tumour necrosis factor-α (TNF-α)] upon restimulation with autologous lymphoblastoid cell line. I+, cells producing IFN-γ alone; L+, cells producing IL-2 alone and T+, cells producing TNF-α alone. I+L+T+, cells producing all three cytokines; I+L+, cells producing IFN-γ and IL-2; I+T+, cells producing IFN-γ and TNF-α; L+T+, cells producing IL-2 and TNF-α.
Discussion
In the present study we investigated the growth characteristics, polyfunctionality, cytolytic mechanisms and Vβ family usage and clonality in a series of EBV-specific CTL grown from healthy blood donors. We identified that the cell phenotype changed from mainly non-activated, non-antigen-experienced (CD45RA+, CD27+, CD28+, CD62L+, CD69−) CD4+ and CD8+ T cells to that of activated, antigen-experienced, predominantly CD4+ or CD8+ CTL with an increase in CD69 and CD45RO, and a decrease in CD27, CD28, CD62L expression (Fig. 1). Overall, these findings are in line with our previous findings using a larger panel of EBV-specific CTL lines.13
Dynamic changes continued to occur in CTL and analysis of Vβ families showed a diverse and fluid usage with multiple families detectable either continuously or periodically throughout the culture period (Table 1; Fig. 2). No preferential Vβ usage was apparent and no focusing of the TCR repertoire or expansion of dominant clones occurred over time. Our CTL established ex vivo from the peripheral blood of healthy seropositive donors represent a snapshot of the in vivo T-cell repertoire, and as such may shed light on recent in vivo findings. During primary EBV infection (acute infectious mononucleosis) the CTL response is dominated by a huge expansion of highly activated CD8+ T cells which mainly recognize lytic viral antigens and show monoclonal or oligoclonal TCR usage within expanded Vβ families.16 As the infectious mononucleosis resolves these clones decrease in number with many becoming undetectable in the memory T-cell repertoire. It is not clear why or how this dramatic change in T-cell repertoire between acute and persistent infection occurs but one suggestion is that functional exhaustion with deletion of many Vβ families may occur during infectious mononucleosis,17 a phenomenon also reported in primary human immunodeficiency virus infection.18 However, our findings showing a broad Vβ family usage in CTL grown ex vivo perhaps argue against clonal deletion, rather favouring the maintenance of clonal populations in vivo at low cell numbers and their amplification ex vivo by the addition of antigen and IL-2 to the culture system. However, we did not examine the T-cell precursor phenotype in PBMC or the changes in epitope specificities in CTL lines over time.
The EBV-specific killing was predominantly mediated by the granzyme B cytolytic pathway (Fig. 3). Interestingly, the levels of perforin were comparatively low, suggesting that perforin may be essential in facilitating granzyme B entry and activity but is not directly involved in pore formation and cell lysis.19 Although we did not carry out experiments with separated CD4+ cells in our study, the fact that the CD4+ T cells within our CTL had a similar phenotype and expressed identical cytolytic molecules (predominantly granzyme B; Figs 4 and 5) as CD8+ T cells highlights recent findings suggesting that these cells play an important role in EBV immunosurveillance, perhaps particularly in killing virus-infected cells expressing HLA class II, such as B lymphocytes.20 These cells maintained their ability to produce T helper type 1 cytokines (IFN-γ, TNF-α, IL-2) and remained polyfunctional (IFN-γ and TNF-α producers) upon re-exposure to LCL, even after 8–12 weeks of culture.21
The survival and expansion in culture of a wide range of TCR clones in a phenotypically mature and cytotoxic population is probably advantageous when producing CTL for the therapeutic use in EBV-associated tumours. Cytotoxic T lymphocytes with a highly diverse mix of TCR clones are more likely to contain cells with TCRs of high avidity and specificity for the EBV peptides displayed on the surface of tumour cells, which provides a more versatile tool in PTLD treatment.
Acknowledgments
V.J.V. was supported by a University of Edinburgh College of Medicine and Veterinary Medicine studentship. The authors would like to thank Gwen Wilkie, Marie Jones, David Burns, Phoebe Wingate and Gillian Urquhart at the Edinburgh University for their technical assistance and advice on CTL work, and the staff and blood donors at the Scottish National Blood Transfusion Services for providing the blood samples.
Disclosures
The authors declare no conflict of interest.
References
- 1.Babcock GJ, Decker LL, Volk M, et al. EBV persistence in memory B cells in vivo. Immunity. 1998;9:395–404. doi: 10.1016/s1074-7613(00)80622-6. [DOI] [PubMed] [Google Scholar]
- 2.Macsween KF, Crawford DH. Epstein–Barr virus – recent advances. Lancet Infect Dis. 2003;3:131–40. doi: 10.1016/s1473-3099(03)00543-7. [DOI] [PubMed] [Google Scholar]
- 3.Moss DJ, Burrows SR, Silins SL, et al. The immunology of Epstein–Barr virus infection. Philos Trans R Soc Lond B Biol Sci. 2001;356:475–88. doi: 10.1098/rstb.2000.0784. [DOI] [PMC free article] [PubMed] [Google Scholar]
- 4.Steven NM, Annels NE, Kumar A, et al. Immediate early and early lytic cycle proteins are frequent targets of the Epstein–Barr virus-induced cytotoxic T cell response. J Exp Med. 1997;185:1605–17. doi: 10.1084/jem.185.9.1605. [DOI] [PMC free article] [PubMed] [Google Scholar]
- 5.Bevan MJ. Helping the CD8(+) T-cell response. Nat Rev Immunol. 2004;4:595–602. doi: 10.1038/nri1413. [DOI] [PubMed] [Google Scholar]
- 6.Münz C, Bickham KL, Subklewe M, et al. Human CD4(+) T lymphocytes consistently respond to the latent Epstein–Barr virus nuclear antigen EBNA1. J Exp Med. 2000;191:1649–60. doi: 10.1084/jem.191.10.1649. [DOI] [PMC free article] [PubMed] [Google Scholar]
- 7.Burns DM, Crawford DH. Epstein–Barr virus-specific cytotoxic T-lymphocytes for adoptive immunotherapy of post-transplant lymphoproliferative disease. Blood Rev. 2004;18:193–209. doi: 10.1016/j.blre.2003.12.002. [DOI] [PubMed] [Google Scholar]
- 8.Rooney CM, Ng CYC, Loftin S, et al. Use of gene-modified virus-specific T lymphocytes to control Epstein–Barr-virus-related lymphoproliferation. Lancet. 1995;345:9–13. doi: 10.1016/s0140-6736(95)91150-2. [DOI] [PubMed] [Google Scholar]
- 9.Comoli P, Labirio M, Basso S, et al. Infusion of autologous Epstein–Barr virus (EBV) -specific cytotoxic T cells for prevention of EBV-related lymphoproliferative disorder in solid organ transplant recipients with evidence of active virus replication. Blood. 2002;99:2592–8. doi: 10.1182/blood.v99.7.2592. [DOI] [PubMed] [Google Scholar]
- 10.Sherritt MA, Bharadwaj M, Burrows JM, et al. Reconstitution of the latent T-lymphocyte response to Epstein–Barr virus is coincident with long-term recovery from posttransplant lymphoma after adoptive immunotherapy. Transplantation. 2003;75:1556–60. doi: 10.1097/01.TP.0000058745.02123.6F. [DOI] [PubMed] [Google Scholar]
- 11.Haque T, Wilkie GM, Taylor C, et al. Treatment of Epstein–Barr-virus-positive post-transplantation lymphoproliferative disease with partly HLA-matched allogeneic cytotoxic T cells. Lancet. 2002;360:436–42. doi: 10.1016/S0140-6736(02)09672-1. [DOI] [PubMed] [Google Scholar]
- 12.Haque T, Wilkie GM, Jones MM, et al. Allogeneic cytotoxic T-cell therapy for EBV-positive posttransplantation lymphoproliferative disease: results of a phase 2 multicenter clinical trial. Blood. 2007;110:1123–31. doi: 10.1182/blood-2006-12-063008. [DOI] [PubMed] [Google Scholar]
- 13.Wilkie GM, Taylor C, Jones MM, et al. Establishment and characterization of a bank of cytotoxic T lymphocytes for immunotherapy of Epstein–Barr virus-associated diseases. J Immunother. 2004;27:309–16. doi: 10.1097/00002371-200407000-00007. [DOI] [PubMed] [Google Scholar]
- 14.Rozen S, Skaletsky J. Primer3 on the WWW for general users and for biologist programmers. In: Krawetz S, Misener S, editors. Bioinformatics Methods and Protocols: Methods in Molecular Biology. Totowa: Humana Press; 2000. pp. 385–6. [DOI] [PubMed] [Google Scholar]
- 15.Foster AE, Marangolo M, Sartor MM, et al. Human CD62L− memory T cells are less responsive to alloantigen stimulation than CD62L+ naive T cells: potential for adoptive immunotherapy and allodepletion. Blood. 2004;104:2403–9. doi: 10.1182/blood-2003-12-4431. [DOI] [PubMed] [Google Scholar]
- 16.Callan MF, Steven N, Krausa P, et al. Large clonal expansions of CD8+ T cells in acute infectious mononucleosis. Nat Med. 1996;2:906–11. doi: 10.1038/nm0896-906. [DOI] [PubMed] [Google Scholar]
- 17.Callan MF, Fazou C, Yang H, et al. CD8(+) T-cell selection, function, and death in the primary immune response in vivo. J Clin Invest. 2000;106:1251–61. doi: 10.1172/JCI10590. [DOI] [PMC free article] [PubMed] [Google Scholar]
- 18.Pantaleo G, Soudeyns H, Demarest JF, et al. Evidence for rapid disappearance of initially expanded HIV-specific CD8+ T cell clones during primary HIV infection. Proc Natl Acad Sci USA. 1997;94:9848–53. doi: 10.1073/pnas.94.18.9848. [DOI] [PMC free article] [PubMed] [Google Scholar]
- 19.Metkar SS, Wang B, Aguilar-Santelises M, et al. Cytotoxic cell granule-mediated apoptosis: perforin delivers granzyme B-serglycin complexes into target cells without plasma membrane pore formation. Immunity. 2002;16:417–28. doi: 10.1016/s1074-7613(02)00286-8. [DOI] [PubMed] [Google Scholar]
- 20.Long HM, Haigh TA, Gudgeon NH, et al. CD4+ T-cell responses to Epstein–Barr virus (EBV) latent-cycle antigens and the recognition of EBV-transformed lymphoblastoid cell lines. J Virol. 2005;79:4896–907. doi: 10.1128/JVI.79.8.4896-4907.2005. [DOI] [PMC free article] [PubMed] [Google Scholar]
- 21.Seder RA, Darrah PA, Roederer M. T-cell quality in memory and protection: implications for vaccine design. Nat Rev Immunol. 2008;8:247–58. doi: 10.1038/nri2274. [DOI] [PubMed] [Google Scholar]


