Abstract
The rhythmic pyloric network of the lobster stomatogastric system approximately maintains phase (that is, the burst durations and durations between the bursts of its neurons change proportionally) when network cycle period is altered by current injection into the network pacemaker (Hooper, 1997a,b). When isolated from the network and driven by rhythmic hyperpolarizing current pulses, the delay to firing after each pulse of at least one network neuron type [pyloric (PY)] varies in a phase-maintaining manner when cycle period is varied (Hooper, 1998). These variations require PY neurons to have intrinsic mechanisms that respond to changes in neuron activity on time scales at least as long as 2 s. Slowly activating and deactivating conductances could provide such a mechanism. We tested this possibility by building models containing various slow conductances. This work showed that such conductances could indeed support intrinsic phase maintenance, and we show here results for one such conductance, a slow potassium conductance. These conductances supported phase maintenance because their mean activation level changed, hence altering neuron postinhibition firing delay, when the rhythmic input to the neuron changed. Switching the sign of the dependence of slow-conductance activation and deactivation on membrane potential resulted in neuron delays switching to change in an anti-phase-maintaining manner. These data suggest that slow conductances or similar slow processes such as changes in intracellular Ca2+ concentration could underlie phase maintenance in pyloric network neurons.
Keywords: burst, central pattern generator, crustacea, motor control, network, neuron, potassium channels, stomatogastric
Introduction
Rhythmic motor patterns are produced across a wide range of cycle periods. In some motor patterns (e.g., walking) power phase duration primarily changes with cycle period (Grillner and Wallén, 1985). Other motor patterns [leech (Pearce and Friesen, 1985) and lamprey (Grillner et al., 1987) swimming, lobster pyloric network (Hooper, 1997a,b), and crab gill bailer (DiCaprio et al., 1997)] maintain phase as cycle period varies. Phase maintenance requires that motor pattern durations (action potential burst durations and interburst intervals) change proportionally with cycle period. These durations depend on synaptic and cellular dynamics. For instance, in networks dominated by inhibitory synapses (most known motor networks), many neurons fire due to intrinsic, inhibition-induced, excitatory responses (e.g., postinhibitory rebound). The duration between the end of an inhibiting neuron's burst, and the beginning of the burst of the neuron it inhibits, thus depends both on how long the inhibition lasts after the inhibiting neuron stops firing, and the dynamics of the inhibited neuron's subsequent excitation. To maintain phase the durations of one or both of these processes must change proportionally with cycle period.
We have been examining phase maintenance of pyloric (PY) neurons of the lobster pyloric network (Hooper, 1997a,b). When rhythmic trains of hyperpolarizing pulses are injected into PY neurons that have been isolated from the pyloric network, the neurons fire with a delay after each pulse. Delay duration changes in a phase-maintaining manner when stimulus-train cycle period is altered (Hooper, 1998). PY neuron phase maintenance therefore results in part from mechanisms intrinsic to the neurons. Because the neurons cannot “know” the input's temporal characteristics until at least one cycle is complete, these mechanisms must respond on time scales equal to at least one cycle period, durations as great as 2 s in the study by Hooper (1998). One such mechanism could be slowly activating and/or deactivating voltage-dependent membrane conductances. The mean activation level of such conductances would change as neuron activity changed. If the conductances affected neuron rebound dynamics, these changes could alter neuron delay to firing.
To test the feasibility of this hypothesis we repeated our work on isolated PY neurons and measured not only steady-state PY firing delays but also the cycle-by-cycle delay changes that occurred immediately after the driving input was changed, analyses not performed in our earlier work (Hooper, 1998). Previous pyloric neuron models did not reproduce the observed shifts in PY firing. Models containing slowly activating and deactivating conductances reproduced the PY neuron activity, and as predicted, did so by slow changes in mean activation. To further test this hypothesis we reversed in one model the voltage dependence of activation and deactivation of the model's slow conductance and showed that this reversed the dependence of the model's rebound delay on driving input temporal characteristics. Slow conductances or similar slow processes such as changes in intracellular Ca2+ concentration could thus support phase maintenance, and differing whole-cell responses to rhythmic input could be “engineered” by modifying the voltage dependence of these processes.
Preliminary reports of these data have appeared in abstract form (Buchman et al., 2000).
Materials and Methods
Electrophysiology.
Panulirus interruptus were purchased from Don Tomlinson Commercial Fishing and maintained in aquaria with 10–13°C circulating artificial seawater. Dissection was standard (Selverston et al., 1976). Preparations were continuously perfused with 10–13°C P. interruptus saline (in mm, 479 NaCl, 12.9 KCl, 13.7 CaCl2, 3.9 Na2SO4, 10 MgSO4, 10.9 dextrose, 11.1 Tris base, 5.1 maleic acid, pH 7.5–7.6; Sigma or Fisher Scientific). Neurons were identified by comparing intracellular recordings of spiking activity (made with an Axoclamp 2A or 2B, and glass microelectrodes filled with 0.55 m K2SO4, 0.02 m KCl, resistance 10–20 MΩ) to extracellular recordings (made with an A-M System differential amplifier and bipolar stainless-steel electrodes insulated from the bath with petroleum jelly) from nerves containing the pyloric motor neuron axons. PY neurons were isolated from the network by filling cholinergic neurons presynaptic to them (the pyloric dilator and ventricular dilator neurons) with Lucifer yellow and photoinactivating them with a helium–cadmium blue laser (Liconix) (Miller and Selverston, 1979) and blocking glutamatergic input from other network neurons with 10−5 m picrotoxin (Bidaut, 1980).
Square-wave current injections were made with two electrodes in the neuron somata, one to inject current and the other to record neuron membrane potential response. Depending on the neuron, square waves approximate the actual inhibitions that pyloric neurons receive with varying degrees of accuracy. PY neuron slow-wave inhibition profiles (see Fig. 1) are actually more triangular than square. However, the purpose of the present work was to examine the extent to which models containing slow conductances could explain PY neuron activity. The neurons and models were in all cases driven with identical square-wave inputs, and thus our use of square-wave inputs should not affect the validity of the comparisons made here. Current injection protocols were driven, and neuron response recorded, using a Cambridge Electronic Design 1401 plus interface and Spike2 software and rebound delays calculated with user-written Spike2 scripts.
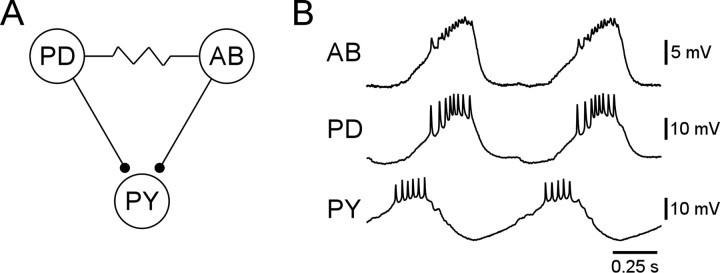
Figure 1.
Reduced pyloric network (A) and spontaneous rhythmic activity (B) of the pacemaker ensemble (AB and PD neurons) and one follower (PY) neuron. Note the long delay between the end of the pacemaker bursts and the beginning of the PY burst. Resistor symbol, Electrical coupling; small circles, inhibitory chemical synapses.
Modeling.
Modeling was performed in Modelmaker version 4 (FamilyGenetix, formerly known as Cherwell Scientific Publishing) using Runge–Kutta variable time step integration with an accuracy of 0.001. Rebound delays were calculated with programs written in C. The equations for the standard pyloric model (see Fig. 6) were exactly those in the study by Buchholtz et al. (1992). The equations for the slow potassium and reversed slow potassium model are presented in the Appendix.
Figure 6.
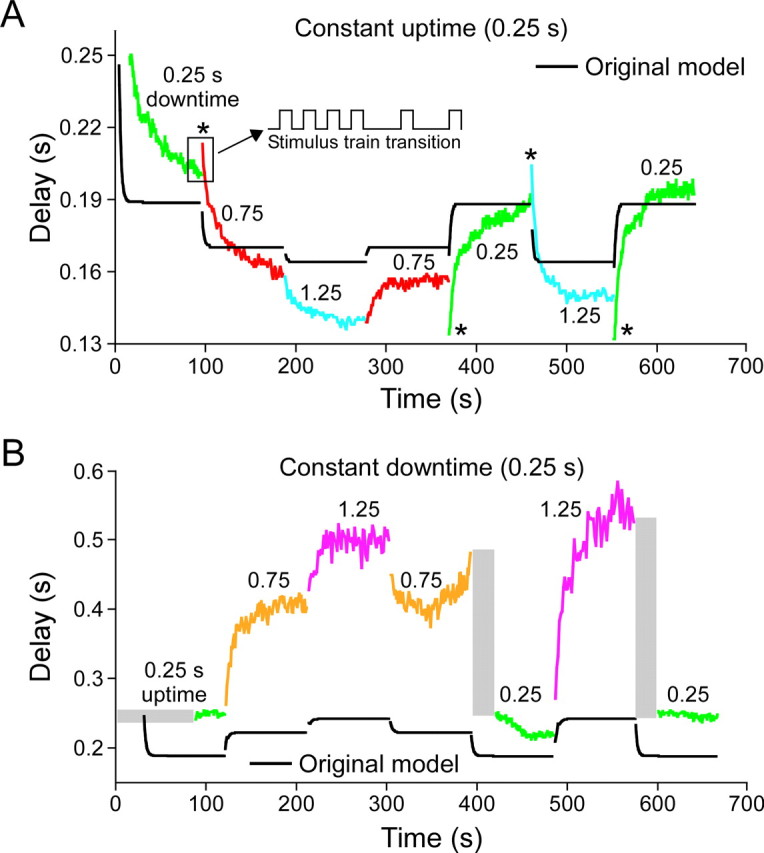
Response of a PY neuron to a series of stimulation patterns (uptime and downtime values shown in panel titles and values written above each colored portion of trace) and of a pyloric neuron model (black lines). A, Responses with a constant uptime and varying downtime. B, Responses with a constant downtime and varying uptime. Asterisks mark cases in which the neuron response was biphasic. Gray rectangles mark times in which the neuron did not fire spikes. Note that the original model did not correctly reproduce steady-state rebound times, biphasic responses, or periods without neuron firing.
Results
Figure 1A shows a reduced version of the pyloric network [for reviews of the network's connectivity and cellular properties, see Harris-Warrick and Marder (1991), Harris-Warrick et al. (1992), Marder et al. (1993), Nusbaum and Beenhakker (2002), Hooper and DiCaprio (2004), Katz and Hooper (2007), and Marder and Bucher (2007)]. The anterior burster (AB) is an endogenously rhythmic pacemaker neuron (Fig. 1B). The two pyloric dilator (PD) neurons fire with the AB due to the electrical coupling among the three neurons (Fig. 1B). The PY neurons are inhibited by the AB and PD neurons, and therefore fire out of phase with them (Fig. 1B). That they fire at all is due to their containing hyperpolarization-activated, depolarizing conductances (e.g., Ih) that result in the neurons showing postinhibitory rebound. These postinhibitory rebounds activate other conductances that produce long-lasting depolarized states (plateau potentials) that support the PY neuron bursts and that are ended by the AB/PD burst that begins the next pyloric cycle.
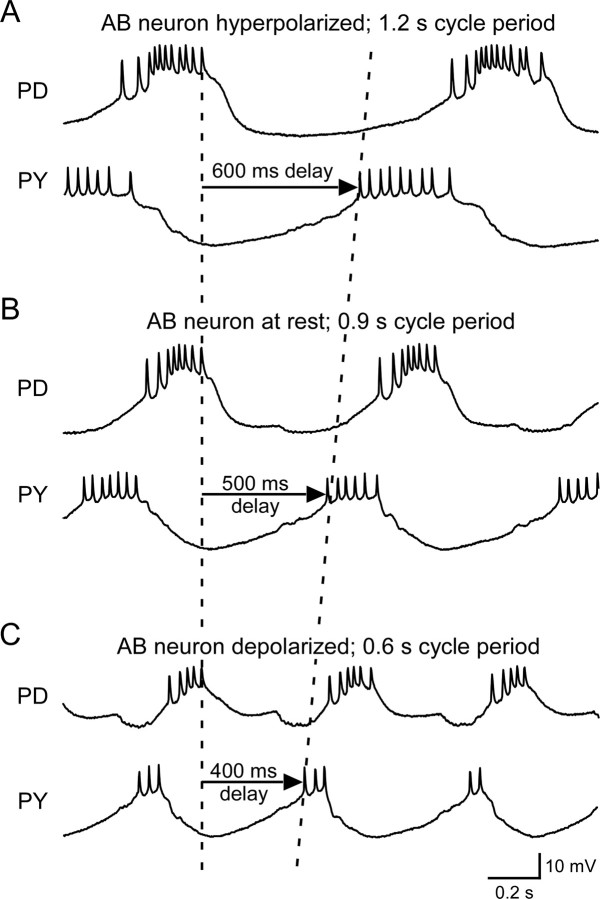
Phase maintenance requires that burst duration and interburst interval change proportionally with cycle period (Fig. 2). Pacemaker ensemble (AB and PD) activity approximately maintains phase when network cycle period is altered by current injection into the AB neuron (Fig. 2, top traces) (Hooper, 1997a,b). This phase maintenance results from changes in current flow between the AB and PD neurons when current is injected into the AB (Abbott et al., 1991) and does not concern us here. We study here instead the mechanisms that maintain PY neuron phase relative to pacemaker activity (Fig. 2, bottom traces).
Figure 2.
The interval between the end of pacemaker activity (here monitored by a PD recording) and the beginning of PY neuron activity increased (A) and decreased (C) as pyloric cycle period was increased and decreased from rest (B). Calibration bars apply to all panels.
The PY neurons begin to fire hundreds of milliseconds after the end of the AB/PD burst (Figs. 1B, 2). When network cycle period is varied this delay increases as cycle period increases (Fig. 2, compare B, A) and decreases as cycle period decreases (Fig. 2, compare B, C). These changes do not perfectly maintain the phase of PY neuron burst beginnings; for perfect phase maintenance, the delays would be 665 ms in Figure 2A and 333 ms in Figure 2C. However, they maintain phase much better than if the delay between the end of the AB/PD burst and the beginning of the PY burst were constant. For instance, in the case at hand in the real data the phase of the PY burst beginning was 0.55 at rest (Fig. 2B), 0.5 when cycle period was increased (Fig. 2A), and 0.67 when cycle was decreased (Fig. 2C). If the delay between the end of the AB/PD neuron burst and the beginning of the PY neuron burst had remained a constant 500 ms as cycle period changed, the phase of the PY neuron burst beginning would have been 0.42 when cycle period was increased (Fig. 2A) and 0.83 when cycle period was decreased (Fig. 2C).
These changes in the delay between the end of the AB/PD neuron burst and PY neuron burst beginnings could arise in many ways. For instance, in addition to being inhibited by the AB and PD neurons (Fig. 1), the PY neurons are also inhibited by another pyloric neuron, the lateral pyloric (LP) neuron, which fires between the end of the AB/PD neuron burst and the beginning of the PY neuron burst, and whose burst duration increases with increased cycle period and decreases with decreased cycle period (Hooper, 1997a). The shifts in when the PY neurons began to fire could thus theoretically have been due to changes in the amount of inhibition received by the PY neurons from the LP due to these changes in LP burst duration. However, LP neuron removal from the pyloric network by hyperpolarization does not alter PY neuron firing delay shifts as cycle period changes, and LP inhibition thus apparently plays no role in PY neuron phase maintenance, at least in control saline (Weaver and Hooper, 2003) (it is for this reason that the LP neuron and its synapses were not included in Fig. 1A).
An alternative explanation for the changes in PY neuron firing delay is the PY neurons having intrinsic phase-maintaining mechanisms, an explanation verified by experiments on PY neurons that have been isolated from the network (Hooper, 1998). However, these PY neurons, although isolated from other pyloric network neurons, are still electrically coupled to one another (there are 6–8 PY neurons in the network). In theory, phase maintenance in them could thus arise from current passing among them in a manner similar to the current-passing mechanism mentioned above that underlies phase maintenance in the AB/PD neuron pacemaker group. This current-passing mechanism occurs because the AB neuron is an endogenous oscillator, the electrical coupling between the AB and PD neurons is strong enough that the neurons rhythmically oscillate in phase, and when the cycle period of the ensemble is changed by current injection into the AB neuron the amplitude of the voltage oscillation of the AB and PD neurons change to different degrees. This changes the amount of current flowing between the AB and PD neurons in such a way that the burst duration of the ensemble maintains phase as ensemble cycle period changes (Abbott et al., 1991).
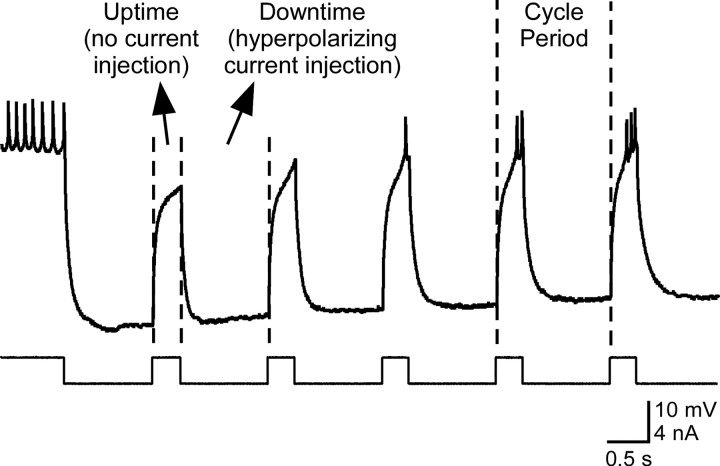
Under the conditions used here, PY neurons do not typically oscillate when isolated from the other pyloric network neurons, and recordings from PY neurons other than those into which we were injecting current showed that the electrical coupling between these neurons was not sufficient to induce large changes in the activity of the other PY neurons. Although this does not prove that a current-passing mechanism plays no role in PY neuron phase maintenance, it does suggest that PY neurons may have cell-autonomous intrinsic phase-maintaining mechanisms. Our goal in the present research was to measure isolated PY neuron responses to many types of rhythmic driving input and attempt to gain insight into how such cell-autonomous mechanisms might function by building models that qualitatively reproduced these responses. We always used trains of rhythmic hyperpolarizing current pulses as the driving input (Fig. 3). Before the trains began the neurons typically fired tonically. In the example shown here the neuron did not fire in the period in which no current was injected (the first “uptime”) following the first hyperpolarizing pulse (the first “downtime”). After the second downtime the neuron again fired no spikes, but its membrane potential during the following uptime was more depolarized than in the first uptime. In the third uptime the neuron fired one spike, in the fourth it fired two, and in the fifth (and subsequent uptimes, data not shown) it fired three. These data thus show two aspects of the neuron's response to the driving input, the neuron's changing response after pulse train beginning (the first 4 uptimes) and its response at steady state (the fifth uptime).
Figure 3.
Definition of stimulation pattern and slow establishment of steady-state rebound delay. PY neurons were stimulated with rhythmic trains of hyperpolarizing pulses (downtime, hyperpolarization duration; uptime, duration without current injection; cycle period = downtime + uptime). Before stimulation, the neuron fired tonically. After stimulation began, the neuron initially did not fire (first two cycles) and then fired one, two, and finally three spikes, with continually decreasing rebound delay (cycles 3, 4, and 5).
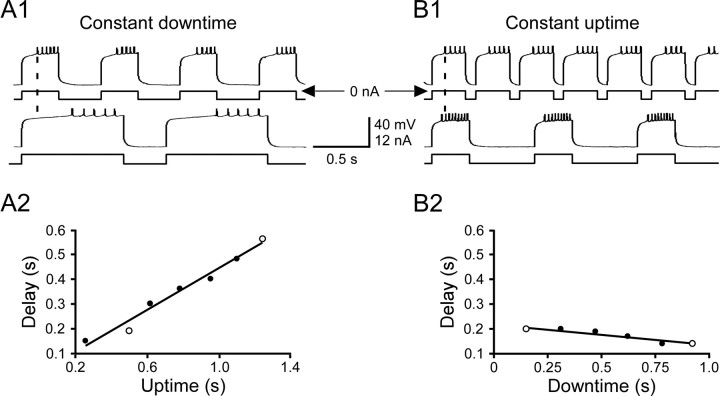
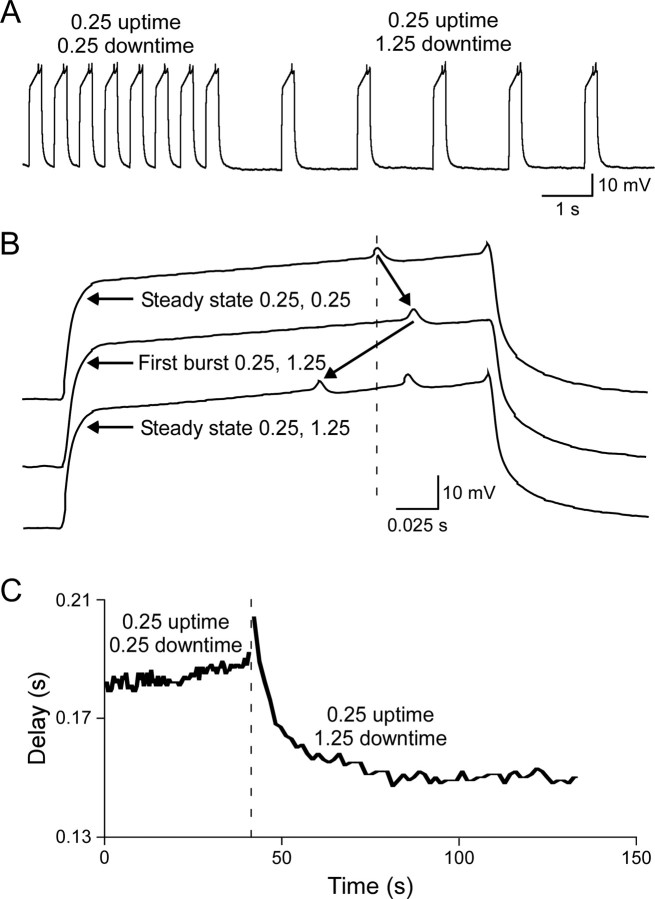
Steady-state PY neuron firing delays (the time from the end of the hyperpolarizing pulse to the first spike) depended on the temporal characteristics of the rhythmic pulse train. Rebound delay increased when uptime was increased with a constant downtime (Fig. 4, left) (downtime 350 ms) and decreased when downtime was increased with a constant uptime (Fig. 4, right) (uptime 300 ms). Similar to the changes in rebound delay seen in the initial cycles in Figure 3, it took multiple cycles for new steady-state rebound delays to be established when the temporal characteristics of the driving input were changed. Figure 5 shows how rebound delay changed at a transition (Fig. 5A) from a pattern with a 0.25 s uptime and a 0.25 s downtime to a pattern with a 0.25 s uptime and a 1.25 s downtime. Before the pattern change the neuron's rebound delay had reached steady state (Fig. 5B, top trace). The rebound delay in the first burst after the change was longer than the previous rebound delay (Fig. 5B, middle trace; rightward slanting arrow shows delay increase) and then progressively declined to a new steady-state value shorter than that in the original pattern (Fig. 5B, bottom trace; leftward slanting arrow shows delay decrease). The time course of the neuron's response to the pattern change was thus biphasic (Fig. 5C), with rebound delay increasing immediately after the change in stimulation pattern and then slowly decreasing to finally reach a new shorter steady-state value.
Figure 4.
Steady-state rebound delay varied with the temporal characteristics of the stimulating pattern. A, Downtime was a constant 350 ms and uptime varied from 250 to 1250 ms; rebound delay increased with uptime duration. B, Uptime was a constant 300 ms and downtime varied from 150 to 925 ms; rebound delay decreased with downtime duration. A1, B1, Raw data for the two patterns marked with open circles in A2 and B2. A2, B2, Mean summary data. Lines are linear best fits.
Figure 5.
It took many cycles for rebound delay to stabilize when the stimulating pattern was changed, and the response could be biphasic. A, Raw data for one pattern change. B, Expanded time scale traces of rebound delay at steady state for the first stimulation pattern (dashed line) before the pattern change (top trace), in the first uptime after the change (middle trace), and at steady state after the change (bottom trace). Note that rebound delay initially increased and then at steady state reached a shorter value (arrows). C, Complete time course of rebound delay change associated with stimulation pattern change (occurring at dashed line).
These observations (that PY neuron steady-state rebound delay changed when the temporal patterns of the stimulation pattern changed, and that the changes in PY rebound delay had characteristic time courses when the pattern of stimulation was changed) suggested that driving real PY neurons with a wide range of stimulation patterns and comparing their responses to the responses of conductance-based neuron models would be a powerful method for comparing the performance of different models. An important consideration here is what stimulation patterns to use. Consideration of Figure 2 shows that in the intact network PY neurons are inhibited for ∼75% of network cycle period, approximately the same percentage of cycle period that the isolated PY neuron in Figure 3 was inhibited. However, the percentage of cycle period that downtime comprised in the data in Figures 4 and 5 were often far from what PY neurons would ever experience in the real network (for instance, downtime was 50% of cycle period in the first trace in Fig. 4A1, 30% in the second trace of Fig. 4A1, 20% in the first trace of Fig. 4B1, 62% in the second trace of Fig. 4B1, 50% in the left portion of the trace in Fig. 5A, and 83% in the right portion of the trace in Fig. 5A).
It might initially seem that driving the neurons with patterns unlike those they receive in the intact network, being unphysiological, is an incorrect approach. However, if these patterns are chosen to sample a larger range of stimulation parameters, doing so provides a much fuller characterization of the neuron's response properties than would driving the neurons with the smaller range present in the intact network. Models that can accurately reproduce the response of the neurons across this wider range of stimulation patterns will also (provided the range includes the physiological values) clearly be able to reproduce neuron responses to the smaller range seen physiologically. With these considerations in mind we therefore chose to drive the PY neurons with a wide range of input patterns.
Figure 6 shows the rebound delay response of one PY neuron to the chosen set of stimulation patterns. Figure 6A shows neuron responses to a series of downtime changes with a constant 0.25 s uptime [as percentages of cycle period, the downtimes were 50% (0.25 s downtime), 75% (0.75 s downtime), and 83% (1.25 s downtime)]. Figure 6B shows neuron responses to a series of uptime changes with a constant 0.25 s downtime [as percentages of cycle period, the downtimes were 50% (0.25 s uptime), 25% (0.75 s uptime), and 17% (1.25 s uptime)]. All PY neurons (n = 5 from 3 animals) showed qualitatively similar responses [including having changes that induced biphasic responses (asterisks) and times after some transitions in which no neuron firing occurred (gray rectangles)] to these stimulation patterns, although the responses of different PY neurons could differ quantitatively [e.g., have different average rebound delays (a shift up or down of the entire curve) or different steady-state rebound delay values for some of the individual stimulation patterns]. This qualitative similarity across PY neurons, but differences in quantitative detail, is consistent with earlier data showing that, when PY neuron steady-state rebound delay is plotted against cycle period and duty cycle (burst duration divided by cycle period), although best planar fits to the data always slope up in both directions, plane slopes and offsets vary from PY neuron to PY neuron (Hooper, 1998). Also shown in this figure are the responses of a model of the LP neuron (Buchholtz et al., 1992) to the same pattern of current injections (black lines). The model did not replicate well the neuron data with respect to steady-state rebound delay values, how quickly these values were reached, the presence of biphasic responses, or the presence of times after some transitions in which no neuron firing occurred.
We were unable to find, using a by-hand search, a set of maximum conductance values of the Buchholtz et al. (1992) model that reproduced the data in Figure 6. Consideration of these efforts showed that a major difficulty was that model responses after stimulation pattern changes were always more rapid than real neuron responses. This difficulty is not surprising, since, as noted earlier, the LP neuron fires earlier after the AB/PD neuron inhibition than do the PY neurons, and it is known that the PY neurons have intrinsic properties that delay their rebound after inhibition (Hartline, 1979). This delayed response could result from the PY neurons having slowly activating or inactivating conductances, and we therefore built models with such conductances to test whether these models could better reproduce the data. Figure 7 shows the responses of a model with a slowly activating and deactivating potassium current. Model steady-state rebound delays were not perfect, particularly in the constant downtime stimulations, but they were much closer to the real data than those of the original model. Moreover, the model qualitatively reproduced real neuron responses. In particular, the model captured all biphasic responses (the last one, from a 1.25 s to a 0.25 s downtime in Fig. 7A, is not visible because it perfectly reproduces the data) and well reproduced most of the slow time courses with which the steady-state values were achieved. To compare further the response of the two models, we also plotted rebound delay versus cycle period for four stimulation patterns with identical (0.5) duty cycles (Fig. 7C). The Buchholtz et al. (1992) model showed no change in rebound delay with changes in cycle period. The slow model did not perfectly reproduce the real data, but was much closer to doing so than was the original.
Figure 7.
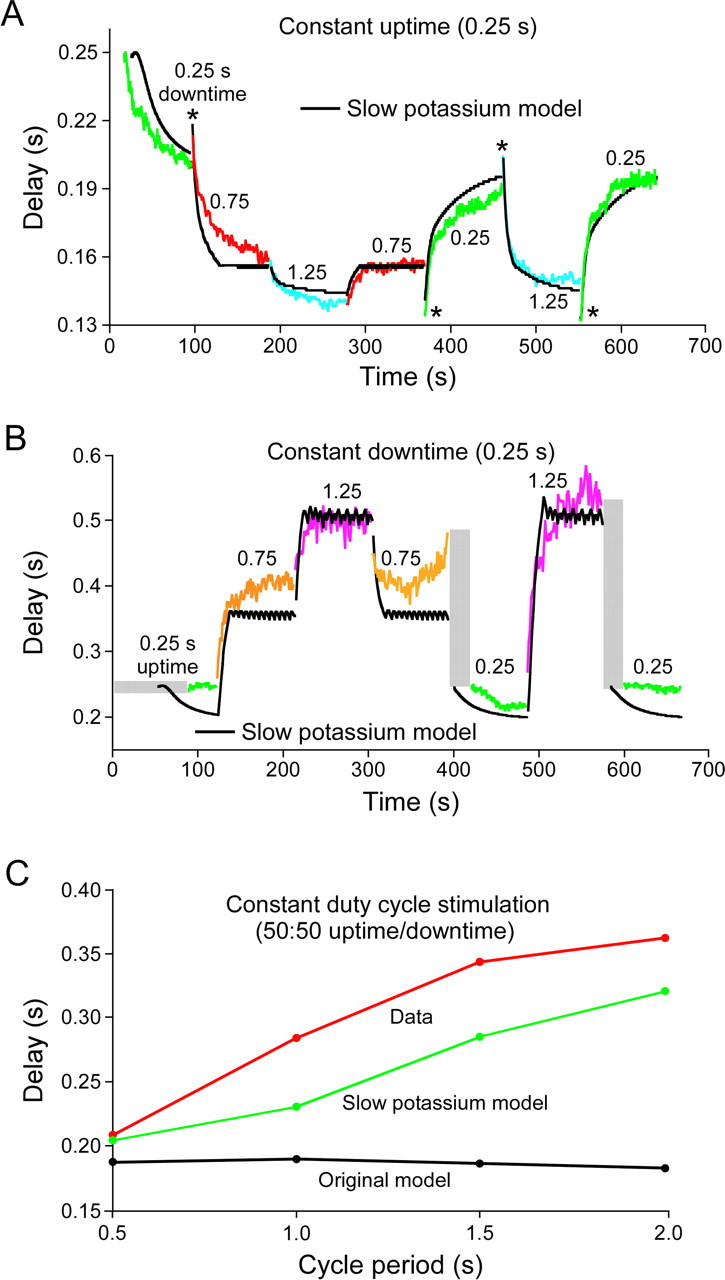
A, B, Response of the same PY neuron as in Figure 6, and of a pyloric neuron model with a slowly activating and deactivating potassium current, to the same series of stimulation patterns as in Figure 6. All figure labeling conventions are the same as in Figure 6. The slow potassium model much better reproduced neuron activity. C, Summary of model and neuron steady-state rebound delays for stimulation patterns in A and B with a 50:50 duty cycle. The original model (black) showed no change in rebound delay, but in both the real neuron (red) and the slow potassium model (green), steady-state rebound delay increased with cycle period.
Models containing other slow currents, including, in particular, a slowly activating and deactivating calcium current, could also qualitatively reproduce the neuron data (data not shown). We interpreted these results as indicating that the fundamental requirement was not which ion the conductance transmitted, but instead the conductance's activation and deactivation dynamics. This interpretation was further supported by work in individual models examining the effect on model performance of changing slow-conductance activation and deactivation dynamics. This dependence on conductance dynamics suggested that the slow conductances were acting as low-pass filters of neuron activity, their mean activation levels were hence shifting as neuron activity shifted, and this shift in mean activation level was altering rebound delay. The manner in which low-pass filtering could result in such shifts in mean activation level is exactly analogous to work we have performed explaining how slow muscles in the pyloric system respond to their comparatively rapid motor neuron burst input (Morris and Hooper, 1997, 2001; Hooper and Weaver, 2000; Morris et al., 2000; Thuma et al., 2003), and similar work one of the authors has performed in the Büschges lab at the University of Cologne on slow muscles in the walking system of the stick insect Carausius morosus (Hooper et al., 2006, 2007a,b) [mathematical treatments of this issue are included in Morris and Hooper (1997, 2001) and Hooper et al. (2007b)].
In brief, consider a slow conductance that activates with depolarization and deactivates with hyperpolarization. If the neuron is rhythmically hyperpolarized, during each downtime the conductance's activation level would decrease and during each uptime it would increase. If the decreases in the conductance's activation during the initial downtimes are of larger amplitude than the increases during the intervening uptimes, the conductance's activation level would temporally summate (staircase) downward (become less activated). In general the rates at which a conductance's activation change depend not only on membrane potential, but also on the absolute value of the conductance's activation. Thus, as the staircasing occurred the amount of activation during each uptime, and of deactivation during each downtime, would change as the conductance's mean activation level shifted. This process would continue until the conductance's mean activation reached a level at which the conductance activated the same amount during each uptime as it deactivated during each downtime, at which point the conductance's mean activation, averaged across a cycle period, would stop changing. If the durations of the uptimes or downtimes were then shifted, the amplitudes of activation and deactivation during the new uptimes and downtimes would then again be unequal, and hence a new staircasing would occur until a new mean activation level was achieved at which uptime activation equaled downtime deactivation. Importantly, for this process to work, the rate of change of the conductance activation must be so slow that the activation never reaches its steady-state value (the value it would achieve if the neuron were held at either the rest or hyperpolarized voltages for a long time) during either the up or down times. Mean activation levels of conductances whose activation rates are slow compared with the durations present in a neuron's activity changes can thus change in response to changes in those durations, and hence alter neuron activity.
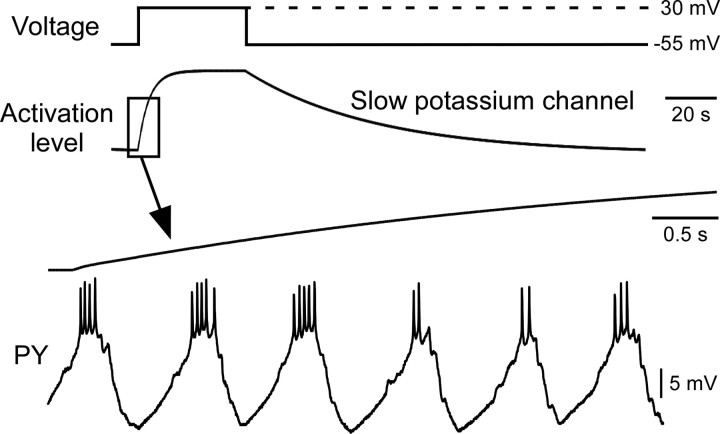
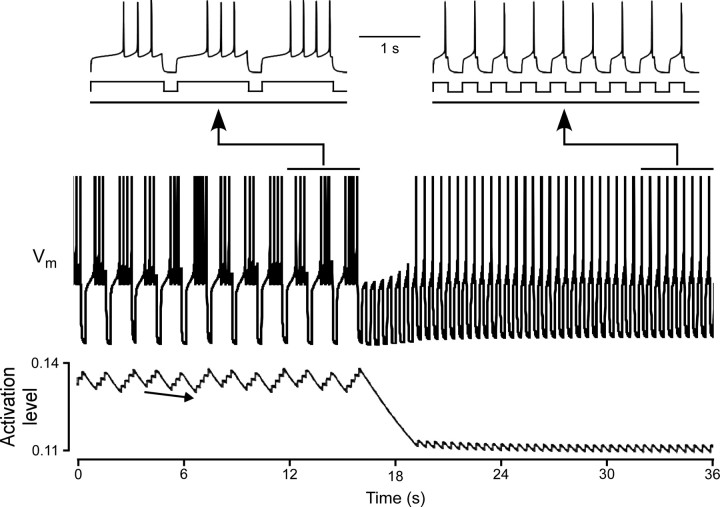
To test whether the process outlined above was the basis for the success of our slow-conductance models in reproducing PY neuron responses to changing stimulation patterns, we therefore examined slow current activation and deactivation (in the slow potassium model) in greater detail. Figure 8 shows the slow potassium conductance's response to a step depolarization (top two traces). The conductance slowly activated during the step and very slowly deactivated after it. Comparing the time course of the conductance's activation with PY neuron activity in the intact network (bottom two traces, note change in time calibration bar) emphasizes how slowly the conductance activated and deactivated compared with pyloric cycle period. Figure 9 shows the activity of the model before, during, and after a change in stimulation protocol [this transition corresponds to the last (from {1.25 s uptime, 0.25 s downtime} to {0.25 s uptime, 0.25 s downtime}) transition in Figs. 6B and 7B]. The top two traces on the left and the right show on an expanded time scale model activity at steady state (first trace) and current injection pattern (second trace) in the two stimulation protocols. The third trace and the plot (bottom) show on a slow time scale model activity and conductance activation in the two stimulation protocols and during the transition. In the first stimulation pattern the conductance's steady-state activation had a mean of ∼0.13 and showed small spike-by-spike alterations that temporally summated during each burst, and declined from the start of each hyperpolarization until the beginning of the next burst.
Figure 8.
The slow potassium current dynamics were much slower than PY neuron cycle period, and thus would be expected to act as a slow temporal filter of PY neuron activity. First trace, Step voltage change. Second trace, Resulting change in slow potassium current activation. Third and fourth traces, Change in slow potassium conductance activation level at the beginning of the voltage step change and PY neuron bursting activity in the intact network, both at an expanded time scale. “Activation level” refers to the value of parameter “a” in the equation for IK (see Appendix).
Figure 9.
Changes of mean slow potassium current activation explain changes in slow potassium model activity when stimulation pattern changes. Top two traces, Model activity and stimulation pattern at steady state before (left) and after (right) stimulation pattern change on an expanded time scale. Third trace, Model activity at a slow time scale (plot x-axis). Plot, Slow potassium conductance activation level on same time scale as third trace. Stimulation pattern change occurred (approximate time 16.5 s) when neuron stopped firing (third trace) and activation level began large decline (plot). When the stimulation pattern had a long uptime and short downtime, the activation of the slow potassium current was high, and model rebound delay was therefore long (left). For explanation of long-term variation in burst spike number (arrow), see Results. When uptime was decreased, the slow potassium current's activation level decreased to a lower steady-state level at which model rebound delay was shorter (right). Immediately after the pattern change the model could not fire because rebound delay was longer than uptime. “Activation level” refers to the value of parameter “a” in the equation for IK (see Appendix), which can vary from 0 (no activation) to 1 (full activation).
In the first stimulation pattern model rebound delay varied between 0.47 and 0.54 s. This variation was due to model firing having a long-term pattern in which every third burst had four, rather than three, spikes. This long-term pattern occurred because with only three spikes the activation level slowly declined burst-to-burst (arrow in bottom plot). As a result of this slowly declining activation level, spike delay decreased burst-to-burst until it became short enough that four spikes could fit in one uptime. This fourth spike resulted in a resetting of the current's activation to a new higher level, with a consequently longer rebound delay, a delay long enough that only three spikes could occur in the following uptime. At this point the activation level again began to decrease burst-by-burst until rebound delay was short enough for four spikes to occur in the uptime, at which point the process recurred. Put another way, the steady-state firing pattern would have been 3⅓ spikes per burst, but because partial spikes cannot occur, the system instead showed a slow variation between 3 and 4 spikes that resulted in this value being achieved on average.
This observation raises the question of whether similar long-term resetting patterns occur in real PY neurons. In both intact and isolated PY neurons cycle-by-cycle variations in spike number do occur. For instance, in Figure 1B the first PY burst had 6 spikes and the second had 5, in Figure 2B the first PY burst had 7 spikes and the second had 6, and in Figure 2C the first two bursts had 3 and the third had 2. Similarly, in the isolated neuron shown in Figure 4, in the top trace of Figure 4A1 the first burst had 6 spikes and the other three had 5, and in the top trace of Figure 4B1, the first five bursts had 5 spikes and the sixth had 4. We hesitate, however, to ascribe these variations to the same mechanism as that explaining the variation in spike number seen in Figure 9 because in both the intact network (Fig. 1) and isolated neuron (Fig. 4) cases, modulatory inputs and inputs from other, nonpyloric, stomatogastric networks are still present, either of which could be responsible for these changes in spike number. Moreover, our stimulation trains were not long enough in most cases to establish whether long-term repeat patterns were occurring in the neurons, and given the likelihood of slow changes in neuron properties occurring over time under in vitro conditions, it is unclear that increasing train length could unambiguously resolve this issue. As such, although the mechanisms underlying the long-term pattern seen in Figure 9 could be a possible mechanism for long-term repeating variation in real pyloric neuron spike numbers, the presence of other possible explanations in the real system prevent this idea at present from being more than an interesting speculation.
Turning now to the larger question of the response of the model to changes in stimulation pattern, for six cycles after the stimulation pattern was changed (at ∼16.5 s) conductance activation was too large to allow any spiking to occur during the new, shorter uptime (i.e., model rebound delay was greater than uptime duration). The model's mean membrane potential was therefore more negative than it was in the original stimulation pattern, and conductance activation therefore continuously declined, eventually reaching a level near 0.11. This lower activation level resulted in less potassium (hyperpolarizing) current being present during the uptimes, and thus a shorter (0.2 s) rebound delay, one short enough that the model could again fire (note decreased rebound delay in first right trace).
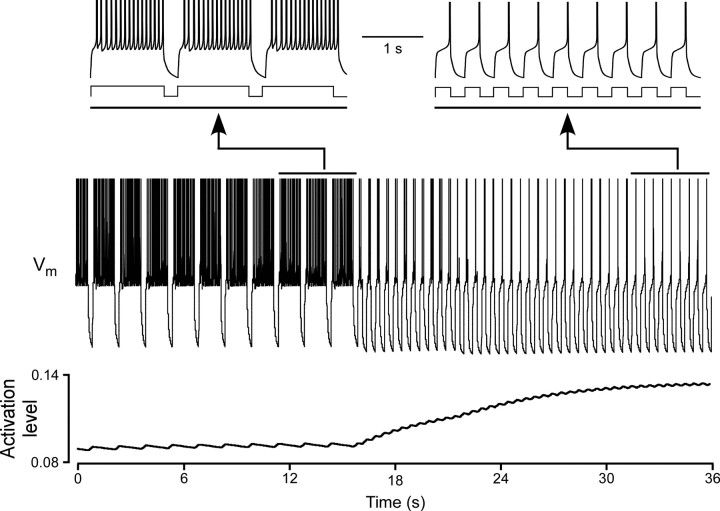
The shifts in model rebound delay thus occur because stimulation changes that make model mean membrane potential more negative decrease potassium conductance activation and hence decrease rebound delay, and changes that make model mean membrane potential more positive increase conductance mean activation and hence increase rebound delay. This logic suggested that if the dependence of conductance activation on membrane potential were reversed (so it increased with hyperpolarization and decreased with depolarization), the effects on rebound delay should reverse. We therefore altered the slow potassium current (Appendix) so its activation changed in this manner. It was also necessary in the reversed model to delete Ih (because its effect on model rebound delay opposed the effects of the reversed slow potassium current, instead of assisting these effects as in the original model), alter the dynamics of calcium sequestration (because, since calcium channels open with depolarization and [Ca2+] thus increases with depolarization, the reversed slow potassium conductance activation had to be switched to depending on 1/[Ca2+] instead of [Ca2+] as in the original slow potassium conductance), and make minor changes in IKd and INa to maintain neuron firing. Under these conditions (Fig. 10, all figure conventions exactly as in Fig. 9) the same change in stimulation pattern increased (instead of decreased) slow potassium conductance activation, and hence increased (instead of decreased) rebound delay.
Figure 10.
When the dependence of the slow potassium conductance's activation on voltage was switched so that it increased (instead of decreased) with the same change as that done in Figure 9, the model responded with a decreased (instead of increased) rebound delay (compare left and right first traces in this figure to those in Fig. 9). All figure conventions are the same as in Figure 9.
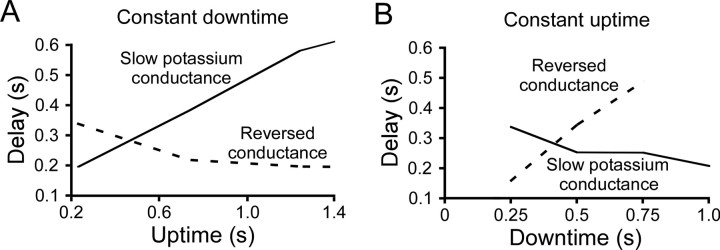
Figure 11 compares the rebound delays of the two models to multiple stimulation patterns. Figure 11A shows the response of the models to stimulation protocols with a constant downtime and varying uptime. The original model responded with an increasing delay, but in the reversed conductance model delay first decreased and then became nearly constant for uptimes >0.8 (because for these uptimes with this downtime conductance activation became very close to zero). Figure 11B shows model responses to stimulation protocols with a constant uptime and varying downtime. The original model responded with a decreasing delay, but in the reversed conductance model delay continuously increased.
Figure 11.
Summary data comparing responses of the original slow potassium model and the reversed potassium model to changing uptime with a constant downtime (A) and changing downtime with a constant uptime (B). In each case, the responses of the two models to the changes in stimulation pattern were opposite. The rebound delay of the reversed potassium model stopped changing for uptimes >0.8 in A because its activation level was close to zero for all these patterns. To facilitate comparison, scale axes are identical to those in Figure 4, A2 and B2.
Discussion
The goals of this research were to measure isolated PY neuron rebound delays in response to a wide range of rhythmic stimulation protocols and to develop models that reproduced these data. The neuron data showed that neuron responses to stimulation pattern changes occurred over several to many cycle periods. Modeling work with models lacking slow conductances did not reproduce either these several-cycle dynamics or the biphasic responses observed for certain stimulation protocol changes. Models with slowly activating and deactivating conductances, alternatively, qualitatively reproduced both aspects of real neuron data. These models worked because slow temporal filtering of model activity changed mean conductance activation and consequently shifted model rebound delay. These data suggested that reversing the voltage dependence of slow-conductance activation and deactivation should reverse the sign of model response to changes in stimulation protocol, a suggestion confirmed by making these changes in one of the slow-conductance models. These data suggest that slow conductances or similar slow processes may play a role in phase maintenance in the pyloric network and other systems that maintain phase as cycle period is altered.
Experimental and modeling concerns
All experimental techniques used here are standard for the stomatogastric system and the results obtained are consistent with previous work measuring isolated PY neuron responses to stimulation with rhythmic pulse trains (see below). The modeling is similarly standard in every respect.
Comparison with previous work on the functional roles of slow conductances and neurons with slow responses
Consideration of the response properties of isolated PY neurons to temporally varying stimulation patterns acted as a springboard for two theoretical papers of ours suggesting that neurons containing slow conductances could measure temporal durations and identify beat patterns such as those occurring in speech, Morse code, and music (Hooper, 1998; Hooper et al., 2002). However, neither of these works compared slow-conductance-containing models to real PY neurons, considered the role that such conductances might play in phase maintenance, or examined in detail the time course of PY or model responses to changes in stimulation pattern changes, a key feature of the present work [indeed, an important component of the argument made in one of these works (Hooper, 1998) was that, with the stimulation pattern changes used in it, these changes occurred relatively rapidly]. As such, although this earlier work suggesting that neurons containing slow conductances could play a role in analyzing long-time-scale characteristics of sensory inputs is consistent with the data presented here, it distinctly differs from the present work both experimentally and conceptually.
Comparison with previous phase maintenance work
The data in Figure 4 (left) may initially seem contradictory to those in Figure 2 and in the study by Hooper (1998). In Figure 4 (left), rebound delay decreased when downtime was increased with a constant uptime, which increased cycle period, but in Figure 2 and the study by Hooper (1998) rebound delay increased with increasing cycle period. However, in Figure 2 and the study by Hooper (1998) the duty cycle (inhibition duration/cycle period) of the inhibition was approximately constant as cycle period increased, whereas the duty cycle of the inhibition in Figure 4 (left), increased with increased cycle period. When the data in Figure 4 were sorted into classes with similar duty cycles and replotted against cycle period, rebound delay again increased with cycle period in each duty cycle class (data not shown for all duty cycles, but see Fig. 7C). As such, these data show that PY neurons, and the models built here of them, maintain phase when driven (as are the neurons in the intact network) by inputs that themselves maintain phase.
Biological relevance of extremely slow currents such as those used here
The original slow potassium conductance used here is a depolarization- and calcium-activated conductance with very slow dynamics (Fig. 8). The reversed potassium conductance is a depolarization- and calcium-inactivated conductance, again with very slow dynamics (data not shown, but see Appendix). These conductances are ad hoc modifications of existing more rapidly activating and deactivating voltage- and calcium-dependent potassium currents [inspired by Yamada et al. (1989), Buchholtz et al. (1992), and Golowasch et al. (1992)], and to our knowledge no real current has the precise dynamics and voltage dependencies of these equations. An objection could thus be raised that these conductances are not biologically relevant. However, such objections would miss the point of this work, which was to test whether slow processes could underlie observed pyloric neuron responses. The ability not only of the potassium model data presented here, but also of a model containing a slow calcium conductance, to reproduce qualitatively the real neuron data constitutes strong support that slow processes indeed could be the basis for the pyloric neuron responses.
The relevant question thus becomes not whether these precise conductances are present in real neurons, but whether slow conductances are. A review of the literature shows multiple slow (time constants in the multiple second to minute range or current traces that take similar times to reach steady state when activated or to recover following inactivation) potassium (Adams et al., 1980; Dubois, 1981; Czternasty et al., 1989; Kumamoto and Shinnick-Gallagher, 1990; Zittlau and Walther, 1991; Sah and McLachlan, 1992; Marom and Abbott, 1994; Pedarzani and Storm, 1995; Kilic et al., 1996; Ma and Koester, 1996; Sah, 1996; Marom, 1998) (including a hyperpolarization-activated conductance qualitatively similar to our reversed potassium current) (Zittlau and Walther, 1991), sodium (Kumamoto and Shinnick-Gallagher, 1990; Fleidervish and Gutnick, 1996; Fleidervish et al., 1996; Marom, 1998; Toib et al., 1998; Butera et al., 1999), and calcium (Adams et al., 1980; Kuo and Yang, 2001) conductances in both vertebrates and invertebrates. As such, although the precise slow conductances used here may not be present in real neurons, conductances with similar activation dynamics undoubtedly are.
Greater relevance
This work is part of a larger body of research examining the functional roles that slow processes play in nervous system activity. This research has suggested that slow intrinsic properties could play a role in learning and memory (Marom and Abbott, 1994; Marder, 1997; Marder et al., 1996; Turrigiano et al., 1996), specification of neuron properties (LeMasson et al., 1993; Siegel et al., 1994; Turrigiano et al., 1994), identification of frequency and duty cycle in rhythmic sensory input such as music beat lines (Hooper, 1998), and duration measurement (Hooper et al., 2002). The data presented here suggest that slow processes may also play a role in maintaining phase relationships in rhythmic motor patterns. As such, these data provide additional support for the hypotheses that (1) the ability of nervous systems to generate and process information resides not only in the complexities of neuron synaptic interconnectivity, but also in the complex intrinsic properties of individual neurons, and (2) similar to how we could switch phase maintenance by switching conductance activation and deactivation voltage dependence, the great variation observed in slow-conductance properties (see slow-conductance references above) may exist in part to “tune” neurons to perform different tasks.
Appendix
Many of the equations in the slow-conductance model were identical to those used by Buchholtz et al. (1992). We note below the cases in which the equations were altered or new conductances added. In all equations, V is in mV, I in nA, rate constants in s−1, and [Ca2+] in μm.
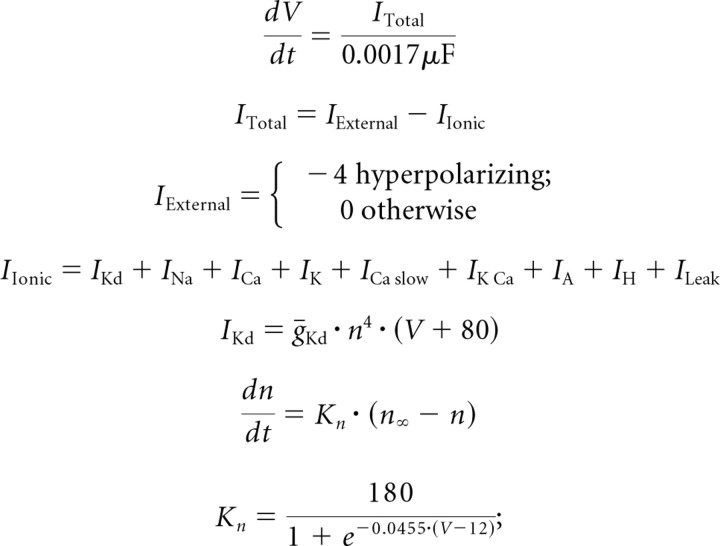 |
in the study by Buchholtz et al. (1992),
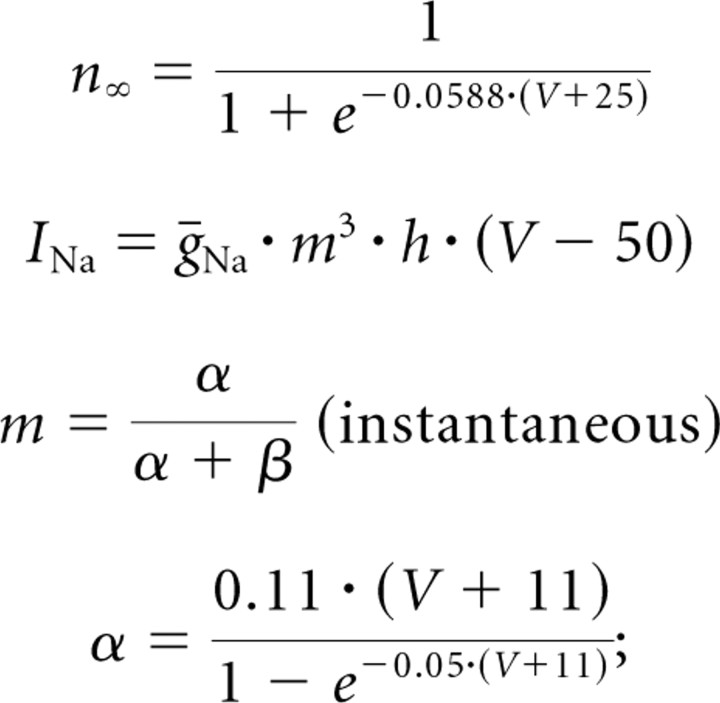 |
in the study by Buchholtz et al. (1992),
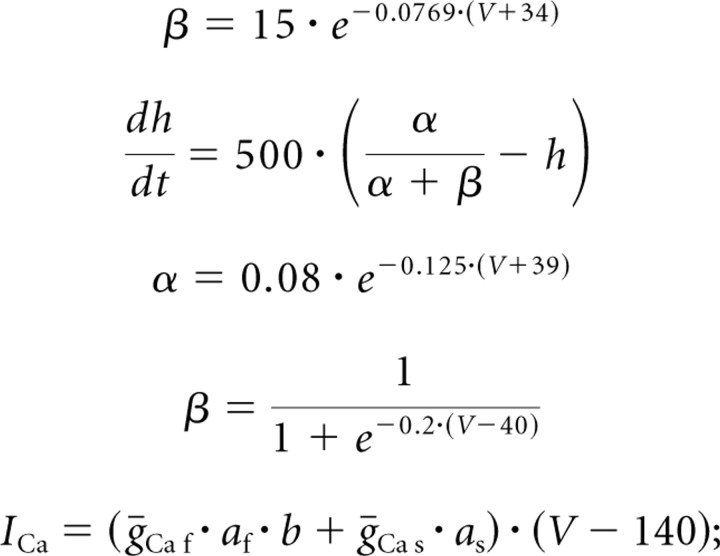 |
in the study by Buchholtz et al. (1992), ECa was instead calculated from [Ca2+]i.
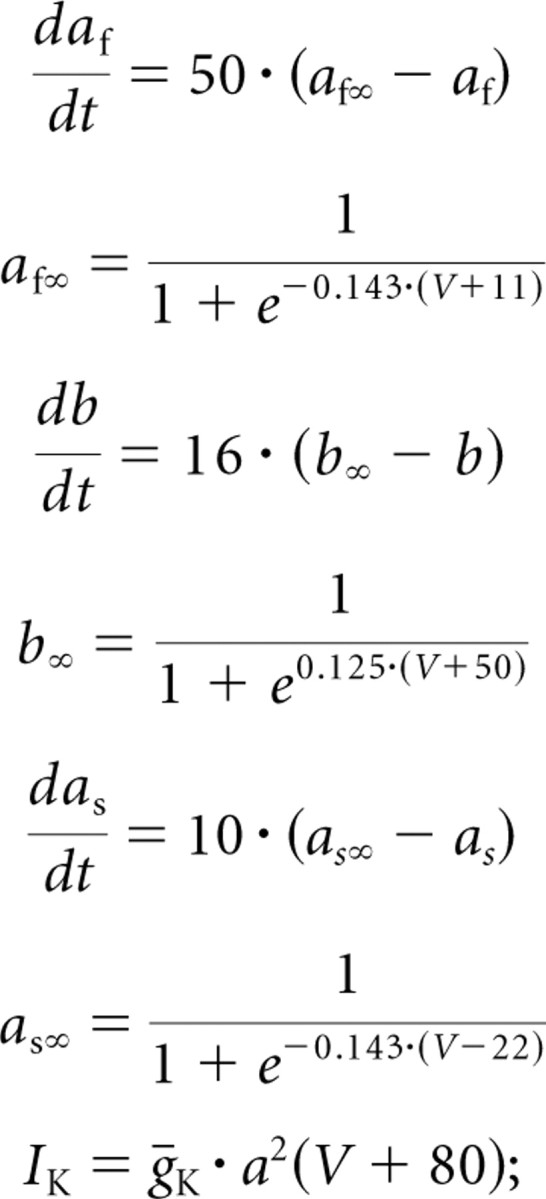 |
this slow conductance was not present in the study by Buchholtz et al. (1992).
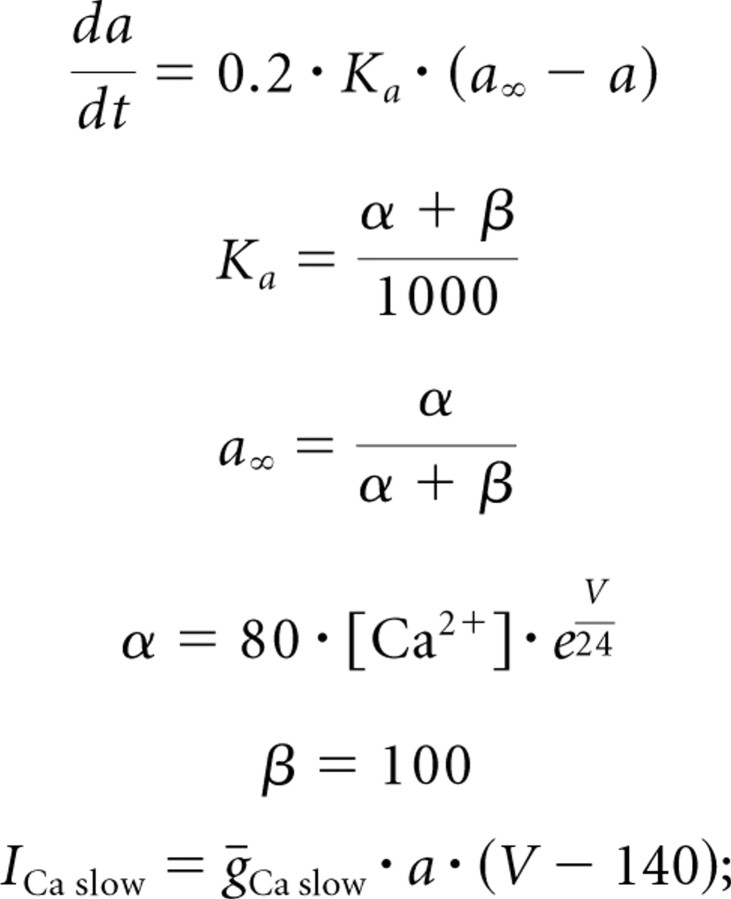 |
this slow conductance was not present in the study by Buchholtz et al. (1992).
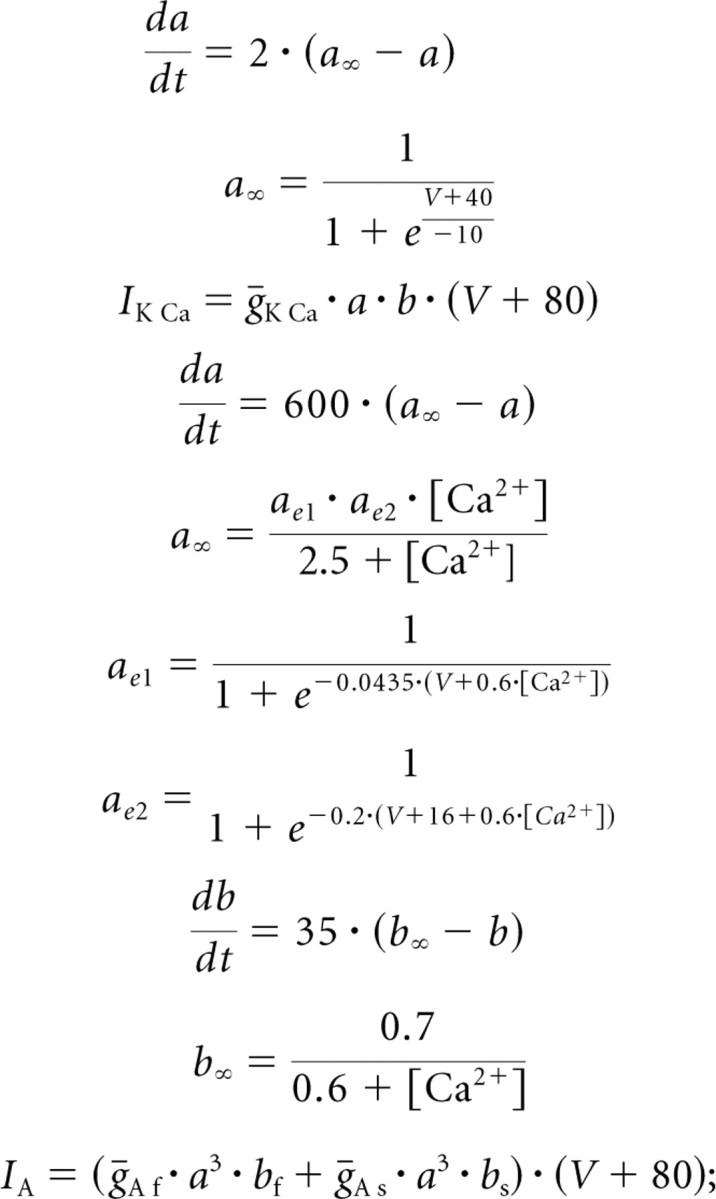 |
in the study by Buchholtz et al. (1992), the ratio of the inactivation variables depends on voltage, whereas in our work this ratio was a constant. All the equations below, except that for b∞, therefore differ substantially from those in the study by Buchholtz et al. (1992).
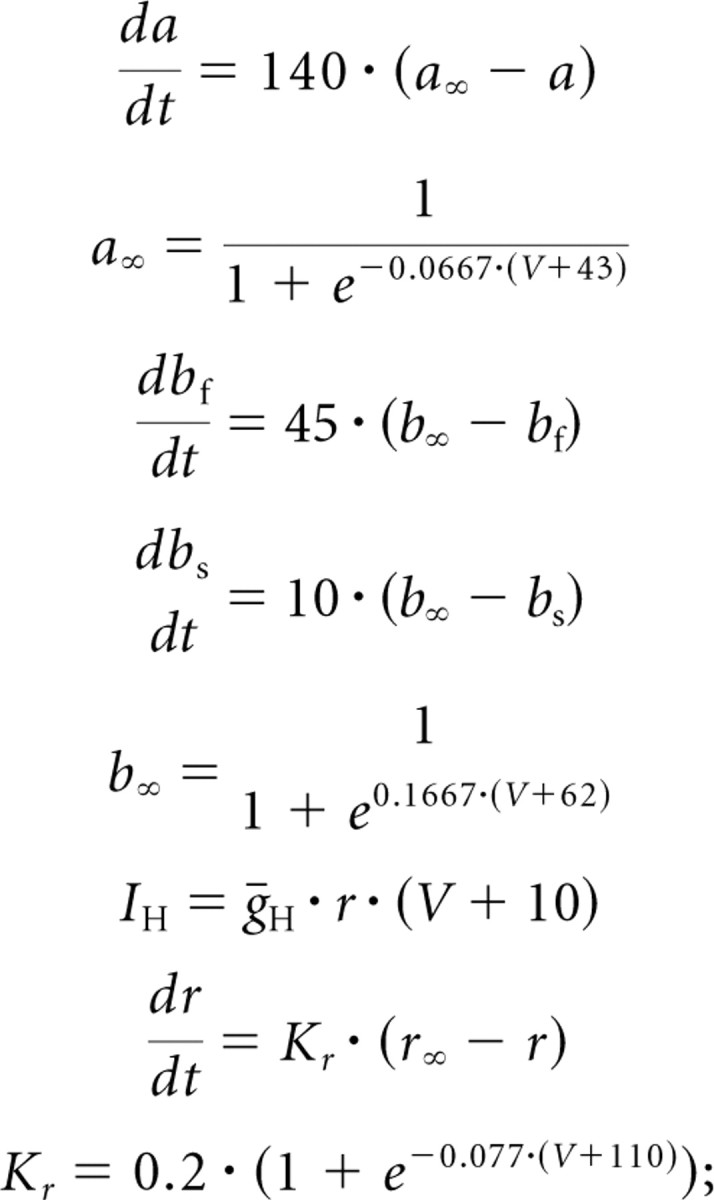 |
in the study by Buchholtz et al. (1992),
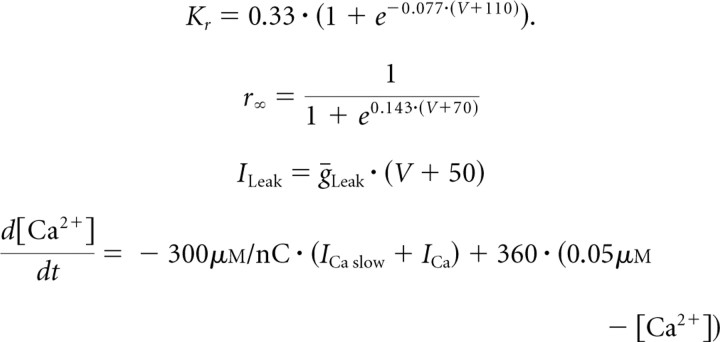 |
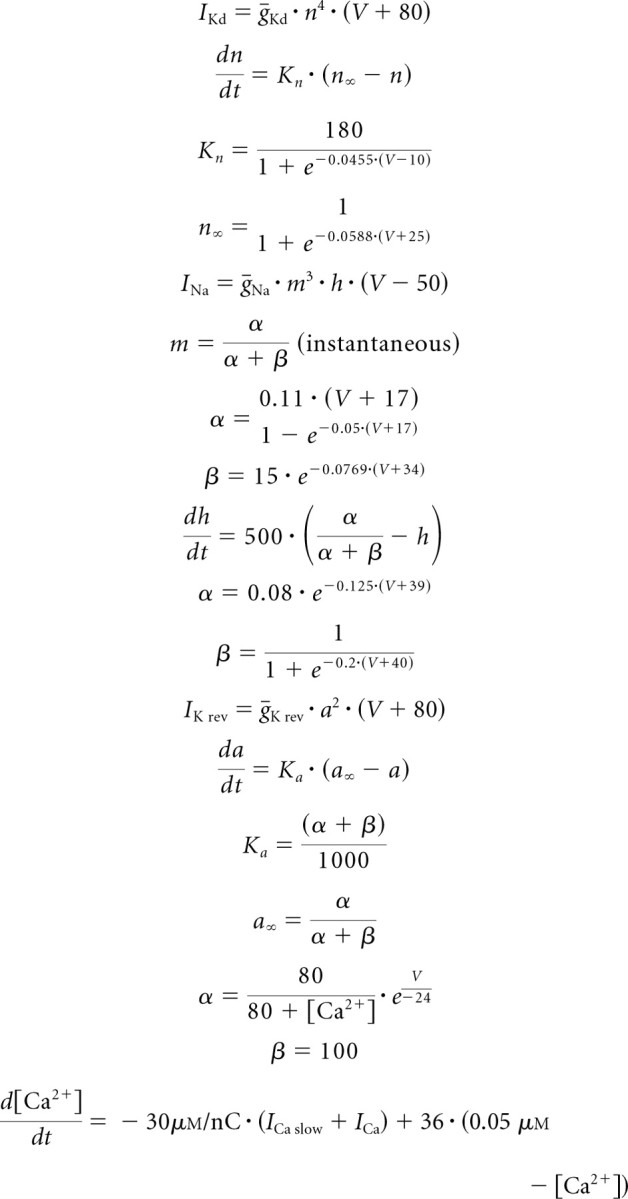
The maximum conductance values (μS) for these conductances were ḡLeak = 0.1, ḡKd = 0.59, ḡNa = 2300, ḡCa f = 0.21, ḡCa s = 0.047, ḡK = 1.2, ḡCa slow = 0.008, ḡK Ca = 3.2, ḡA f = 1, ḡA s = 0.6, and ḡH = 0.037, in which the values for ḡNa, ḡCa f, ḡCa s, ḡK Ca, and ḡH were identical to those in the study by Buchholtz et al. (1992). Maximum conductance values of the reversed (Fig. 10) and normal slow potassium models were identical to those above except for ḡK rev = 0.6, ḡA f = 0.7, ḡA s = 0.7, and ḡH = 0. The equations of the normal and reversed slow potassium models were identical except for the following:
 |
Footnotes
This work was supported by an Ohio University doctoral fellowship to A.L.W., an Ohio University Neuroscience Program postdoctoral fellowship to E.B., and National Science Foundation Grant 0090250 and National Institute of Mental Health Grant MH-57832 to S.L.H. We thank R. A. DiCaprio and W. White for comments on this manuscript.
References
- Abbott LF, Marder E, Hooper SL. Oscillating networks: control of burst duration by electrically coupled neurons. Neural Comput. 1991;3:487–497. doi: 10.1162/neco.1991.3.4.487. [DOI] [PubMed] [Google Scholar]
- Adams DJ, Smith SJ, Thompson SH. Ionic currents in molluscan soma. Annu Rev Neurosci. 1980;3:141–167. doi: 10.1146/annurev.ne.03.030180.001041. [DOI] [PubMed] [Google Scholar]
- Bidaut M. Pharmacological dissection of pyloric network of the lobster stomatogastric ganglion using picrotoxin. J Neurophysiol. 1980;44:1089–1101. doi: 10.1152/jn.1980.44.6.1089. [DOI] [PubMed] [Google Scholar]
- Buchholtz F, Golowasch J, Epstein IR, Marder E. Mathematical model of an identified stomatogastric ganglion neuron. J Neurophysiol. 1992;67:332–340. doi: 10.1152/jn.1992.67.2.332. [DOI] [PubMed] [Google Scholar]
- Buchman E, Thuma JB, Weaver AL, Hooper SL. Model conductances that reproduce the PY neuron delay shifts observed in response to changes in stimulus paradigm. Soc Neurosci Abstr. 2000;26:748–9. [Google Scholar]
- Butera RJ, Jr, Rinzel J, Smith JC. Models of respiratory rhythm generation in the pre-Bötzinger complex. I. Bursting pacemaker neurons. J Neurophysiol. 1999;82:382–397. doi: 10.1152/jn.1999.82.1.382. [DOI] [PubMed] [Google Scholar]
- Czternasty G, Kado RT, Bruner J. Analysis of mechanisms of spiking in normally ‘non-spiking’ motoneurone somata in crayfish. J Exp Biol. 1989;147:91–110. [Google Scholar]
- DiCaprio RA, Jordan G, Hampton T. Maintenance of motor pattern phase relationships in the ventilatory system of the crab. J Exp Biol. 1997;200:963–974. doi: 10.1242/jeb.200.6.963. [DOI] [PubMed] [Google Scholar]
- Dubois JM. Evidence for the existence of three types of potassium channels in the frog Ranvier node membrane. J Physiol. 1981;318:297–316. doi: 10.1113/jphysiol.1981.sp013865. [DOI] [PMC free article] [PubMed] [Google Scholar]
- Fleidervish IA, Gutnick MJ. Kinetics of slow inactivation of persistent sodium current in layer V neurons of mouse neocortical slices. J Neurophysiol. 1996;76:2125–2130. doi: 10.1152/jn.1996.76.3.2125. [DOI] [PubMed] [Google Scholar]
- Fleidervish IA, Friedman A, Gutnick MJ. Slow inactivation of Na+ current and slow cumulative spike adaptation in mouse and guinea-pig neocortical neurones in slices. J Neurophysiol. 1996;493:83–97. doi: 10.1113/jphysiol.1996.sp021366. [DOI] [PMC free article] [PubMed] [Google Scholar]
- Golowasch J, Buchholtz F, Epstein IR, Marder E. Contribution of individual ionic currents to activity of a model stomatogastric ganglion neuron. J Neurophysiol. 1992;67:341–349. doi: 10.1152/jn.1992.67.2.341. [DOI] [PubMed] [Google Scholar]
- Grillner S, Wallén P. Central pattern generators for locomotion, with special reference to vertebrates. Annu Rev Neurosci. 1985;8:233–261. doi: 10.1146/annurev.ne.08.030185.001313. [DOI] [PubMed] [Google Scholar]
- Grillner S, Wallén P, Dale N, Brodin L, Buchanan J, Hill R. Transmitters, membrane properties, and network circuitry in the control of locomotion in lamprey. Trends Neurosci. 1987;10:34–41. [Google Scholar]
- Harris-Warrick RM, Marder E. Modulation of neural networks for behavior. Annu Rev Neurosci. 1991;14:39–57. doi: 10.1146/annurev.ne.14.030191.000351. [DOI] [PubMed] [Google Scholar]
- Harris-Warrick RM, Marder E, Selverston AI, Moulins M. Dynamic biological networks: the stomatogastric nervous system. Cambridge, MA: MIT; 1992. [Google Scholar]
- Hartline DK. Pattern generation in the lobster (Panulirus) stomatogastric ganglion. II. Pyloric network simulation. Biol Cybern. 1979;33:223–236. doi: 10.1007/BF00337411. [DOI] [PubMed] [Google Scholar]
- Hooper SL. Phase maintenance in the pyloric pattern of the lobster (Panulirus interruptus) stomatogastric ganglion. J Comput Neurosci. 1997a;4:191–205. doi: 10.1023/a:1008822218061. [DOI] [PubMed] [Google Scholar]
- Hooper SL. The pyloric pattern of the lobster (Panulirus interruptus) stomatogastric ganglion comprises two phase-maintaining subsets. J Comput Neurosci. 1997b;4:207–219. doi: 10.1023/a:1008867702131. [DOI] [PubMed] [Google Scholar]
- Hooper SL. Transduction of temporal patterns by single neurons. Nat Neurosci. 1998;1:720–726. doi: 10.1038/3721. [DOI] [PubMed] [Google Scholar]
- Hooper SL, DiCaprio RA. Crustacean motor pattern generator networks. Neurosignals. 2004;13:50–69. doi: 10.1159/000076158. [DOI] [PubMed] [Google Scholar]
- Hooper SL, Weaver AL. Motor neuron activity is often insufficient to predict motor response. Curr Opin Neurobiol. 2000;10:676–682. doi: 10.1016/s0959-4388(00)00158-6. [DOI] [PubMed] [Google Scholar]
- Hooper SL, Buchman E, Hobbs KH. A computational role for slow conductances: single-neuron models that measure duration. Nat Neurosci. 2002;5:552–556. doi: 10.1038/nn0602-838. [DOI] [PubMed] [Google Scholar]
- Hooper SL, Guschlbauer C, von Uckermann G, Büschges A. Natural neural output that produces highly variable locomotory movements. J Neurophysiol. 2006;96:2072–2088. doi: 10.1152/jn.00366.2006. [DOI] [PubMed] [Google Scholar]
- Hooper SL, Guschlbauer C, von Uckermann G, Büschges A. Different motor neuron spike patterns produce contractions with very similar rises in graded slow muscles. J Neurophysiol. 2007a;97:1428–1444. doi: 10.1152/jn.01014.2006. [DOI] [PubMed] [Google Scholar]
- Hooper SL, Guschlbauer C, von Uckermann G, Büschges A. Slow temporal filtering may largely explain the transformation of stick insect (Carausius morosus) extensor motor neuron activity into muscle movement. J Neurophysiol. 2007b;98:1718–1732. doi: 10.1152/jn.01283.2006. [DOI] [PubMed] [Google Scholar]
- Katz PS, Hooper SL. Invertebrate central pattern generators. In: North G, Greenspan R, editors. Invertebrate neurobiology. Cold Spring Harbor, NY: Cold Spring Harbor Laboratory; 2007. pp. 251–279. [Google Scholar]
- Kilic G, Stolpe A, Lindau M. A slowly activating voltage-dependent K+ current in rat pituitary nerve terminals. J Physiol. 1996;497:711–725. doi: 10.1113/jphysiol.1996.sp021802. [DOI] [PMC free article] [PubMed] [Google Scholar]
- Kumamoto E, Shinnick-Gallagher P. Slow inward and late slow outward currents induced by hyperpolarizing pre-pulses in cat bladder parasympathetic neurones. Pflugers Arch. 1990;416:322–334. doi: 10.1007/BF00392069. [DOI] [PubMed] [Google Scholar]
- Kuo CC, Yang S. Recovery from inactivation of T-type Ca2+ channels in rat thalamic neurons. J Neurosci. 2001;21:1884–1892. doi: 10.1523/JNEUROSCI.21-06-01884.2001. [DOI] [PMC free article] [PubMed] [Google Scholar]
- LeMasson G, Marder E, Abbott LF. Activity-dependent regulation of conductances in model neurons. Science. 1993;259:1915–1917. doi: 10.1126/science.8456317. [DOI] [PubMed] [Google Scholar]
- Ma M, Koester J. The role of K+ currents in frequency-dependent spike broadening in Aplysia R20 neurons: a dynamic-clamp analysis. J Neurosci. 1996;16:4089–4101. doi: 10.1523/JNEUROSCI.16-13-04089.1996. [DOI] [PMC free article] [PubMed] [Google Scholar]
- Marder E. Computational dynamics in rhythmic neural circuits. Neuroscientist. 1997;3:295–302. [Google Scholar]
- Marder E, Bucher D. Understanding circuit dynamics using the stomatogastric nervous system of lobsters and crabs. Annu Rev Physiol. 2007;69:291–316. doi: 10.1146/annurev.physiol.69.031905.161516. [DOI] [PubMed] [Google Scholar]
- Marder E, Abbott LF, Buchholtz F, Epstein IR, Golowasch J, Hooper SL, Kepler TB. Physiological insights from cellular and network models of the stomatogastric nervous systems of lobsters and crabs. Am Zool. 1993;33:29–39. [Google Scholar]
- Marder E, Abbott LF, Turrigiano GG, Liu Z, Golowasch J. Memory from the dynamics of intrinsic membrane currents. Proc Natl Acad Sci U S A. 1996;93:13481–13486. doi: 10.1073/pnas.93.24.13481. [DOI] [PMC free article] [PubMed] [Google Scholar]
- Marom S. Slow changes in the availability of voltage-gated channels: effects on the dynamics of excitable membranes. J Membr Biol. 1998;161:105–113. doi: 10.1007/s002329900318. [DOI] [PubMed] [Google Scholar]
- Marom S, Abbott LF. Modeling state-dependent inactivation of membrane currents. Biophys J. 1994;67:515–520. doi: 10.1016/S0006-3495(94)80518-1. [DOI] [PMC free article] [PubMed] [Google Scholar]
- Miller JP, Selverston A. Rapid killing of single neurons by irradiation of intracellularly injected dye. Science. 1979;206:702–704. doi: 10.1126/science.386514. [DOI] [PubMed] [Google Scholar]
- Morris LG, Hooper SL. Muscle response to changing neuronal input in the lobster (Panulirus interruptus) stomatogastric system: spike number- versus spike frequency-dependent domains. J Neurosci. 1997;17:5956–5971. doi: 10.1523/JNEUROSCI.17-15-05956.1997. [DOI] [PMC free article] [PubMed] [Google Scholar]
- Morris LG, Hooper SL. Mechanisms underlying stabilization of temporally summated muscle contractions in the lobster (Panulirus) pyloric system. J Neurophysiol. 2001;85:254–268. doi: 10.1152/jn.2001.85.1.254. [DOI] [PubMed] [Google Scholar]
- Morris LG, Thuma JB, Hooper SL. Muscles express motor patterns of non-innervating neural networks by filtering broad-band input. Nat Neurosci. 2000;3:245–250. doi: 10.1038/72955. [DOI] [PubMed] [Google Scholar]
- Nusbaum MP, Beenhakker MP. A small-systems approach to motor pattern generation. Nature. 2002;417:343–350. doi: 10.1038/417343a. [DOI] [PMC free article] [PubMed] [Google Scholar]
- Pearce RA, Friesen WO. Intersegmental coordination of the leech swimming rhythm. II. Comparison of long and short chains of ganglia. J Neurophysiol. 1985;54:1460–1472. doi: 10.1152/jn.1985.54.6.1460. [DOI] [PubMed] [Google Scholar]
- Pedarzani P, Storm JF. Dopamine modulates the slow Ca2+-activated K+ current IAHP via cyclic AMP-dependent protein kinase in hippocampal neurons. J Neurophysiol. 1995;74:2749–2753. doi: 10.1152/jn.1995.74.6.2749. [DOI] [PubMed] [Google Scholar]
- Sah P. Ca2+-activated K+ currents in neurones: types, physiological roles and modulation. Trends Neurosci. 1996;19:150–154. doi: 10.1016/s0166-2236(96)80026-9. [DOI] [PubMed] [Google Scholar]
- Sah P, McLachlan EM. A slow voltage-activated potassium current in rat vagal neurons. Proc Biol Sci. 1992;249:71–76. doi: 10.1098/rspb.1992.0085. [DOI] [PubMed] [Google Scholar]
- Selverston AI, Russell DF, Miller JP, King DG. The stomatogastric nervous system: structure and function of a small neural network. Prog Neurobiol. 1976;7:215–290. doi: 10.1016/0301-0082(76)90008-3. [DOI] [PubMed] [Google Scholar]
- Siegel M, Marder E, Abbott LF. Activity-dependent current distributions in model neurons. Proc Natl Acad Sci U S A. 1994;91:11308–11312. doi: 10.1073/pnas.91.24.11308. [DOI] [PMC free article] [PubMed] [Google Scholar]
- Thuma JB, Morris LG, Weaver AL, Hooper SL. Lobster (Panulirus interruptus) pyloric muscles express the motor patterns of three neural networks, only one of which innervates the muscles. J Neurosci. 2003;23:8911–8920. doi: 10.1523/JNEUROSCI.23-26-08911.2003. [DOI] [PMC free article] [PubMed] [Google Scholar]
- Toib A, Lyakhov V, Marom S. Interaction between duration of activity and time course of recovery from slow inactivation in mammalian brain Na+ channels. J Neurosci. 1998;18:1893–1903. doi: 10.1523/JNEUROSCI.18-05-01893.1998. [DOI] [PMC free article] [PubMed] [Google Scholar]
- Turrigiano G, Abbott LF, Marder E. Activity-dependent changes in the intrinsic properties of cultured neurons. Science. 1994;264:974–977. doi: 10.1126/science.8178157. [DOI] [PubMed] [Google Scholar]
- Turrigiano GG, Marder E, Abbott LF. Cellular short-term memory from a slow potassium conductance. J Neurophysiol. 1996;75:963–966. doi: 10.1152/jn.1996.75.2.963. [DOI] [PubMed] [Google Scholar]
- Weaver AL, Hooper SL. Relating network synaptic connectivity and network activity in the lobster (Panulirus interruptus) pyloric network. J Neurophysiol. 2003;90:2378–2386. doi: 10.1152/jn.00705.2002. [DOI] [PubMed] [Google Scholar]
- Yamada WM, Koch C, Adams PR. Multiple channels and calcium dynamics. In: Koch C, Segev I, editors. Methods in neuronal modeling: from synapses to networks. Cambridge, MA: MIT; 1989. pp. 97–133. [Google Scholar]
- Zittlau KE, Walther C. Hyperpolarization slowly activates a potassium current in locust skeletal muscle. Pflugers Arch. 1991;418:190–192. doi: 10.1007/BF00370470. [DOI] [PubMed] [Google Scholar]


