

Abstract
A prominent theory states that animal phenotypes arise by evolutionary changes in gene regulation, but the extent to which this theory holds true for behavioral evolution is not known. Because “nature and nurture” are now understood to involve hereditary and environmental influences on gene expression, we studied whether environmental influences on a behavioral phenotype, i.e., aggression, could have evolved into inherited differences via changes in gene expression. Here, with microarray analysis of honey bees, we show that aggression-related genes with inherited patterns of brain expression are also environmentally regulated. There were expression differences in the brain for hundreds of genes between the highly aggressive Africanized honey bee compared with European honey bee (EHB) subspecies. Similar results were obtained for EHB in response to exposure to alarm pheromone (which provokes aggression) and when comparing old and young bees (aggressive tendencies increase with age). There was significant overlap of the gene lists generated from these three microarray experiments. Moreover, there was statistical enrichment of several of the same cis regulatory motifs in promoters of genes on all three gene lists. Aggression shows a remarkably robust brain molecular signature regardless of whether it occurs because of inherited, age-related, or environmental (social) factors. It appears that one element in the evolution of different degrees of aggressive behavior in honey bees involved changes in regulation of genes that mediate the response to alarm pheromone.
Changes in gene regulation are believed to underlie the evolution of novel animal phenotypes (1–4). Emerging from studies of animal development, evidence for this theory consists largely of differences in temporal or spatial patterns of gene expression related to morphological evolution (see ref. 5 for a review). The extent to which this theory holds true for the evolution of other complex traits such as behavior is largely unknown (6). However, the underlying process is consistent with the idea that phenotypic evolution proceeds by Waddington's “genetic assimilation” of plastic responses to the environment (7, 8), which should hold widely true for behavior.
We explored this theory for behavior by taking advantage of a new perspective on the effects of “nature and nurture.” With the advent of routine transcriptomic profiling, it is now possible to study nature and nurture in terms of hereditary and environmental effects on brain gene expression, respectively (9). We used this perspective to determine whether environmental influences on a behavioral phenotype could have evolved into inherited differences via changes in gene regulation. One indication of this would be hereditary and environmental influences on the expression of common genes. For that purpose, we studied whether changes in gene regulation could be involved in the evolution of differences in aggressive behavior in the honey bee (Apis mellifera).
We used honey bee aggression because extensive prior analysis has shown that it is a rich and intricate behavioral system complete with well-defined environmental, maturational, and inherited components (10, 11). All honey bee colonies respond aggressively when their colony is disturbed or attacked, but there is striking variation in the intensity of their response. In docile colonies only a few bees may respond, whereas in more aggressive colonies, the response may involve hundreds or even thousands of stinging individuals. Colony defense begins when “guard” bees detect a disturbance at the hive entrance and release alarm pheromone, which alerts the entire colony. Older bees (who mostly forage for nectar and pollen) are more likely to respond aggressively than younger bees, but a subset of the colony's older bees, “soldiers,” are the first to seek out and attack an intruder. The most prominent example of inherited differences in honey bee aggression is the extremely aggressive disposition of Africanized honey bees (AHB) compared with European honey bees (EHB). AHB have spread through most of the New World after the introduction in 1957 of the African subspecies, A. m. scutellata (12), causing deaths of humans and animals in some parts of their newly inhabited range due to massive stinging responses. AHB derive from hybridization between A. m. scutellata and EHB (predominantly A. m. ligustica in the New World). AHB mostly have A. m. scutellata-like behavioral traits, especially a highly aggressive colony defense (13).
Aggression is a complex, polygenic trait (14). An appropriate test of the idea that there is a common molecular basis for differences in aggression due to environmental, maturational, or inherited factors thus requires analysis of multiple genes in different pathways. We therefore obtained transcriptional profiles with microarray analysis.
Results and Discussion
Hereditary Influences.
There were hundreds of differences in brain gene expression between three groups of co- and cross-fostered AHB and EHB: guards, soldiers and foragers, all under typical field conditions (Table 1). The number of genes differentially expressed between AHB and EHB increased with increased involvement in colony defense (foragers < guards < soldiers), suggesting that some of these genes are involved in the regulation of aggressive behavior even though AHB and EHB differ in several behavioral traits (10, 12). Several genes differentially expressed in the brains of AHB and EHB (“AHB list”) are implicated in the regulation of aggression in other organisms, e.g., NMDA receptor 2 and metabotropic glutamate receptor B (15).
Table 1.
Aggression-related brain gene regulation in honey bees as a function of heredity, alarm pheromone exposure, and age
| Experiment | No. of genes | Raw P value |
|---|---|---|
| AHB/EHB Guard | ||
| Individual genotype (I) | 249 | <0.0015 |
| Colony genotype (C) | 494 | <0.0025 |
| I × C | 64 | <0.0005 |
| AHB/EHB Soldier | ||
| Individual genotype (I) | 538 | <0.0025 |
| Colony genotype (C) | 830 | <0.005 |
| I × C | 114 | <0.0055 |
| AHB/EHB Forager | ||
| Individual genotype (I) | 58 | <0.00025 |
| Colony genotype (C) | 346 | <0.0015 |
| I × C | 190 | <0.001 |
| Alarm pheromone | 437 | <0.0025 |
| Old/Young | 1396 | <0.0055 |
Number of genes differentially expressed in each experiment. A false discovery rate (FDR) adjusted P value <0.05 was used as the threshold to determine statistical significance. I, differences due to individual genotype (AHB/EHB); C, differences due to colony genotype. Gene lists are in Dataset S1. Results based on individual brain gene expression profiles for 230 bees, involving a total of 332 microarrays (178, 64, and 90 for AHB/EHB, alarm pheromone and young/old experiments, respectively). For AHB/EHB, n = 5 bees per behavioral group per colony, except in one AHB and one EHB colony where 4 soldiers were analyzed, n = 2 colonies each of AHB and EHB; for alarm pheromone, n = 10 bees per group per colony, n = 2 colonies; for young/old bees, n = 12 bees per group per colony, n = 3 colonies.
Bees were cross-fostered to explore the effects of both individual worker and colony genotype on brain gene expression. Principal component analysis (PCA) revealed clear effects of both (Fig. 1). Differences in individual genotype (AHB or EHB) accounted for ≈30% of the variation in brain gene expression (PC2), whereas differences in host colony genotype accounted for ≈25% (PC3). The colony effects agree with previous findings showing that EHB reared in AHB colonies are more aggressive than when reared in EHB colonies, whereas AHB reared in EHB become less aggressive (16). These results also emphasize the close relationship between brain gene expression and aggression. Similar findings of genotype–environment interactions (17) results reflect an emerging appreciation of the potent influences of social environment on both brain gene expression and naturally occurring behavior (9).
Fig. 1.

PCA reveals effects of individual and colony genotype on aggression-related brain gene expression. Co- and cross-fostering produced the following four groups of soldiers, guards, and foragers: AA, AHB reared in AHB colony; EA, EHB in AHB colony; AE, AHB in EHB colony; and EE, EHB in EHB colony. Groups with similar expression coefficients are more similar to each other in terms of brain gene expression. The first pattern (PC1) reflects variation in brain gene expression that is similar across the four groups; PC2 is associated with differences in individual (AHB or EHB) genotype; PC3, with differences in colony genotype; and PC4, with differences in cross-fostered vs. non-cross-fostered bees.
Alarm Pheromone Influences.
Prior research has shown that the alarm pheromone isopentyl acetate induces both an instantaneous aggressive response and a longer-term sensitization, which is associated with an up-regulation of the immediate early gene and transcription factor c-Jun in the antennal lobes (18). Consistent with these results, exposing EHB to alarm pheromone at the hive entrance for 1 min affected brain expression of hundreds of genes, measured 1 h later (Table 1). Among the genes significantly up-regulated were several involved in biogenic amine signaling (Dopa decarboxylase, Tyramine receptor, and Octopamine receptor beta-2), which have been implicated in the regulation of aggression in both vertebrates (19) and invertebrates (20, 21). c-Jun was also up-regulated again [false discovery rate (FDR) adjusted P value = 0.1]. These results demonstrate strong effects of a very brief environmental stimulus on brain gene expression, which might be related to behavioral sensitization.
Common Brain Transcriptional Networks Associated with Inherited and Environmentally Induced Differences in Aggression.
Aggression shows a robust brain molecular signature regardless of whether it occurs because of inherited or environmental factors. Three results demonstrate similarities in the genes differentially regulated between AHB and EHB (AHB list) and in response to alarm pheromone (“alarm pheromone list”). First, ≈5–10% of the genes on each AHB list (guard, soldier, and forager) were also regulated by alarm pheromone, ≈2–3× higher than predicted by chance (P < 0.01, hypergeometric test; See Table 1, Table 2, and Table S1). Second, AHB and alarm pheromone brain gene expression profiles were significantly positively correlated (guard: r = 0.14, P = 0.004; soldier: r = 0.23, P < 0.001; forager: r = 0.16, P < 0.001; Table S2). Alarm pheromone thus causes AHB-like changes in brain gene expression in EHB. Third, seven of the genes on the alarm pheromone list are located within previously identified quantitative trait loci for AHB aggression, as are 12 from the AHB list (21) (Table S3). Among them, 14-3-3ε, a gene up-regulated in the brains of human suicide victims (22), was up-regulated in AHB soldier brains in this study and also in a relatively aggressive EHB strain (21). These and other genes that appear on one or more of our gene lists are good candidates for effectors of honey bee aggression. Their number and diversity underscore the complexity and polygenic nature of this behavioral trait.
Table 2.
Aggression-related brain gene regulation in honey bees: Number of genes overlapping between gene sets and regulated in the same direction
| Experiment | Old bee |
AHB guard |
AHB soldier |
AHB forager |
||||||||||||
|---|---|---|---|---|---|---|---|---|---|---|---|---|---|---|---|---|
| Expected | Observed no. | RF | P value | Expected | Observed no. | RF | P value | Expected | Observed no. | RF | P value | Expected | Observed no. | RF | P value | |
| Alarm pheromone | 55.3 | 139 | 2.5 | <0.0001 | 10 | 14 | 1.4 | 0.13 | 21.8 | 41 | 1.9 | <0.0001 | 2.3 | 4 | 1.7 | 0.16 |
| Old bee | 28.8 | 27 | 0.9 | 0.41 | 63.7 | 105 | 1.6 | <0.0001 | 6.8 | 14 | 2.1 | 0.006 | ||||
| AHB guard (I) | 11.6 | 75 | 6.5 | <0.0001 | 1.2 | 24 | 19.5 | <0.0001 | ||||||||
| AHB soldier (I) | 2.7 | 29 | 10.7 | <0.0001 | ||||||||||||
| Alarm pheromone | 55.3 | 139 | 2.5 | <0.0001 | 19.8 | 18 | 0.9 | 0.4 | 33.6 | 47 | 1.4 | 0.011 | 13.9 | 19 | 1.4 | 0.1 |
| Old bee | 57.1 | 70 | 1.2 | 0.04 | 98.3 | 162 | 1.5 | <0.0001 | 40.3 | 57 | 1.4 | 0.004 | ||||
| AHB guard (C) | 35.4 | 151 | 4.3 | <0.0001 | 14.6 | 87 | 6.0 | <0.0001 | ||||||||
| AHB soldier (C) | 24.9 | 97 | 3.9 | <0.0001 | ||||||||||||
Data are from the following: Experiment 1, AHB vs. EHB (guards, soldiers, and foragers); Experiment 2, alarm pheromone induced; and Experiment 3, old vs. young bees. Expected, the number of genes expected to overlap in all three experiments by chance alone; RF, representation factor; I, individual genotype; C, colony genotype. The statistical significance of the overlap between two lists was determined using an exact hypergeometric test and an extended version of the hypergeometric test for the overlap between three lists (see SI Text).
We also compared the AHB and alarm pheromone lists with a previously published list of genes differentially expressed in the brain between young and old EHB (23) (Table 1). Aggressive tendencies increase with age in honey bees, because old individuals are more easily aroused by alarm pheromone (24). We again detected significant overlap of gene lists; 3–7× higher than was predicted by chance for AHB, alarm pheromone, and genes that were differentially expressed in old and young bees (Table 3). Among the genes regulated in all three contexts were moody and Cyp6Q1 (Table S4), which have been implicated in aggression in rodents (25) (the mammalian ortholog of moody is the Melatonin receptor 1A, whose ligand increases aggressiveness) and in reproductive competition in Drosophila (26), respectively. There were also significant positive correlations among the AHB, alarm pheromone, and old bee brain gene expression profiles, with the strongest results for AHB soldiers (Table S2).
Table 3.
Aggression-related brain gene regulation in honey bees: Number of genes and GO categories overlapping in all three experiments
| Genotype | Genes |
GO categories |
||||||
|---|---|---|---|---|---|---|---|---|
| Expected | Observed no. | RF | P value | Expected | Observed no. | RF | P value | |
| Indivdual | ||||||||
| Alarm pheromone × old bee × AHB guard | 1.3 | 4 | 3.1 | 0.04 | 0.4 | 3 | 8.2 | 0.006 |
| Alarm pheromone × old bee × AHB soldier | 2.8 | 13 | 4.6 | <0.0001 | 0.6 | 8 | 13.4 | <0.0001 |
| Alarm pheromone × old bee × AHB forager | 0.3 | 2 | 6.7 | 0.036 | 0.2 | 0 | 0 | 1 |
| Colony | ||||||||
| Alarm pheromone × old bee × AHB guard | 2.5 | 7 | 2.7 | 0.015 | 0.6 | 3 | 4.6 | 0.023 |
| Alarm pheromone × old bee × AHB soldier | 4.3 | 19 | 4.4 | <0.0001 | 0.9 | 16 | 17 | <0.0001 |
| Alarm pheromone × old bee × AHB forager | 1.8 | 11 | 6.1 | <0.0001 | 0.6 | 6 | 9.9 | <0.0001 |
Data are from the following: Experiment 1, AHB vs. EHB (guards, soldiers, and foragers); Experiment 2, alarm pheromone induced; and Experiment 3, old vs. young bees. Expected, the number of genes expected to overlap in all three experiments by chance alone; RF, representation factor. The statistical significance of the overlap between two lists was determined using an exact hypergeometric test and an extended version of the hypergeometric test for the overlap between three lists (see SI Text).
Bioinformatic analysis of cis-regulatory motifs provided additional support for the notion that hereditary and environmental influences on aggression share a common molecular basis. Several motifs were found in the promoter regions of up-regulated genes on all three gene lists (AHB, alarm pheromone, and old bee; Table 4). In addition, the extent to which the three gene lists share the same motif association(s) is statistically significant (P < 0.001, see SI Text, Extreme Value Distribution). The motifs included Deaf1, which targets a transcription factor associated with biogenic amine signaling (27) that has been implicated in aggression in vertebrates (19) and invertebrates (20, 21), and Trl (GAGA-binding factor), a motif previously found to be associated with differences in brain gene expression between young and old bees (28). Remarkably, these same results occurred even when all genes common to the three gene lists were removed (Table 4). These findings suggest that genes associated with hereditary and environmental influences on aggression share a common brain transcriptional network.
Table 4.
cis-regulatory motifs (and corresponding transcription factors) consistently associated with up-regulated gene sets from all three experiments in Table 1
| Motif | Transcription factor | Combined P value (πc) | AHB soldierP value | Alarm pheromone P value | Old bee P value |
|---|---|---|---|---|---|
| All differentially expressed genes | |||||
| CACGCG | Hairy (Dmel) | 1.35E-05 | 0.00012 | 0.00016 | 0.007 |
| Trl | Trl (Dmel) | 4.49E-05 | 0.00058 | 0.004 | 0.0088 |
| WHWWWWWW | unknown | 8.69E-05 | 0.00035 | 0.0063 | 0.0119 |
| V_AHR_Q5 | AHR (Hs) | 0.00015 | 0.00035 | 0.0138 | 0.011 |
| V_ETF_Q6 | ETF (Hs) | 0.00035 | 0.0066 | 0.0037 | 0.027 |
| Deaf1 | Deaf1 (Dmel) | 0.00048 | 0.0149 | 0.028 | 0.00067 |
| MGAAD | Hsf (Dmel) | 0.00074 | 0.0107 | 9.21E-05 | 0.043 |
| As above, minus those common to two or more gene lists | |||||
| CACGCG | Hairy (Dmel) | 0.00043 | 0.00025 | 0.0085 | 0.032 |
| MGAAD | Hsf (Dmel) | 0.00058 | 0.0099 | 0.00027 | 0.038 |
| V_CDPCR1_01 | CDP (Hs) | 0.00062 | 0.038 | 0.0085 | 0.0028 |
| Ap | ap (Dmel) | 0.0009 | 0.0019 | 0.0073 | 0.05 |
| Trl | Trl (Dmel) | 0.00097 | 0.0017 | 0.04 | 0.02 |
| Klf4 | Klf4 (Hs) | 0.0012 | 0.042 | 4.5E-05 | 0.026 |
| CACNNG | unknown | 0.0017 | 0.0064 | 0.045 | 0.031 |
| Deaf1 | Deaf1 (Dmel) | 0.0018 | 0.0098 | 0.072 | 0.00055 |
Shown are the P values of association for each experiment (Fisher exact test, see SI Text). The significance of each motif association across all experiments is shown in Column 3 (πc), based on the combined measure Pc from Columns 4–6. The corresponding empirical P value πc(Pc(o)) and its FDR for multiple hypothesis correction was calculated (see SI Text). Only motifs with FDR <0.001 are reported. The bottom half of the table shows eight most-significant motifs discovered from the same procedure if the gene sets were purged of any genes that belonged to two or more gene sets. Only soldiers were analyzed because their brain gene expression profiles were most similar to those of alarm-pheromone-exposed and old bees. Transcription factor motifs from: Dmel, Drosophila melanogaster; Hs, Homo sapiens.
Functional Insights for Genes Associated with Inherited and Environmentally Induced Differences in Aggression.
Gene Ontology (GO) analysis was used to explore what some of the functional components of a brain transcriptional network for aggression might be. The number of common GO molecular process and biological function categories enriched for genes on all three gene lists (AHB, alarm pheromone, and old bee) was significantly higher than predicted by chance (P < 0.05) for AHB soldiers and guards, but not for foragers (Table 3). These included “response to stimulus” and “visual perception,” which makes sense because bees that are aroused by alarm pheromone visually search for intruders in the vicinity of the hive, and perception of movement stimulates stinging (10, 29) (Fig. 2). Cyp6a20 has been reported to be involved in both hereditary and environmental regulation of aggression in Drosophila melanogaster (30); its expression in olfactory sensory organs also suggests a function in response to aggression-related stimuli.
Fig. 2.

GO functional analysis of genes associated with aggression: GO biological process and molecular function categories that were significantly enriched among the genes associated with aggression in all three experiments, i.e., as a function of heredity, alarm pheromone, and age (Table 4). Diagram represents GO categories hierarchically from top to bottom. Each box represents a GO category. Blue, up-regulation; red, down-regulation. Significantly enriched categories: (2) response to stimulus, (3) metabolic process, (6) electron carrier activity, (8) structural molecule activity, (13) oxidation reduction, (15) protein binding, (16) isomerase activity, (17) oxidoreductase activity, (18) structural constituent of ribosome, (21) detection of external stimulus, (29) inositol-3-phosphate synthase activity, (33) regulation of S phase, (35) visual perception, (36) inositol biosynthetic process, (37) regulation of S phase of mitotic cell cycle, (38) monovalent inorganic cation transmembrane transporter activity, (39) positive regulation of S phase of mitotic cell cycle, and (40) hydrogen ion transmembrane transporter activity. Other GO terms given in SI Text.
The most striking functional component of the brain transcriptional network for aggression suggested by GO analysis relates to brain metabolism. Genes involved in metabolism-related GO categories were significantly overrepresented on the AHB soldier, alarm pheromone, and old bee gene lists, all down-regulated. Down-regulation of brain metabolism genes, previously reported for old bees with a different microarray (31), was confirmed by enzyme assays performed on bee brain mitochondrial preparations (Fig. 3). Aggressive bees had lower brain mitochondrial activity in specific assays for Complex I, IV, and V of the oxidative phosphorylation pathway, which were the complexes represented most prominently on the gene lists (Table S5). Because oxidative phosphorylation is a major pathway in brain metabolism, mRNA abundance and enzyme activity in this pathway likely provide a good indication of brain metabolic activity. These whole-brain results may mask increased brain metabolism in some brain regions, but because the integration of information from multiple sensory modalities required for colony defense involves some of the largest regions in the bee brain (mushroom bodies and optic lobes), the results likely accurately reflect the global neurogenomic state of the aroused bee brain.
Fig. 3.

Aggression-related decrease in brain metabolism as a function of heredity, alarm pheromone exposure, and age. Results of assays of enzyme activity for Complex I (NADH dehydrogenase), IV (cytochrome c oxidase), and V (ATP synthase) performed on mitochondrial preparations from bee brains. n = 4 biological replicates for each of the six groups labeled on the x axes of the three graphs; two pools of five brains per colony per behavioral group from two colonies. n = 3 technical replicates per sample. Statistical analysis: 1-way ANOVA with Tukey HSD posthoc. EHB, EHB bees in EHB colonies; AHB, AHB bees in AHB colonies. See SI Text for methods. Means ± SD are shown.
We did not expect to find an association between increased behavioral arousal and decreased brain metabolism. Behavioral arousal is associated with increased whole body metabolic activity in honey bees (32).
The association was all the more surprising considering that the alarm pheromone experiment demonstrated a causal relationship: Exposure to alarm pheromone increases behavioral arousal (18) and we showed that it decreased brain metabolism. Alarm pheromone exposure also is known to increase metabolic activity in honey bees (33) and higher cytochrome c oxidase activity is associated with increased aggressive behavior in rodents and lizards (34). However, a correlation between reduced metabolism and aggression has been reported for some regions of the human brain (35).
We speculate that decreased brain metabolism in aroused bees, if reflective of reduced background neural activity, could function as a “contrast enhancement” mechanism to enhance the bees' ability to locate or respond to a threat. Decreased brain metabolism reflects decreased neural activity in rats (36) and monkeys (37), and decreased neuronal activity in the human visual cortex has been reported to lead to improved visual representations of salient shapes (38). Another possibility is that our findings relate to some sort of energy tradeoff between the brain and the rest of the body. This notion is based on the (untested) assumption that, as in vertebrates (39), the insect brain consumes a disproportionately large share of the body's total glucose utilization. According to this idea, arousal-related increases in metabolic rate require a decrease in brain metabolism, at least for a “fight or flight” type of innate behavior. This tradeoff might not exist for a behavior that must be learned; learning is associated with increased brain metabolism (40–42). The relationship between brain metabolism and behavioral performance deserves more study.
Conclusion
Previous research has shown that there are striking differences in aggression between honey bee colonies, and our research has shown that aggression-related brain gene expression in honey bees is subject to strong inherited and environmental influences. AHB and EHB differed in the expression of hundreds of genes, with the strongest differences seen in those bees most-strongly engaged in colony defense. Environmental effects were seen both in terms of effects of alarm pheromone and colony environment on brain gene expression. Based on these findings we find support for the idea that changes in gene regulation underlie the evolution of behavioral diversity.
We suggest that environmental influences on aggression, i.e., responsiveness to alarm pheromone, could have evolved into the inherited differences in aggression exhibited by AHB and EHB—nurture begets nature. Evolutionary changes in brain gene expression may have resulted in an increase in arousal for AHB, a decrease in arousal for EHB, or both. Alarm pheromone has two behavioral effects: A rapid response, quicker than any transcriptionally based mechanism could possibly generate, and a slower, more long-term, sensitization (18). Given known differences in aggressive behavior between AHB and EHB (10, 11), our proposed scenario would have to involve molecular components of alarm pheromone's slower effects that then result in heritable changes in both the quick and slow responses.
Relating changes in the regulation of gene expression to morphological trait evolution usually involves targeted manipulation of single genes (1, 5). Because the regulation of complex behavioral phenotypes involves many genes and pathways, the transcriptomic and informatic approaches presented here provide an accessible entrée for exploring the relationship between gene regulation and behavioral evolution in other species as well.
Materials and Methods
AHB Experiment.
This experiment was performed near Ixtapan de la Sal, Mexico (19° N, 99° W), which has been part of the range of the AHB for 20 years. Bees (n ≈1,000–1,300), paint-marked for genotype upon adult emergence, were co- and cross-fostered and placed in two EHB and two AHB colonies, each composed of ≈5,000 bees with typical age structures. Foragers, guards, and soldiers were identified according to established methods. Briefly, guards were identified as bees at the hive entrance either patrolling or standing with an alert posture (43). Foragers were identified as bees returning to the hive with a pollen load. Soldiers were collected in a specially designed trap after waving a leather patch with 10 μL isopentyl acetate over the top of an opened hive at a rate of 1 circuit/s for 10 s (44). Bees were collected into liquid nitrogen upon identification in the field and transferred to a −80 °C freezer. Brain dissection was as described in ref. 45. Some of our results (up-regulation of the visual perception GO category) may represent the contribution of small amounts of peripheral visual tissue adhering to the brains after dissection, but all samples were handled identically and there is evidence for brain expression of some of the genes in this GO category in insects (opsins and arrestins) (46).
Alarm Pheromone Experiment.
This experiment was performed at the University of Illinois Bee Research Facility, Urbana, IL; the bees in this region are a mixture of European subspecies, predominantly Apis mellifera ligustica. After presenting a piece of filter paper with 2.5 μL isopentyl acetate diluted in mineral oil (1:10) (Sigma–Aldrich) for 60 s at the hive entrance (18), the most aroused-looking bees at the entrance were caged for 60 min and frozen; the response to alarm pheromone increases for 60 min and then levels off (10). Control bees were collected at the hive entrance before alarm pheromone presentation and immediately frozen. Bees were not caged because this can cause alarm pheromone release. This necessary confound in experimental design was considered tolerable because our main goal was to compare gene expression across the different experiments. Levels of c-Jun mRNA in the antennal lobes 30 min after exposure to alarm pheromone were used to identify the most responsive colonies (18); bees from Colonies 24 and 27 were chosen (Fig. S1). Unlike in ref. 18, not all colonies showed significant c-Jun induction (Fig. S1).
Microarray Procedures.
The microarray has been characterized in previous studies (23, 47). It contains 28,800 oligos (including 2,000 control sequences) based largely on annotation from the honey bee genome sequencing project (48). Loop designs were used, with a total of 332 microarrays used to profile 230 individual brains in the three studies (AHB, alarm pheromone, old bee). Microarray procedures were performed as in ref. 23 (Fig. S2). To quantify gene expression from individual brains, RNA was amplified according to manufacturer instruction with the Amino Allyl MessageAmp II aRNA Amplifcation kit (Ambion) starting with 500 ng RNA. Each microarray hybridization used 2.5 μg RNA. Dye coupling and labeled aRNA cleanup was performed with the Amino Allyl MessageAmp II aRNA Amplifcation kit as in ref. 23. Slides were scanned with an Axon 4000B scanner, and images were analyzed with the GENEPIX software (Agilent Technologies).
Microarray Data Analysis.
Analysis was performed as in ref. 23. Genes abundantly expressed in hypopharyngeal glands (a potential source of tissue contamination in brain samples) were filtered as in ref. 23. A Loess transformation was performed using Beehive (http://stagbeetle.animal.uiuc.edu/Beehive) to normalize expression intensities. A linear mixed-effects model implemented by using restricted maximum likelihood was used to describe the normalized log2 transformed gene intensities values, including the effects of dye, treatment (alarm pheromone or behavioral group), bee, and microarray. Effects were evaluated with an F-test statistic and the P values were adjusted for multiple testing by using a FDR criterion. Results from four genes from AHB/EHB lists (Uvop, Gβe, trp, and tpnCI) were validated with quantitative RT-PCR (Fig. S3; for a list of primers used, see Table S6). PCA was performed on the results from the AHB experiment with GeneSpring (Agilent) by using zero-centered, log2-transformed normalized values of expression data for all genes expressed on the oligoarrays. PCA was performed on guards, soldiers, and foragers independently, with individual bees from all four groups (AHB and EHB bees in AHB and EHB colonies).
Functional Analysis.
GO enrichment analysis was performed with Drosophila orthologs to bee genes (Dataset S1). Enrichment was determined by using GOToolBox (49) with a hypergeometric test followed by FDR correction for multiple testing (GO categories at P < 0.05 shown). For each experiment the reference gene set corresponds to the total number of genes analyzed on the microarray. Lists of GO functions are provided in Dataset S2.
Statistical Analysis to Determine Overlap on Gene Lists.
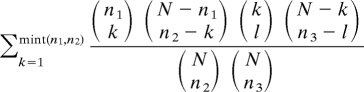
To determine whether the number of genes that overlapped on two gene lists (AHB, alarm pheromone, old bee) was statistically significant, a “representation factor” was calculated. This factor is the number of observed overlapping genes divided by the expected number of overlapping genes. The denominator is calculated as the product of the number of oligos differentially expressed in each experiment divided by the total number of oligos analyzed (50). Overlap for three experiments and for GO categories from the three gene lists was calculated similarly. We tested statistical significance by using an exact hypergeometric test (1-tailed) for the overlap between two gene lists and an extended version of the hypergeometric test for the overlap between three gene lists. For a universe of N items and three randomly sampled subsets of sizes n1, n2, and n3, respectively, we calculated the probability of an overlap of size l as per the formula below, by summing over all possible values of the overlap k (≥l) between the first two sets. This probability was then used to calculate a P value for the test, by summing over values of l that are greater than or equal to the observed overlap of the three sets.
 |
cis-Regulatory Analaysis: Motif Collection.
Motifs representing experimentally characterized binding specificities were collected from FlyREG (D. melanogaster), Transfac (D. melanogaster, Homo sapiens), and Jaspar (H. sapiens). Computationally predicted motifs (D. melanogaster) from Xie et al. (51) were also included. We had a compendium of 602 motifs.
cis-Regulatory Analaysis: Determining Genes Targeted by a Transcription Factor Motif.
To determine whether a gene has a motif in its promoter, we considered the 5 Kbp upstream region of the gene, by using the A. melliferra genome (Amel_v2.0) and Release 1 of the official gene set (48). Methods were performed as in ref. 23 (see SI Text).
Measurements of Brain Mitochondrial Enzyme Activities.
Each sample consisted of mitochondrial preparations from a pool of five brains, with bees from two colonies per behavioral group per experiment. Mitochondrial activities were measured 60 min after alarm pheromone exposure. Brain metabolism of AHB soldiers from AHB colonies was compared with EHB soldiers from EHB colonies. Brains were homogenized at 4 °C in ice-cold SET buffer (0.25M sucrose, 0.5 mM potassium EGTA, 10 mM Tris, pH 7.4) by using a Dounce homogenizer, then centrifuged for 3 min at 2,000 × g at 4 °C. The pellet was then centrifuged again for 3 min at 2,000 × g at 4 °C, and the resulting supernatant was centrifuged at 12,000 × g at 4 °C for 15 min to obtain a crude mitochondrial fraction. The mitochondrial pellet was subsequently resuspended in 200 μL ice-cold 3% Ficoll solution and layered onto 800 μL ice-cold 6% Ficoll solution, then centrifuged for 10 min at 11,500 × g at 4 °C. The final pellet was resuspended to a final volume of 1 mL in MSH buffer (210 mM mannitol, 70 mM sucrose, 5 mM Hepes, pH 7.4) or a hypotonic buffer containing 25 mM KH2PO4, pH 7.2 and 5 mM MgCl2, then stored on ice until use. Samples were used within 4 h of isolation. Total protein concentration was determined by using a Pierce Micro BCA Protein Assay Kit (ThermoFisher Scientific). See SI Text for measurement of mitochondrial enzyme activities.
Supplementary Material
Acknowledgments.
We thank D. Caseman, M. Caseman, M. Chambers, T. Lucas, and M. Twotwo for assistance with bee collections; S. Liang, L. Qi, and Y. Wang for assistance with brain dissection; T. Newman and S. Zhang for assistance with microarray analysis and primer design; J. George for advice; and Y. Ben-Shahar, Y. Le Conte, M.B. Sokolowski, L.J. Stubbs, and members of the Robinson lab for comments that improved the manuscript. This is part of a series of papers arising from a National Science Foundation Frontiers in Biological Research grant (B.R. Schatz, Principal Investigator) that uses large-scale analysis to explore the influences of heredity and the environment on brain gene expression and behavior. Additional funding was received from the Fyssen Foundation (to C.A.), National Institutes of Health Grant 5 R01 GM068946 (to S.R.-Z. and G.E.R.), the Illinois Sociogenomics Initiative, National Institutes of Health Grant DC 006395, and US Department of Agriculture National Research Initiative Grant 2004-35604-14277 (to G.E.R.).
Footnotes
The authors declare no conflict of interest.
Data deposition footnote. Microarray data in this paper have been deposited at ArrayExpress, www.ebi.ac.uk/arrayexpress/ (accession numbers E-TABM-604, E-TABM-605, E-TABM-606, and E-TABM-607).
This article contains supporting information online at www.pnas.org/cgi/content/full/0907043106/DCSupplemental.
References
- 1.Carroll SB. Evolution at two levels: On genes and form. PLoS Biol. 2005;3:e245. doi: 10.1371/journal.pbio.0030245. [DOI] [PMC free article] [PubMed] [Google Scholar]
- 2.Carroll SB, Jennifer K, Grenier JK, Weatherbee SD. From DNA to Diversity. Molecular Genetics and the Evolution of Animal Design. Oxford: Blackwell Science; 2001. [Google Scholar]
- 3.Davidson EH. Genomic Regulatory Systems: Development and Evolution. San Diego: Academic; 2001. [Google Scholar]
- 4.Stern DL. Evolutionary developmental biology and the problem of variation. Evolution. 2000;54:1079–1091. doi: 10.1111/j.0014-3820.2000.tb00544.x. [DOI] [PubMed] [Google Scholar]
- 5.Carroll SB. Evo-devo and an expanding evolutionary synthesis: A genetic theory of morphological evolution. Cell. 2008;134:25–36. doi: 10.1016/j.cell.2008.06.030. [DOI] [PubMed] [Google Scholar]
- 6.Robinson GE, Ben-Shahar Y. Social behavior and comparative genomics: New genes or new gene regulation? Genes Brain Behav. 2002;1:197–203. doi: 10.1034/j.1601-183x.2002.10401.x. [DOI] [PubMed] [Google Scholar]
- 7.West-Eberhard MJ. Developmental Plasticity and Evolution. New York: Oxford Univ Press; 2003. [Google Scholar]
- 8.West-Eberhard MJ. Developmental plasticity and the origin of species differences. Proc Natl Acad Sci USA. 2005;102(Suppl 1):6543–6549. doi: 10.1073/pnas.0501844102. [DOI] [PMC free article] [PubMed] [Google Scholar]
- 9.Robinson GE, Fernald RD, Clayton DF. Genes and social behavior. Science. 2008;322:896–900. doi: 10.1126/science.1159277. [DOI] [PMC free article] [PubMed] [Google Scholar]
- 10.Breed MD, Guzman-Novoa E, Hunt GJ. Defensive behavior of honey bees: Organization, genetics, and comparisons with other bees. Annu Rev Entomol. 2004;49:271–298. doi: 10.1146/annurev.ento.49.061802.123155. [DOI] [PubMed] [Google Scholar]
- 11.Hunt GJ. Flight and fight: A comparative view of the neurophysiology and genetics of honey bee defensive behavior. J Insect Physiol. 2007;53:399–410. doi: 10.1016/j.jinsphys.2007.01.010. [DOI] [PMC free article] [PubMed] [Google Scholar]
- 12.Winston ML. The Biology of the Honey Bee. Cambridge, MA: Harvard Univ Press; 1987. [Google Scholar]
- 13.Schneider SS, DeGrandi-Hoffman G, Smith DR. The African honey bee: Factors contributing to a successful biological invasion. Annu Rev Entomol. 2004;49:351–376. doi: 10.1146/annurev.ento.49.061802.123359. [DOI] [PubMed] [Google Scholar]
- 14.Nelson RJ. Biology of Aggression. New York: Oxford Univ Press; 2005. [Google Scholar]
- 15.Vekovischeva OY, Aitta-aho T, Verbitskaya E, Sandnabba K, Korpi ER. Acute effects of AMPA-type glutamate receptor antagonists on intermale social behavior in two mouse lines bidirectionally selected for offensive aggression. Pharmacol Biochem Behav. 2007;87:241–249. doi: 10.1016/j.pbb.2007.04.020. [DOI] [PubMed] [Google Scholar]
- 16.Hunt GJ, Guzmán-Novoa E, Uribe-Rubio JL, Prieto-Merlo D. Genotype–environment interactions in honeybee guarding behaviour. Anim Behav. 2003;66:459–467. [Google Scholar]
- 17.Wang J, Ross KG, Keller L. Genome-wide expression patterns and the genetic architecture of a fundamental social trait. PLoS Genet. 2008;4:e1000127. doi: 10.1371/journal.pgen.1000127. [DOI] [PMC free article] [PubMed] [Google Scholar]
- 18.Alaux C, Robinson GE. Alarm pheromone induces immediate-early gene expression and slow behavioral response in honey bees. J Chem Ecol. 2007;33:1346–1350. doi: 10.1007/s10886-007-9301-6. [DOI] [PubMed] [Google Scholar]
- 19.Nelson RJ, Chiavegatto S. Molecular basis of aggression. Trends Neurosci. 2001;24:713–719. doi: 10.1016/s0166-2236(00)01996-2. [DOI] [PubMed] [Google Scholar]
- 20.Dierick HA, Greenspan RJ. Serotonin and neuropeptide F have opposite modulatory effects on fly aggression. Nat Genet. 2007;39:678–682. doi: 10.1038/ng2029. [DOI] [PubMed] [Google Scholar]
- 21.Hunt GJ, et al. Behavioral genomics of honeybee foraging and nest defense. Naturwissenschaften. 2007;94:247–267. doi: 10.1007/s00114-006-0183-1. [DOI] [PMC free article] [PubMed] [Google Scholar]
- 22.Yanagi M, et al. Association of 14-3-3 epsilon gene haplotype with completed suicide in Japanese. J Hum Genet. 2005;50:210–216. doi: 10.1007/s10038-005-0241-0. [DOI] [PubMed] [Google Scholar]
- 23.Alaux C, et al. Regulation of brain gene expression in honey bees by brood pheromone. Genes Brain Behav. 2009;8:309–319. doi: 10.1111/j.1601-183X.2009.00480.x. [DOI] [PubMed] [Google Scholar]
- 24.Robinson GE. Modulation of alarm pheromone perception in the honey bee: Evidence for division of labor based on hormonally regulated response thresholds. J Comp Physiol A. 1987;160:613–619. [Google Scholar]
- 25.Soma KK, Scotti MA, Newman AE, Charlier TD, Demas GE. Novel mechanisms for neuroendocrine regulation of aggression. Front Neuroendocrinol. 2008;29:476–489. doi: 10.1016/j.yfrne.2007.12.003. [DOI] [PubMed] [Google Scholar]
- 26.Drnevich JM, Reedy MM, Ruedi EA, Rodriguez-Zas S, Hughes KA. Quantitative evolutionary genomics: Differential gene expression and male reproductive success in Drosophila melanogaster. Proc Biol Sci. 2004;271:2267–2273. doi: 10.1098/rspb.2004.2880. [DOI] [PMC free article] [PubMed] [Google Scholar]
- 27.Czesak M, Lemonde S, Peterson EA, Rogaeva A, Albert PR. Cell-specific repressor or enhancer activities of Deaf-1 at a serotonin 1A receptor gene polymorphism. J Neurosci. 2006;26:1864–1871. doi: 10.1523/JNEUROSCI.2643-05.2006. [DOI] [PMC free article] [PubMed] [Google Scholar]
- 28.Sinha S, Ling X, Whitfield CW, Zhai C, Robinson GE. Genome scan for cis-regulatory DNA motifs associated with social behavior in honey bees. Proc Natl Acad Sci USA. 2006;103:16352–16357. doi: 10.1073/pnas.0607448103. [DOI] [PMC free article] [PubMed] [Google Scholar]
- 29.Wager BR, Breed MD. Does honey bee sting alarm pheromone give orientation information to defensive bees? Ann Entomol Soc Am. 2000;93:1329–1332. [Google Scholar]
- 30.Wang L, Dankert H, Perona P, Anderson DJ. A common genetic target for environmental and heritable influences on aggressiveness in Drosophila. Proc Natl Acad Sci USA. 2008;105:5657–5663. doi: 10.1073/pnas.0801327105. [DOI] [PMC free article] [PubMed] [Google Scholar]
- 31.Ament SA, Corona M, Pollock HS, Robinson GE. Insulin signaling is involved in the regulation of worker division of labor in honey bee colonies. Proc Natl Acad Sci USA. 2008;105:4226–4231. doi: 10.1073/pnas.0800630105. [DOI] [PMC free article] [PubMed] [Google Scholar]
- 32.Harrison JF, Hall HG. African–European honeybee hybrids have low nonintermediate metabolic capacities. Nature. 1993;363:258–260. [Google Scholar]
- 33.Southwick EE, Moritz RFA. Metabolic response to alarm pheromone in honey bees. J Insect Physiol. 1985;31:389–392. [Google Scholar]
- 34.Sakata JT, Crews D, Gonzalez-Lima F. Behavioral correlates of differences in neural metabolic capacity. Brain Res Brain Res Rev. 2005;48:1–15. doi: 10.1016/j.brainresrev.2004.07.017. [DOI] [PubMed] [Google Scholar]
- 35.Anckarsäter H. Central nervous changes in social dysfunction: Autism, aggression, and psychopathy. Brain Res Bull. 2006;69:259–265. doi: 10.1016/j.brainresbull.2006.01.008. [DOI] [PubMed] [Google Scholar]
- 36.Du F, et al. Tightly coupled brain activity and cerebral ATP metabolic rate. Proc Natl Acad Sci USA. 2008;105:6409–6414. doi: 10.1073/pnas.0710766105. [DOI] [PMC free article] [PubMed] [Google Scholar]
- 37.Shmuel A, Augath M, Oeltermann A, Logothetis NK. Negative functional MRI response correlates with decreases in neuronal activity in monkey visual area V1. Nat Neurosci. 2006;9:569–577. doi: 10.1038/nn1675. [DOI] [PubMed] [Google Scholar]
- 38.Kourtzi Z, Betts LR, Sarkheil P, Welchman AE. Distributed neural plasticity for shape learning in the human visual cortex. PLoS Biol. 2005;3:e204. doi: 10.1371/journal.pbio.0030204. [DOI] [PMC free article] [PubMed] [Google Scholar]
- 39.Sokoloff L. Section I, Neurophysiology. In: Field J, Magoun HW, Hall VE, editors. Handbook of Physiology. Vol 3. Washington DC: Am Physiol Soc; 1960. pp. 1843–1864. [Google Scholar]
- 40.Conejo NM, Gonzalez-Pardo H, Vallejo G, Arias JL. Changes in brain oxidative metabolism induced by water maze training. Neuroscience. 2007;145:403–412. doi: 10.1016/j.neuroscience.2006.11.057. [DOI] [PubMed] [Google Scholar]
- 41.Deglise P, Dacher M, Dion E, Gauthier M, Armengaud C. Regional brain variations of cytochrome oxidase staining during olfactory learning in the honeybee (Apis mellifera) Behav Neurosci. 2003;117:540–547. doi: 10.1037/0735-7044.117.3.540. [DOI] [PubMed] [Google Scholar]
- 42.Poremba A, Jones D, Gonzalez-Lima F. Classical conditioning modifies cytochrome oxidase activity in the auditory system. Eur J Neurosci. 1998;10:3035–3043. doi: 10.1046/j.1460-9568.1998.00304.x. [DOI] [PubMed] [Google Scholar]
- 43.Arechavaleta-Velasco ME, Hunt GJ, Emore C. Quantitative trait loci that influence the expression of guarding and stinging behaviors of individual honey bees. Behav Genet. 2003;33:357–364. doi: 10.1023/a:1023458827643. [DOI] [PubMed] [Google Scholar]
- 44.Guzmán-Novoa E, Page RE, Spangler HG, Erickson EH. A comparison of two assays to test the defensive behaviour of honeybees (Apis mellifera) J Apicult Res. 1999;38:205–209. [Google Scholar]
- 45.Schulz DJ, Robinson GE. Biogenic amines and division of labor in honey bee colonies: Behaviorally related changes in the antennal lobes and age-related changes in the mushroom bodies. J Comp Physiol. 1999;184:481–488. doi: 10.1007/s003590050348. [DOI] [PubMed] [Google Scholar]
- 46.Lampel J, Briscoe AD, Wasserthal LT. Expression of UV-, blue-, long-wavelength-sensitive opsins and melatonin in extraretinal photoreceptors of the optic lobes of hawk moths. Cell Tissue Res. 2005;321:443–458. doi: 10.1007/s00441-004-1069-1. [DOI] [PubMed] [Google Scholar]
- 47.Kocher SD, Richard FJ, Tarpy DR, Grozinger CM. Genomic analysis of post-mating changes in the honey bee queen (Apis mellifera) BMC Genomics. 2008;9:232. doi: 10.1186/1471-2164-9-232. [DOI] [PMC free article] [PubMed] [Google Scholar]
- 48.Honey Bee Genome Sequencing Consortium. Insights into social insects from the genome of the honeybee Apis mellifera. Nature. 2006;443:931–949. doi: 10.1038/nature05260. [DOI] [PMC free article] [PubMed] [Google Scholar]
- 49.Martin D, et al. GOToolBox: Functional analysis of gene datasets based on Gene Ontology. Genome Biol. 2004;5:R101. doi: 10.1186/gb-2004-5-12-r101. [DOI] [PMC free article] [PubMed] [Google Scholar]
- 50.Kim SK, et al. A gene expression map for Caenorhabditis elegans. Science. 2001;293:2087–2092. doi: 10.1126/science.1061603. [DOI] [PubMed] [Google Scholar]
- 51.Xie X, et al. Systematic discovery of regulatory motifs in human promoters and 3′ UTRs by comparison of several mammals. Nature. 2005;434:338–345. doi: 10.1038/nature03441. [DOI] [PMC free article] [PubMed] [Google Scholar]
Associated Data
This section collects any data citations, data availability statements, or supplementary materials included in this article.