Abstract
Diversity-oriented organic synthesis (DOS) is a strategy to make compound collections to probe biological systems1-7. Designing better DOS libraries requires having methods to assess the consequences of different synthesis decisions on the biological performance of resulting library members8. Since we are particularly interested in how stereochemistry affects performance in biological assays, we prepared a disaccharide library containing systematic stereochemical variations, assayed the library for different biological effects, and developed methods to assess the similarity of performance between members across multiple assays. These methods allow us to ask which subsets of stereochemical features best predict similarity in patterns of biological performance between individual members and which features produce the greatest variation of outcomes. We anticipate that the data-analysis approach presented here can be generalized to other sets of biological assays and other chemical descriptors. Methods to assess which structural features of library members produce the greatest similarity in performance for a given set of biological assays should help prioritize synthesis decisions in second-generation library development targeting the underlying cell-biological processes. Methods to assess which structural features of library members produce the greatest variation in performance should help guide decisions about what synthetic methods need to be developed to make optimal small-molecule screening collections.
Keywords: adipocyte, biological profile, cell-based assay, chemical similarity, cheminformatics, disaccharide, mitochondrial membrane potential, molecular fingerprint, predictive modeling, stereochemistry
Introduction
There is a growing interest in making small-molecule libraries with diverse three-dimensional structures. Stereochemical features of small molecules affect their biological performance8-11, but efforts to quantify the roles of such features have been limited. In order to enable a rigorous study of the effects of stereochemistry on biological performance, a collection of small molecules containing systematic variation of multiple stereocenters is required. Carbohydrates offer an opportunity to vary individual stereocenters independently of changes in physical properties, topology, and appendage diversity, but like many complex scaffolds with three-dimensionality, it is not easy to make a large number of different oligosaccharide frameworks. Chemists must make choices about what to synthesize.
In practice, the biological performance of collections of oligosaccharides has been underexplored, in part due to the difficulty in synthesizing all possible stereochemical variants, but also due to lengthy syntheses required to make even monomers12. Another possible reason is that oligosaccharides are often thought to be unsuitable as small-molecule probes of cell biology, conceivably due to a lack of cell permeability or to metabolic transformation within the cell13. Given the synthetic difficulties in making these molecules, we wondered whether this impression may actually result from insufficient biological testing of oligosaccharide collections. In this study, we wanted to see if we could make a relatively small number of different disaccharide skeletons and determine which structural features correspond to similarity and variation in biological performance. These experiments would teach us the stereochemical features on which to focus in second-generation libraries intended to be enriched in likelihood and diversity of biological activities.
We first tested a subset of disaccharides in several cell-biological assays that we had previously developed, representing different cellular states, and chose two readouts to optimize our observation of dose-dependent biological effects. We defined the glycosidic bond combinatorially based on regiochemistry and relative stereochemistry, synthesized a library of 64 disaccharides, and assessed biological activities of these molecules at multiple concentrations. In order to derive relationships more sophisticated than those determined by analyzing individual compound effects, we developed methods to match biological performance similarity across multiple assays with chemical structure similarity using a stereochemical description of the library. Unsupervised clustering of the resulting biological measurements revealed patterns corresponding to particular stereochemical features of the disaccharides. To refine these relationships, we used an optimization algorithm to determine subsets of stereochemical features most important to biological performance similarity. Our results suggest that sets of stereocenters responsible for activity patterns can be determined in a systematic fashion. This approach allows data-driven decisions about synthetic choices for follow-up chemistry.
Results
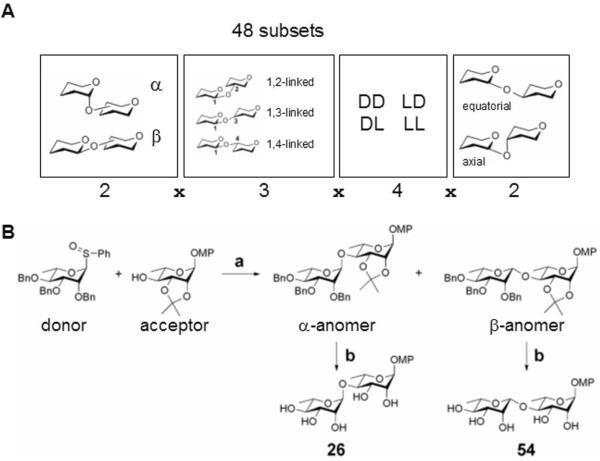
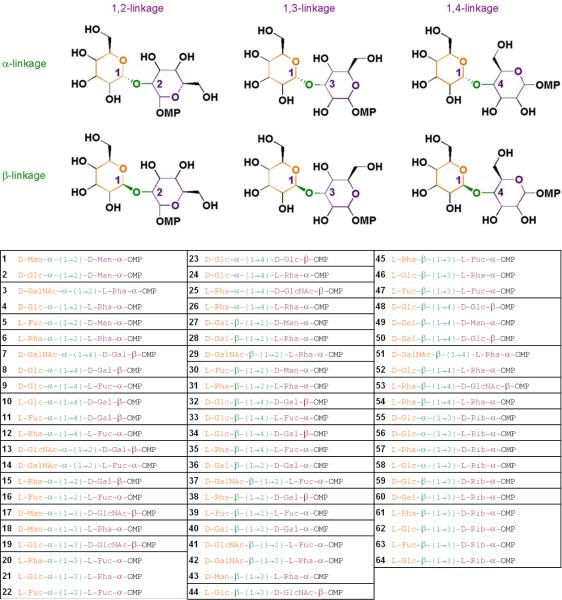
We sought to represent maximal disaccharide-based structural diversity, using a minimal set of disaccharide skeletons, by focusing on variations of the glycosidic bond. The effect of the glycosidic bond on the overall structural diversity of disaccharides has been well-appreciated for decades14,15. The conformation of a disaccharide is largely determined by the glycosidic linkage between the two monosaccharide rings. Endo-lexo- anomeric effects result in a relatively rigid conformation of the glycosidic bond that controls the overall shape of the disaccharide16-19, yielding compounds that are not merely flat conjugations of ring systems. We varied the following structural features (Figure 1A): the anomeric bond configuration (α or β), the linkage position on the reducing-end sugar monomer (1,2-, 1,3-, or 1,4-linked), the chirality of sugar monomers around the glycosidic bond (DD, LD, DL, or LL), and the stereochemistry of the acceptor hydroxyl group (equatorial or axial). These structural definitions enabled us to represent the full diversity of 48 combinations describing the glycosidic bond using a limited number of disaccharide skeletons.
Figure 1. Stereochemical diversity by variation of the glycosidic linkage.
(A) A combinatorial definition of the glycosidic linkage including four categorical features (2 × 3 × 4 × 2) = 48 subsets. (B) Synthesis of representative L-rhamnose-L-rhamnose disaccharides 26 (L-Rha-α-(1→4)-L-Rha-α-OMP) and 54 (L-Rha-β-(1→4)-L-Rha-α-OMP; see Table 1). Reaction conditions: (a) Tf2O, 2,6-di-tert-butyl-4-methylpyridine, 4-allyl-3,4-dimethoxybenzene, 4Å molecular sieves, CH2Cl2, -78°C, α-anomer: 89%, β-anomer: 6%; (b) H2, 10% Pd/C Degussa-type E101 NE/W, MeOH, 26: 59%, 54: 40%.
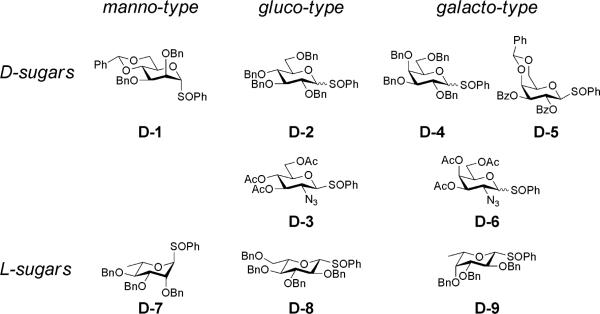
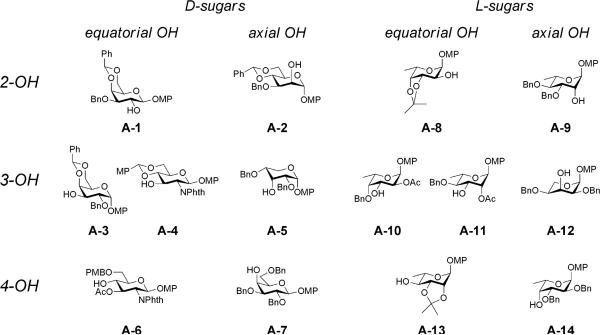
We chose four commercially available monosaccharides as monomers (D-glucose, D-ribose, D-galactose, D-mannose), two corresponding enantiomers (L-glucose and L-ribose), and two 6-deoxy-L-variants (L-fucose or 6-deoxy-L-galactose, and L-rhamnose or 6-deoxy-L-mannose). To assess the importance of substituent effects, we also included monosaccharides containing an alternative functional group, in this case two amino sugars (D-N-acetyl-glucosamine and D-N-acetyl-galactosamine), for a total of 10 monosaccharide subunits. Recognizing that many biologically active molecules contain both hydrophilic and hydrophobic moieties, we chose to use the p-methoxyphenyl (OMP) group at the reducing end of the disaccharides, since OMP is easy to introduce or remove and is stable under most protecting-group manipulations. We chose the sulfoxide glycosylation methodology (Figure 1B)20,21 and used a total of 9 different protected sulfoxide donors representing 8 monosaccharide subunits (Figure 2), and 14 different protected acceptors representing 9 monosaccharide subunits (Figure 3), in a total of 40 glycosylation reactions (Supplementary Table T1 to synthesize 59 compounds. We supplemented these products with 5 additional compounds (1, 23, 48, 49, 50) prepared from commercially available disaccharides (Sigma-Aldrich; see Supplementary Information for CAS registry numbers and synthetic details) for a total library of 64 disaccharides (Table 1). Our library synthesis strategy relied on post-synthetic chromatography to separate some mixtures, resulting in a total number of compounds (64) greater than the number of design subsets (48). Each disaccharide was characterized by 1H and 13C NMR and by ESIMS (compound characterization provided as Supplementary Information).
Figure 2. Structures of sulfoxide donor monosaccharides.
Structures of the nine donor monosaccharides used in any of the 40 glycosylation reactions (see text). A complete accounting of participation of donor monosaccharides in these reactions is provided as Supplementary Information (Supplementary Table T1).
Figure 3. Structures of acceptor monosaccharides.
Structures of the fourteen acceptor monosaccharides used in any of the 40 glycosylation reactions (see text). A complete accounting of participation of acceptor monosaccharides in these reactions is provided as Supplementary Information (Supplementary Table T1).
Table 1. Color-coded representation of 64-member disaccharide library.
Structural elements represented are: acceptor monosaccharide (non-reducing end; orange); glycosidic linkage (green); and donor monosaccharide (reducing end; purple). Monosaccharide abbreviations are: mannose (Man), glucose (Glc), N-acetyl-galactose (GalNAc), rhamnose (Rha), fucose (Fuc), galactose (Gal), N-acetyl-glucose (GlcNAc), ribose (Rib). Black boxes indicate the 48 subsets described in Figure 1.
 |
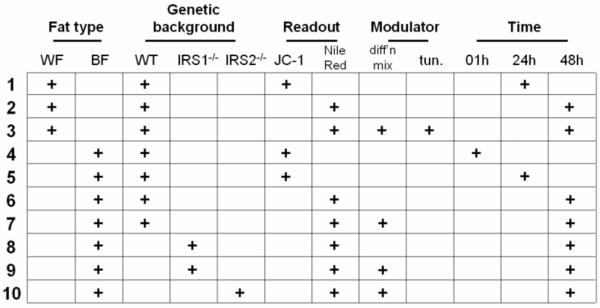
We initially tested a subset of these disaccharides for general effects such as cell viability and cellular metabolism (Supplementary Figure S1). While none of the compounds was overtly cytotoxic, a few compounds caused an increase in mitochondrial membrane potential (ΔΨm), measured by JC-1 dye22,23, in murine preadipocytes. The maintenance of ΔΨm is essential for cellular ATP synthesis. One possible cause of an increased ΔΨm is enhanced oxidative metabolism of benefit to the organism; for example, an increase in ΔΨm is strongly correlated with glucose-induced insulin secretion in pancreatic beta cells24. Because mitochondrial biogenesis occurs during adipocyte differentiation in these cells25, we reasoned that compounds that affect mitochondrial function in preadipocytes might also affect the differentiation process itself. We had previously developed a plate-reader assay for the differentiation of pre-adipocytes to mature adipocyte cells, measured by staining lipid droplets with the fluorescent dye Nile Red26-28. To characterize the full 64-compound collection, we focused on these two readouts (Figure 4) in white preadipocytes and brown preadipocytes isolated from different murine genetic backgrounds29-31. We treated cells in duplicate with eight concentrations of each compound, ranging from 20μM to 6.3nM, for a total of ten parallel cell-biological assays (Figure 5).
Figure 4. Cell-based assays using disaccharide library.
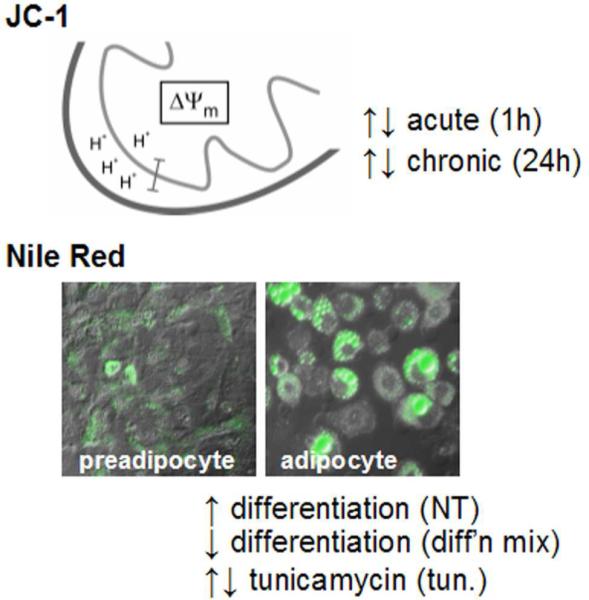
Schematic depicting the proton gradient established in the mitochondrial inner membrane, resulting in a membrane potential (ΔΨm) measured by JC-1 fluorescence, and example of adipocyte differentiation measured by Nile Red staining (green fluorescence). Each image is an overlay of differential interference contrast and green fluorescence (480nm/530nm) channels. Assays were performed to identify compounds that increase differentiation (NT), decrease differentiation (diff'n mix), or modulate the effects of the differentiation inhibitor tunicamycin (tun.).
Figure 5. Enumeration of cell-based assays.
Matrix depicting the cell-based assays performed in either white preadipocytes (WF) or brown preadipocytes (BF) from wild-type mice (WT), insulin receptor substrate-1 knockout mice (IRS1-/-), or insulin receptor substrate-2 knockout mice (IRS2-/-). Nomenclature for readouts is the same as in Figure 4, and other assay conditions are as indicated.
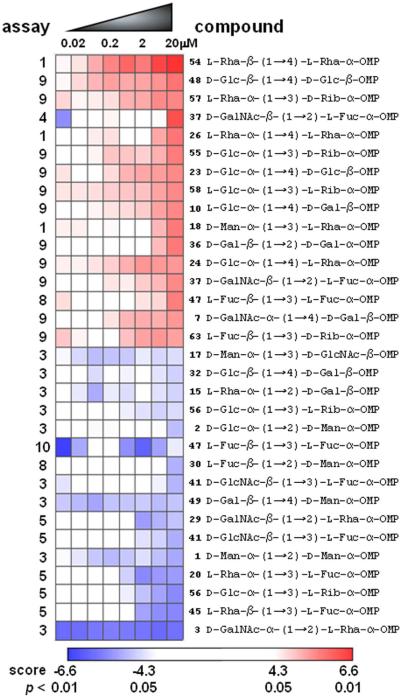
Assay data were first scored as described for high-throughput screening data in ChemBank32. We transformed these initial scores to p-values representing confidence in signal (relative to mock-treated cells) to determine the top-performing compounds, as judged by the greatest concentration-dependent change (increase or decrease) in signal amplitude (Figure 6). The biological effects of some top-scoring compounds were verified individually. The observations of dose-dependent effects and assay-specific activities increased our confidence that the observed activities are compound-induced outcomes. For example, compounds 54, 26, and 18 demonstrated dose-dependent increases in signal in assay 1, and these activities were confirmed in follow-up experiments at the highest concentrations tested (Supplementary Figure S2). These values compare favorably to previous reports; for example, 1mM oleate treatment33 or a combination of 100nM H2O2 and 100μM GDP34 both increase the mitochondrial membrane potential in 3T3-L1 adipocytes. While we are interested in individual compound performances in these cells, in this study we chose to focus on methods to link stereochemical features with patterns of performance among these primary assay results. Further biological testing of individual compound effects will be described in the future.
Figure 6. Analysis of dose-dependent compound effects.
Heat map of assay results, focusing on the 32 most-active compounds as judged by relative dose-dependent increase (top 16) or decrease (bottom 16) of normalized assay signal. Assays are numbered on the left according to the numbering scheme in Figure 5. Heat-map data are expressed as signed log(p) values based on ChemBank scores32, with the color scheme indicated; compound ranks were determined by the dose-dependent (left-to-right) slope, using a moving average of signed log(p) values (see Methods).
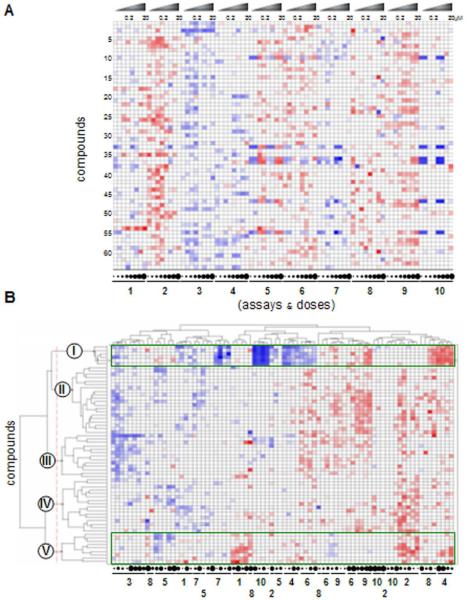
We sought to identify stereochemical features that explain the observed patterns of biological performance across all assays. For this analysis, we represented the measurements made for each compound as an 80-dimensional vector comprising variation in both concentration and assay identity. This dataset (Figure 7A) contains the same scores as the full set of dose-responses (exemplified in Figure 6), but arranged into a single vector of measurements across all assays (a biological performance profile for each compound). To detect relationships between these profiles, we performed hierarchical clustering and applied a threshold to group small molecules into discrete clusters representing distinct biological performance patterns (Figure 7B), at least some of which contain structures closely related in stereochemistry among their members (Figure 8). This analysis also affords the complete matrix of pairwise similarities in biological performance among all 64 compounds (Figure 9).
Figure 7. Analysis of compound similarity based on assay performance.
(A) Primary cell-state and dose-response measurements (“performance profiles”) of 64 disaccharides tested at 8 concentrations in 10 assays; compounds (rows) are presented in the order enumerated in Table 1, and dose-responses are presented for each assay in the order enumerated in Figure 5. Rows represent concatenation of 10 different dose-responses for each compound, such as those presented in Figure 6. Compound concentrations are alternatively represented by circles beneath the heat-map, with increasing size corresponding to increasing concentration, at the dilutions indicated. (B) Unsupervised hierarchical clustering of 80-dimensional performance profiles for all 64 compounds. The five biological clusters, resulting from an inter-cluster similarity cutoff of 0.25, are represented by Roman numerals, while assay identities and concentrations are depicted below the heat-map with the same scheme as in Figure 5. Color scheme for signed log(p) values is the same as in Figure 6. This visualization represents the same data as in (A), but with an alternative row and column order resulting from the hierarchical clustering.
Figure 8. Example compounds with biological performance similarity.
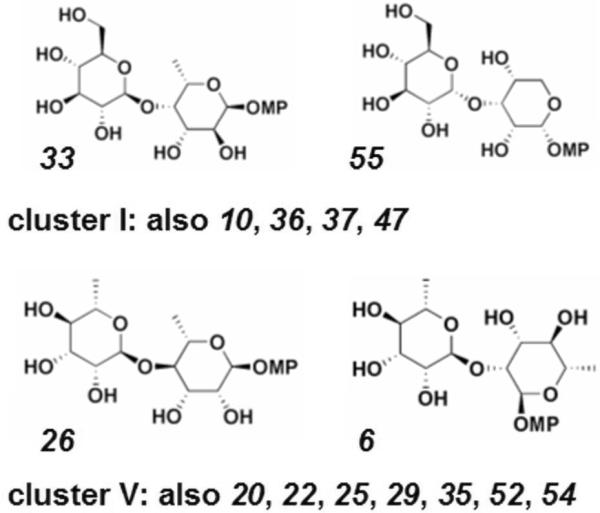
Two most similar chemical structures within cluster I and within cluster V, with remaining cluster members indicated by number (see Table 1).
Figure 9. Analysis of biological similarity.
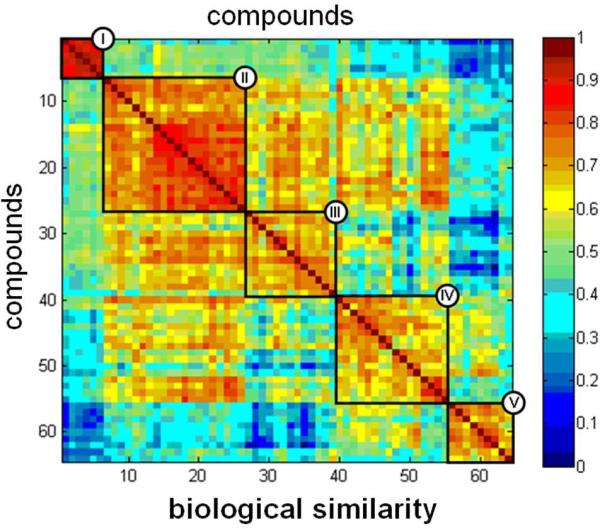
64 × 64 matrix of pairwise biological performance similarities based on correlations (cosine correlation method) between assay profiles. Each element (i,j) in this matrix represents the similarity between the ith row and the jth row of Figure 7B. Similarity values were scaled to the range [0,1] and displayed using the color legend shown. Compound identities are listed in the same order as in Figure 7B, with clusters indicated by Roman numerals; thus, the numbers along the horizontal and vertical axes represent the row number from Figure 7B, rather than the compound identifiers from Table 1.
As a preliminary attempt to uncover relationships between stereochemistry and biological profiles, we examined the members of the two most active clusters (Figure 7B and 9; clusters I and V). We observed an enrichment in cluster V for disaccharides containing rhamnose at either monomer position (all but one member contains rhamnose), at the expense of disaccharides containing rhamnose in cluster I (no members contain rhamnose). We established the significance of this observation by chi-squared hypothesis testing against expectations resulting from a random distribution of rhamnose-containing disaccharides across all five clusters (p < 0.009).
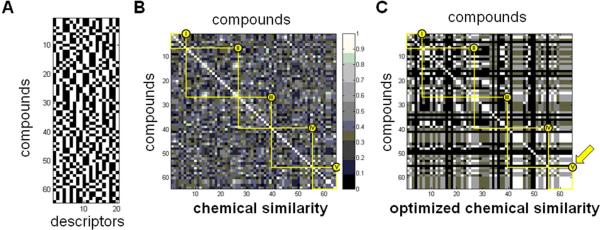
To refine the relationship between biological performance and stereochemistry, we created stereochemical descriptors for the disaccharide library that encode individual stereocenters contained within the monomer building blocks, rather than simply considering monomer identities. We represented these descriptors as a 20-dimensional binary fingerprint of features (Figure 10A; see also Supplementary Figure S3) for each disaccharide, with bits representing the (L-/D-) chirality of the sugar monomers (4 bits), the anomeric bond configurations (4 bits), and the relative stereochemistry of each additional stereocenter in the molecule (12 bits).
Figure 10. Illustration of optimization to identify subsets of stereochemical features linked to biological performance similarity.
(A) 64 × 20 matrix displaying a 20-feature “binary fingerprint” for each disaccharide, with bits representing the (L-/D-) chirality of the sugar monomers, the anomeric bond configurations, and the relative stereochemistry of each additional stereocenter in the molecule. Compound identities are listed in the same order as in Figure 7B; thus, the numbers along the vertical axis represent the row number from Figure 7B, rather than the compound identifiers from Table 1. (B) Pairwise structure similarity using the complete set of 20 binary descriptors; compound identities are in the same order as Figure 7B; thus, the numbers along the horizontal and vertical axes represent the row number from Figure 7B, rather than the compound identifiers from Table 1. Each element (i,j) in this matrix represents the similarity between the ith row and the jth row of (A), as defined by the Tanimoto coefficient between fingerprint vectors (rows) in (A). (C) 64 × 64 similarity matrix of optimized pairwise structure similarity, using a 3-bit representation selected by focusing on cluster V (see text); thus, each element is constructed as in (B), but using only a subset of the columns of (A) for the Tanimoto calculation. Compound identities and grayscale are the same as in (B).
To explain similarities and differences among biological performance profiles (Figure 7B or 9) using these stereochemical descriptors, we designed and implemented an optimization algorithm to identify stereochemical features important in determining similarity of biological performance. Analyzing pairwise stereochemical similarity using these 20-dimensional descriptors results in a pairwise similarity matrix (Figure 10B), where each element is defined by the Tanimoto coefficient35-37 for chemical similarity using the two 20-dimensional fingerprints for that pair of compounds.
Starting with this description of stereochemical features, we performed an optimization focused on biological cluster V. We considered two distributions of stereochemical similarities: those between pairs of library members both within cluster V, and those between pairs of library members, at least one of which is not in cluster V. We sought a subset of the 20 stereochemical features that maximized the difference between these distributions (Figure 10C). In other words, we picked a subset of the 20 features as a candidate description of relevant stereochemistry, and computed stereochemical similarity using only this subset of the 20 bits as the chemical “fingerprint” of each library member. We scored the candidate description by how well it distinguished similarities among cluster V members from other similarities. Our optimization then sought to add or remove stereochemical features, one at a time, to improve this score.
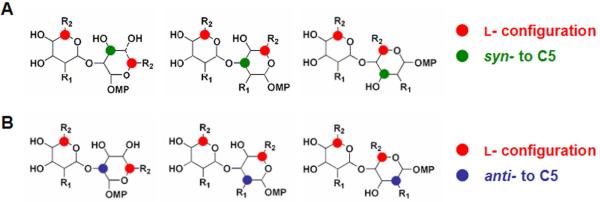
By focusing on individual stereocenters, rather than arbitrary monomer building blocks, we identified a set of stereochemical features enriched (p < 7.6 × 10⁻¹⁵; see Methods) among the members of biological cluster V (Figure 11A). Specifically, we identified that the syn configuration of substituents at C3 and C5 of the acceptor monomer is present in all members of cluster V. Additionally, the absolute configuration of C5 in both donor and acceptor monomers was enriched for the L-configuration; every member of biological cluster V contains an L-sugar monomer, and two-thirds of the members are LL-disaccharides. To understand the role of individual stereocenters in explaining differences in biological performance among library members, we performed a similar optimization seeking a subset of the 20 stereochemical features that maximized intra-cluster similarities (“signal”) for multiple biological clusters simultaneously, while minimizing inter-cluster similarities (“noise”). When we considered the most-active clusters (I and V) together, we identified a second subset of features that best explain (p < 0.007; see Methods) similarities within both of these clusters and the differences between their memberships (Figure 11B). Scoring candidate stereochemical descriptions in this way allows biological data to reveal which combinations of stereocenters might explain similarities and differences in biological performance.
Figure 11. Stereochemical features corresponding with specific questions about biological performance similarity.
(A) Stereochemical features corresponding to the subset of features used to compute the similarity matrix in Figure 10C. (B) Stereochemical features corresponding to a second optimization (see text) treating both clusters I and V simultaneously to find features important both to similarities within these clusters and to differences between them.
Discussion
Carbohydrates provide access to shape diversity. They are rigid and allow control over even distant relative substituent orientations by exercising synthetic control over stereochemical diversity among monosaccharide subunits. We have shown that systematic synthesis and biological testing of collections of disaccharides can identify compounds with specific, dose-dependent cellular activities. Conventional wisdom holds that disaccharides will have little activity due either to cell impermeability or to metabolism as nutrient sources13. In contrast, we observed multiple dose-dependent effects in a small collection of assays, suggesting that some of these compounds may have other activities as well. Ongoing screening activities with these compounds in our laboratories will determine whether this proves to be the case.
That rhamnose-containing compounds appear to have more similarity between biological activities in this set of assays is of potential clinical interest; test subjects who consumed L-rhamnose for four weeks experienced a significant reduction in serum triglyceride levels38. Further, L-rhamnose-rich polysaccharides have been shown to have proliferation-inducing effects on human skin fibroblasts39. L-Rhamnose was originally thought to be an inert sugar, though recent studies have suggested that it is indeed metabolized in vivo40. These results and observations should encourage future consideration of disaccharides as candidate compounds for cell-biological assays directed at probe discovery.
In addition to detecting enrichment at the level of individual monomer identities (e.g., rhamnose), we can refine this description to individual stereocenters by identifying enrichments among subsets of stereochemical features that nature has embedded in the monomers. Such a mapping between stereochemical features and biological performance similarity can readily form the basis for hypothesis generation. For example, our 64 library compounds were selected as a subset of a 540-member “virtual library” of molecules (Supplementary Table T2) we thought were accessible using our chemistry. Based on the foregoing analysis and a desire for more compounds that behave like those in cluster V, we could choose from the remaining prospective members to synthesize only LL-disaccharides with the syn configuration of C3 in acceptor sugars, of which there are only 22 examples (4.6%) among the 476 remaining compounds. Had we applied such a rule prospectively to the compounds we did synthesize, we would have made only 14 of our 64 compounds, of which 6 (42.9%) would have exhibited the pattern of biological performance corresponding to cluster V. This example illustrates the improvements in synthetic efficiency that might be achieved by testing in multiple assays relatively small subsets of larger prospective libraries before investing in the larger library synthesis effort. Importantly, this is just one illustration of the type of question to which our overall approach allows access. Each observed pattern of biological activity could form the basis for an optimization to find a relevant subset of stereochemical features, and compounds from each pair of patterns could yield information about the determinants of differences between their memberships. While it is unlikely that each test would result in a statistically significant set of features, the fact that such questions can be asked (and significance tested) in an automated and systematic fashion is an important step toward informing synthetic decision-making with biological performance data.
We have shown that, by testing compounds in even a small and focused set of cell-biological assays, we can find statistically significant enrichments in structural features among members with similar biological performance, even within a relatively small disaccharide library. We concede that our studies do not provide any causal link between specific stereocenters and biological performance, and certainly provide no mechanistic information about the action of these molecules. Nevertheless, the correlations we observe can be used as guidelines to improve the efficiency of future library synthesis relative to desired biological outcomes or the diversity of such outcomes. The difficulty of synthesizing large numbers of disaccharides, and the barriers to high-throughput split-and-pool methods, meant that we were required to find alternative ways to restrict the scope of stereochemical space. Our solution was to probe widely and shallowly; we reduced the complexity of carbohydrate chemistry by synthesizing and testing one or two representatives of each subset comprising our combinatorial definition of the glycosidic bond (Figure 1A). As a result, we minimized the synthetic effort while attempting to maximize the biological information obtained. In spite of this design, our initial finding that monomer identities were enriched or depleted among compounds sharing biological activity patterns was fortuitous. Many fewer monomers (10) were used than subsets in our glycosidic bond definition (48), so many library members from different subsets shared monomer constituents, allowing us to assess the statistical significance of enrichment.
Our use of disaccharides was particularly well-suited to address questions about the importance of stereochemical features. The library members are effectively identical in chemical composition, differing primarily in stereochemistry. We were thus able to focus purely on stereochemical diversity, uncontaminated by considerations such as molecular weight or appendage diversity. While this focus on disaccharides allowed us to simplify the structural representation of the molecules considerably, it also perforce limited the application of our precise findings to disaccharides, and to the assays under consideration, but our analysis methods can readily be generalized to other sets of compounds and assays. To make this approach more generally useful, our future work will focus on discovering the substructure features systematically from a collection of structures, allowing patterns of activity to be predicted for any prospective small molecule. Moreover, the limited size of the library in the present work made impractical an independent “test set” of compounds to validate choices of stereochemical descriptors resulting from optimization, but future applications of the methods (e.g., in mining databases of high-throughput screening data) could readily include this important step. Similarly, we acknowledge that we limited our choice of assays by our initial observations with candidate disaccharides, and that our choice to resolve the biological assay data into five patterns of activity was arbitrary. Work currently underway will address the multiple possibilities for this choice explicitly, with the aim of finding significant enrichments in structural features at multiple levels of resolution of biological performance patterns. Nevertheless, this study provides a clear path forward for thinking about how biological activity patterns can be used to identify responsible chemical substructure features.
In summary, we have described a generalizable method for taking primary data from multiple cell-biological assays of a small-molecule library and determining structural features enriched in compounds sharing a pattern of biological activities. These results have implications for the recommendation of particular subsets of structures for resynthesis and second-generation library design, a highly sought-after ability when considering compound collections for high-throughput screening activities. If it were feasible to synthesize or select only small numbers of representatives from many defined areas of “chemical space”, a minimal number of compounds could be sufficient in initial screening experiments. Subsequent syntheses and biological assays could then be chosen to test specific hypotheses emerging from this data-analysis approach.
Methods
Chemistry
Compound characterization is provided in the Supplementary Information, including all library compounds and examples for key monosaccharide building blocks and intermediates. Unless stated otherwise, all reactions were performed under an argon atmosphere using dry, deoxygenated solvents either distilled or passed through an activated alumina column under argon. All other commercially obtained reagents were used without purification, unless otherwise noted. Reactions were monitored by thin-layer chromatography (TLC) using silica gel 60 F254 precoated plates (250 μm thickness, Sorbent Technologies). Flash chromatography was carried out on silica gel (particle size 40-75 μm, 60Å porosity, Sorbent Technologies). NMR spectra were obtained from a Varian Inova 500 (500 MHz for 1H, 125 MHz for 13C) or a Varian Inova 600 (600 MHz for 1H) or a Bruker DMX500 (125 MHz for 13C). Proton chemical shifts are reported in parts per million (ppm) with solvent residual peaks (D2O: 4.79 ppm, CD3OD: 3.31 ppm) as internal standards. Carbon chemical shifts are reported in ppm with solvent residual peak (CD3OD: 49.0 ppm) as an internal standard. Coupling constants (J) are given in hertz (Hz) and the abbreviations s, d, t, q, br and m refer to singlet, doublet, triplet, quartet, broad and multiplet, respectively. All assignments were made based on 1H-1H correlation spectroscopy (COSY), heteronuclear single quantum coherence (HSQC), selective 1D total correlation spectroscopy (TOCSY), and gradient-enhanced 1D nuclear Overhauser enhancement (nOe) methods. Low-resolution mass spectra (LRMS) were obtained on an Agilent Technologies LC/MSD instrument using electrospray ionization (ESI).
Cell culture
3T3-L1 preadipocytes (ATCC; Manassas, VA) were grown in Dulbecco's Modified Eagle's Medium (DMEM, Mediatech; Herndon, VA) supplemented with 10% donor calf serum and antibiotics (100 μg/mL penicillin/streptomycin mix) in a humidified atmosphere at 37C with 5% CO2. Immortalized brown preadipocytes were cultured similarly, in media containing 10% fetal bovine serum.
Cell-based assays
For all assays, 5,000 cells were seeded per well of black 384-well optical bottom plates (Nunc; Rochester, NY) at 50μL/well. The following day, 100nL compound was pin-transferred in duplicate into fresh media with a steel pin array, using the CyBi-Well robot (CyBio; Woburn, MA). In order to increase the number of mock-treated wells included in the control distribution, we pin-transferred DMSO vehicle to every well of an additional, parallel assay plate. All assay measurements were performed using the EnVision plate reader (PerkinElmer; Waltham, MA).
JC-1 mitochondrial membrane potential assay
Upon depolarization, the dye is converted from a diffuse green form to red fluorescent J-aggregates22,23. The ratio of red to green fluorescence serves as a readout of the mitochondrial membrane potential. After either a 1-h (acute) or 24-h (long-term) incubation with compound, media was aspirated from plates, and 20μL/well 3.25μM JC-1 (Molecular Probes; Invitrogen Corp.; Carlsbad, CA) in phenol red-free media was added. Plates were incubated for 2h at 37C and washed three times with 50μL/well PBS. Fluorescence was measured, first at ex/em 530nm/580nm (“red”), followed by ex/em 485nm/530nm (“green”).
Nile Red adipocyte differentiation assay
Upon differentiation, cells accumulate intracellular lipid droplets, which can be stained due to their hydrophobic properties. After 48-h incubation with compound, cells were washed once with PBS, stained for 1h at room temperature with 1μM Nile Red in PBS, washed once with PBS, and fluorescence measured at 485nm/530nm.
Data analysis
ChemBank scores reflecting compound performance as compared to a mock-treated (DMSO) distribution were calculated as described32, and reflect background subtraction and normalization based on assay noise, which is represented by a distribution of vehicle-control wells. We converted these scores to p-values using a conservative estimate of confidence for unimodal distributions41, then negative-logarithm-transformed the p-values to reflect orders of confidence. We applied a negative algebraic sign to those values in the low-signal tail of the distribution of vehicle-control measurements, to give signed log(p) values as the scores for each well, with negative values representing significant decreases in signal and positive values representing significant increases in signal. Dose-dependent effects were identified using a three-point moving average of scores along the concentration axis and compounds were rank-ordered by the slope of the relationships between concentration and these averaged values; each concentration extreme was counted twice in calculating the average values of the endpoints. Our optimization method begins by choosing at random a subset of stereochemical features to include in a pairwise stereochemical similarity calculation. This candidate design is evaluated using a quantitative metric to distinguish the distance distributions, either the K-S statistic or a signal-to-noise measure, as described in the text. Next, a single stereochemical feature is either added or removed (again randomly), and the new candidate design tested; if the new design receives a better score than the previous design, the change is kept, otherwise, it is discarded before trying a new change in the design. Iteration proceeds until no candidate change results in further improvements to the scoring metric. Multiple applications of this procedure result in a set of candidate designs each representing the “local” best score for that set of iterations, and from this list a winning design is selected with the best overall score. Hierarchical clustering visualization was performed in Spotfire DecisionSite (Spotfire, Inc.; Somerville, MA). Distance calculations and all optimizations were performed in MATLAB (The Mathworks, Inc.; Natick, MA).
Supplementary Material
Acknowledgements
The authors thank Stephanie Norton, Jason Burbank, and Nicky Tolliday for assistance with performing biological assays, and Nicole Bodycombe, Hyman Carrinski, Joshua Gilbert, and J. Anthony Wilson for helpful discussions about computational methods. Immortalized brown preadipocytes were generously provided by Yu-Hua Tseng and C. Ronald Kahn. Tony Stapon provided monomer precursors for library synthesis. This work was supported by the Broad Institute Center of Excellence in Chemical Methodology and Library Development (P50-GM069721) and the Broad Institute Exploratory Center for Cheminformatics Research (P20-HG003895). I.C.J. was supported by the Broad Institute's Summer Research Program in Genomics.
Footnotes
Supplementary Information Additional details of the synthetic methods and compound characterization, the cell-biological and cheminformatic data, a description of the source code organization, and supplementary Figures and Tables are provided as Supplementary Information; the source code itself is available on request.
References
- (1).Schreiber SL. Bioorg Med Chem. 1998;6:1127–52. doi: 10.1016/s0968-0896(98)00126-6. [DOI] [PubMed] [Google Scholar]
- (2).Schreiber SL. Chem. & Eng. News. 2003;81:51–61. [Google Scholar]
- (3).Burke MD, Schreiber SL. Angew Chem Int Ed Engl. 2004;43:46–58. doi: 10.1002/anie.200300626. [DOI] [PubMed] [Google Scholar]
- (4).Kumagai N, Muncipinto G, Schreiber SL. Angew Chem Int Ed Engl. 2006;45:3635–8. doi: 10.1002/anie.200600497. [DOI] [PubMed] [Google Scholar]
- (5).Spiegel DA, Schroeder FC, Duvall JR, Schreiber SL. J Am Chem Soc. 2006;128:14766–7. doi: 10.1021/ja065724a. [DOI] [PubMed] [Google Scholar]
- (6).Luo T, Schreiber SL. Angew Chem Int Ed Engl. 2007;46:8250–3. doi: 10.1002/anie.200703276. [DOI] [PMC free article] [PubMed] [Google Scholar]
- (7).Nielsen TE, Schreiber SL. Angew Chem Int Ed Engl. 2008;47:48–56. doi: 10.1002/anie.200703073. [DOI] [PMC free article] [PubMed] [Google Scholar]
- (8).Kim YK, Arai MA, Arai T, Lamenzo JO, Dean EF, 3rd, Patterson N, Clemons PA, Schreiber SL. J Am Chem Soc. 2004;126:14740–5. doi: 10.1021/ja048170p. [DOI] [PubMed] [Google Scholar]
- (9).Kossiakoff AA, Hynes T, Devos A. Biochem Soc Trans. 1993;21:614–618. doi: 10.1042/bst0210614. [DOI] [PubMed] [Google Scholar]
- (10).Vermeulen NPE, te Koppele JM. In: Drug stereochemistry: Analytical Methods and Pharmacology. 2nd ed. Wainer IW, editor. M. Dekker; New York: 1993. pp. 245–280. [Google Scholar]
- (11).Kumazawa S, Kanda M, Utagawa M, Chiba N, Ohtani H, Mikawa T. J Antibiot (Tokyo) 2003;56:652–4. doi: 10.7164/antibiotics.56.652. [DOI] [PubMed] [Google Scholar]
- (12).Hutt AJ. Drug Metabol Drug Interact. 2007;22:79–112. doi: 10.1515/dmdi.2007.22.2-3.79. [DOI] [PubMed] [Google Scholar]
- (13).Matsumoto Y, Ohsako M, Sakata R. Chem Pharm Bull (Tokyo) 1991;39:1346–8. doi: 10.1248/cpb.39.1346. [DOI] [PubMed] [Google Scholar]
- (14).Aspinall GO. Annu Rev Biochem. 1962;31:79–102. doi: 10.1146/annurev.bi.31.070162.000455. [DOI] [PubMed] [Google Scholar]
- (15).Lemieux RU, Lineback R. Annu Rev Biochem. 1963;32:155–84. doi: 10.1146/annurev.bi.32.070163.001103. [DOI] [PubMed] [Google Scholar]
- (16).Painter TJ. Carbohydrate Polymers. 1982;4:244–246. [Google Scholar]
- (17).Juaristi E, Cuevas G. Tetrahedron. 1992;48:5019–5087. [Google Scholar]
- (18).Perrin CL. Tetrahedron. 1995;51:11901–11935. [Google Scholar]
- (19).Box VGS. Heterocycles. 1998;48:2389–2417. [Google Scholar]
- (20).Kahne D, Walker S, Cheng Y, Vanengen D. J Am Chem Soc. 1989;111:6881–6882. [Google Scholar]
- (21).Liang R, Yan L, Loebach J, Ge M, Uozumi Y, Sekanina K, Horan N, Gildersleeve J, Thompson C, Smith A, Biswas K, Still WC, Kahne D. Science. 1996;274:1520–2. doi: 10.1126/science.274.5292.1520. [DOI] [PubMed] [Google Scholar]
- (22).Smiley ST, Reers M, Mottola-Hartshorn C, Lin M, Chen A, Smith TW, Steele GD, Jr., Chen LB. Proc Natl Acad Sci U S A. 1991;88:3671–5. doi: 10.1073/pnas.88.9.3671. [DOI] [PMC free article] [PubMed] [Google Scholar]
- (23).Reers M, Smiley ST, Mottola-Hartshorn C, Chen A, Lin M, Chen LB. Methods Enzymol. 1995;260:406–17. doi: 10.1016/0076-6879(95)60154-6. [DOI] [PubMed] [Google Scholar]
- (24).Maechler P, Kennedy ED, Pozzan T, Wollheim CB. Embo J. 1997;16:3833–41. doi: 10.1093/emboj/16.13.3833. [DOI] [PMC free article] [PubMed] [Google Scholar]
- (25).Wilson-Fritch L, Burkart A, Bell G, Mendelson K, Leszyk J, Nicoloro S, Czech M, Corvera S. Mol Cell Biol. 2003;23:1085–94. doi: 10.1128/MCB.23.3.1085-1094.2003. [DOI] [PMC free article] [PubMed] [Google Scholar]
- (26).Greenspan P, Mayer EP, Fowler SD. J Cell Biol. 1985;100:965–73. doi: 10.1083/jcb.100.3.965. [DOI] [PMC free article] [PubMed] [Google Scholar]
- (27).Fukumoto S, Fujimoto T. Histochem Cell Biol. 2002;118:423–8. doi: 10.1007/s00418-002-0462-7. [DOI] [PubMed] [Google Scholar]
- (28).Wang SM, Hwang RD, Greenberg AS, Yeo HL. Histochem Cell Biol. 2003;120:285–92. doi: 10.1007/s00418-003-0575-7. [DOI] [PubMed] [Google Scholar]
- (29).Fasshauer M, Klein J, Ueki K, Kriauciunas KM, Benito M, White MF, Kahn CR. J Biol Chem. 2000;275:25494–501. doi: 10.1074/jbc.M004046200. [DOI] [PubMed] [Google Scholar]
- (30).Fasshauer M, Klein J, Kriauciunas KM, Ueki K, Benito M, Kahn CR. Mol Cell Biol. 2001;21:319–29. doi: 10.1128/MCB.21.1.319-329.2001. [DOI] [PMC free article] [PubMed] [Google Scholar]
- (31).Klein J, Fasshauer M, Klein HH, Benito M, Kahn CR. Bioessays. 2002;24:382–8. doi: 10.1002/bies.10058. [DOI] [PubMed] [Google Scholar]
- (32).Seiler KP, George GA, Happ MP, Bodycombe NE, Carrinski HA, Norton S, Brudz S, Sullivan JP, Muhlich J, Serrano M, Ferraiolo P, Tolliday NJ, Schreiber SL, Clemons PA. Nucleic Acids Res. 2008;36:D351–9. doi: 10.1093/nar/gkm843. [DOI] [PMC free article] [PubMed] [Google Scholar]
- (33).Guo W, Lei T, Wang T, Corkey BE, Han J. J Nutr. 2003;133:2512–8. doi: 10.1093/jn/133.8.2512. [DOI] [PubMed] [Google Scholar]
- (34).Sun X, Zemel MB. Obesity (Silver Spring) 2007;15:1944–53. doi: 10.1038/oby.2007.232. [DOI] [PubMed] [Google Scholar]
- (35).Tanimoto TT. IBM Internal Report. 1957 Nov 17; [Google Scholar]
- (36).Willett P, Barnard JM, Downs GM. J. Chem. Inf. Comput. Sci. 1998;38:983–996. [Google Scholar]
- (37).Willett P. Curr Opin Biotechnol. 2000;11:85–8. doi: 10.1016/s0958-1669(99)00059-2. [DOI] [PubMed] [Google Scholar]
- (38).Vogt JA, Ishii-Schrade KB, Pencharz PB, Jones PJ, Wolever TM. J Nutr. 2006;136:2160–6. doi: 10.1093/jn/136.8.2160. [DOI] [PubMed] [Google Scholar]
- (39).Ravelojaona V, Molinari J, Robert L. Biomed Pharmacother. 2006;60:359–62. doi: 10.1016/j.biopha.2006.06.019. [DOI] [PubMed] [Google Scholar]
- (40).Malagon I, Onkenhout W, Klok M, van der Poel PF, Bovill JG, Hazekamp MG. J Pediatr Gastroenterol Nutr. 2006;43:265–6. doi: 10.1097/01.mpg.0000226379.41365.62. [DOI] [PubMed] [Google Scholar]
- (41).Vysochanskii DF, Petunin YI. Theory of Probability and Mathematical Statistics. 1980;21:25–36. [Google Scholar]
Associated Data
This section collects any data citations, data availability statements, or supplementary materials included in this article.


