Abstract
Motivation: Most genotyping technologies for single nucleotide polymorphism (SNP) markers use standard clustering methods to ‘call’ the SNP genotypes. These methods are not always optimal in distinguishing the genotype clusters of a SNP because they do not take advantage of specific features of the genotype calling problem. In particular, when family data are available, pedigree information is ignored. Furthermore, prior information about the distribution of the measurements for each cluster can be used to choose an appropriate model-based clustering method and can significantly improve the genotype calls. One special genotyping problem that has never been discussed in the literature is that of genotyping of trisomic individuals, such as individuals with Down syndrome. Calling trisomic genotypes is a more complicated problem, and the addition of external information becomes very important.
Results: In this article, we discuss the impact of incorporating external information into clustering algorithms to call the genotypes for both disomic and trisomic data. We also propose two new methods to call genotypes using family data. One is a modification of the K-means method and uses the pedigree information by updating all members of a family together. The other is a likelihood-based method that combines the Gaussian or beta-mixture model with pedigree information. We compare the performance of these two methods and some other existing methods using simulation studies. We also compare the performance of these methods on a real dataset generated by the Illumina platform (www.illumina.com).
Availability: The R code for the family-based genotype calling methods (SNPCaller) is available to be downloaded from the following website: http://watson.hgen.pitt.edu/register.
Contact: liny@upmc.edu
Supplementary information: Supplementary data are available at Bioinformatics online.
1 INTRODUCTION
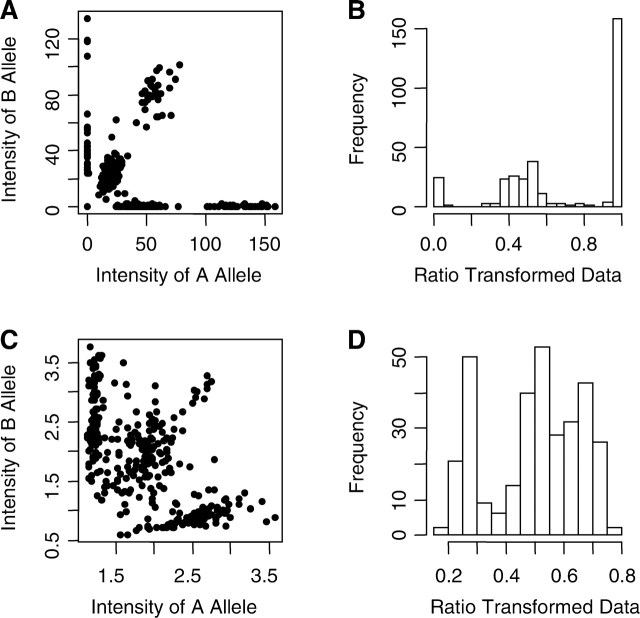
Single nucleotide polymorphisms (SNPs) are DNA sequence variations that occur when a single nucleotide (A, T, C or G) in the genome sequence is altered. They are becoming the most popular type of marker in linkage and association studies to discover genes relevant to diseases. The vast majority of SNPs are biallelic. Consider a SNP marker with alleles A and B. There are three possible genotypes for a disomic individual, AA, AB and BB. Many low- and high-throughput technologies have been developed to genotype the SNPs efficiently, including the GeneChip Human Mapping Array from Affymetrix, the Illumina platform, the Sequenom platform, the Taqman platform and the Invader assay. Each platform uses a different technology, and they give somewhat different forms of data. In general, they all give certain quantitative measures of allelic abundance for the two alleles, yA and yB. The abundance measures can either be scalars or vectors. Individuals with genotype AA are expected to have high yA value and low yB value. The opposite is expected for individuals with genotype BB. Those with genotype AB are expected to have similar yA and yB values. Figure 1A gives an example of data generated for a SNP marker using the Illumina platform. Each dot on the plot represents one individual. In SNP genotyping, we seek to identify genotype clusters based on these measurements and ‘call’ each person's genotype by assigning them to a cluster. Normally, we expect to find three clusters, but if one allele is rare in the population, a particular dataset might only have two clusters (genotypes). Once genotypes are called, they are used in the analysis of linkage and genetic association studies. It is well established that genotyping errors can cause significant problems in both family-based and case-control type of genetic studies (Clayton et al., 2005; Gordon and Finch, 2005; Pompanon et al., 2005). It can lead to either an increased type I error (Clayton et al., 2005; Gordon et al., 2001; Moskvina et al., 2006) or a decreased power (Gordon et al., 2002; Mote and Anderson, 1965).
Fig. 1.
Plots of two-dimensional (A, C) and transformed one-dimensional (B, D) data produced by different genotyping experiments. (A) and (B): genomic DNA, Illumina data. (C) and (D): whole-genome amplified DNA, Taqman data.
Different platforms generate data of different dimension. For example, the Affymetrix SNP array generates high-dimensional raw data in which each SNP is assessed by several probe pairs. The Illumina platform generates data of two dimensions. For platforms that produce high-dimensional data, the data are typically reduced to two dimensions (Fig. 1A and C) or to one dimension (Fig. 1B and D) before the genotype calling procedure is initiated. The method of reduction is platform-specific. To reduce the data generated by the Illumina platform from two dimensions to one dimension, we used the following formula: (raw intensity of allele B)/(raw intensity of allele A + intensity raw intensity of allele B). The second dimension is the distance from the origin. This dimension primarily contains information on data quality, and it is common to exclude data points that are close to the origin prior to genotype calling.
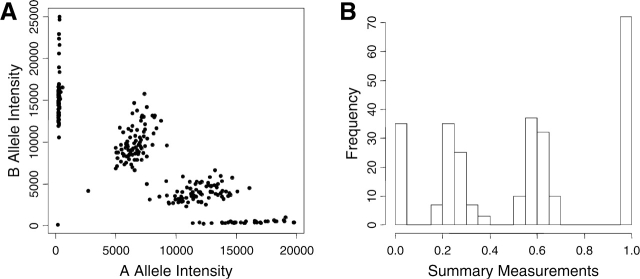
Genotypes are typically assigned (‘called’) from raw data using clustering methods. If the clusters are well defined (as is the case for data shown in Fig. 1A and B), most clustering methods work well. But if the clusters are less well defined (as is the case for data shown in Fig. 1C and D, in which the DNA was prepared using genomic amplification from a small amount of template), it is much harder to determine the genotypes. However, there are several features of the genotyping problem that could potentially facilitate the process. First, the number of clusters is limited (to one, two or three for standard disomic data). Second, the distribution of the data points is typically known from previous use of the technology. The distribution is platform-specific and depends on the data quality and the transformation used. For example, the homozygote clusters of the Illumina sample shown in Figure 1B are skewed, while all three genotype clusters for the genome-amplified Taqman sample shown in Figure 1D are fairly symmetric. In general, however, in the datasets we have seen, the heterozygote cluster almost always has higher variation than the homozygote clusters (Fig. 1). Third, when family data are used, constraints on the genotypes are known because the transmission of alleles from parents to offspring must follow Mendelian rules. Proper use of these various types of prior knowledge can greatly increase the accuracy of the genotype calls. One somewhat non-standard genotyping problem is that of genotyping trisomic individuals—those with an extra copy of one of the chromosomes. Trisomic genotype calling has not been discussed in any published literature to date that we are aware of. Trisomic individuals have four possible genotypes for a biallelic marker AAA, AAB, ABB and BBB. This makes the genotype calling procedure more difficult, since the two heterozygous groups can be close together (Fig. 2A and B). It is not clear which, if any, standard genotyping methods have the ability to distinguish the two heterozygous genotype clusters. However, when family data are available, we typically know which parent donated one copy of the chromosome (i.e. which parent is the correctly disjoining parent, or CDJP), which parent is the source of the extra chromosome (the non-disjoining parent, or NDJP) and whether the NDJP gave the child two different chromosomes (not reduced to homozygosity) or two identical chromosomes (reduced to homozygosity) at the location of that SNP (Xu et al., 2004). Our simulation results show that by incorporating this family information into the genotyping methods, we can significantly improve the genotype calls in trisomic data.
Fig. 2.
Plots of two-dimensional (A) and transformed one-dimensional (B) Illumina data of trisomic individuals.
Both supervised and unsupervised methods have been used for genotype calling. If training datasets are available, a supervised clustering algorithm can be used (Liu et al., 2003; Rabbee and Speed, 2006). However, training datasets are usually not available. If they are unavailable, genotype calling requires an unsupervised clustering algorithm, such as the K-means clustering algorithm (Hartigan and Wong, 1979) or the dynamic model (DM)-based algorithm, which is an ad hoc method developed for the Affymetrix 100K array (Di et al., 2005). The K-means algorithm can provide satisfactory results when the clusters are reasonably separated, but it is not always effective, especially when the clusters have different variances (Fujisawa et al., 2004). Although the DM algorithm is generally accurate, it exhibits higher error rates for heterozygous bases than for homozygous bases (Rabbee and Speed, 2006).
To improve the genotype calls made by this algorithm, several newer methods have been developed (e.g. BRLMM—Affymetrix, 2006; CRLMM—Carvalho et al., 2007) for high-dimensional Affymetrix data. The genotype calling using empirical likelihood (GEL) algorithm (Nicolae et al., 2006) and the multi-array multi-SNP (MAMS) algorithm (Xiao et al., 2007) are two other genotyping technologies developed specifically for Affymetrix GeneChip data.
Mixture models are also popular approaches to the genotyping problem. Fujisawa et al. (2004) proposed a Gaussian-mixture model for data generated with the Invader assay. Unlike the K-means clustering algorithm that requires investigators to know the number of clusters beforehand, this model uses a penalized likelihood method to select the number of clusters. More importantly, unlike the K-means clustering algorithm, which assumes equal variances for all clusters (Celeux and Govaert, 1992), the Gaussian-mixture model estimates variances for each cluster separately. Because different genotype clusters usually have dramatically different variances, the Gaussian-mixture model appears to be better suited for genotyping. For similar reasons, Teo et al. (2007) used a mixture of truncated t-distributions with higher degrees of freedom for the heterozygote group, though the degrees of freedom are specified ahead of time rather than estimated from the data.
All of the methods described above are designed for independent samples. When family data are available, the Mendelian constraints on the genotype can play an important role in genotype calling. Sabatti and Lange (2008) developed a method for family data collected for linkage studies. They combined a Gaussian-mixture penetrance model with the pedigree likelihood and they used the empirical Bayesian method so that information across all SNPs could be borrowed in parameter estimation. The general idea of this method could be applied to any platform. However, they developed this method for the high-dimensional data of the Affymetrix GeneChip Human Mapping Array. In addition, this method is designed for data collected from linkage studies, and makes assumptions about allele and genotype frequencies [e.g. Hardy–Weinberg Equilibrium (HWE)] that may not be appropriate for all applications.
Many of the methods discussed above were developed for standard ‘clean’ data of different genotyping platforms. However, not all data are clean or of good quality. When DNA is amplified prior to genotyping, clusters will often be less well defined. Furthermore, in a typical genome-wide study, many SNPs are thrown out because the clusters are poor. In general that does not cause problems, because there are so many SNPs on a genome-wide panel, but it is not uncommon to find that one of these ‘questionable’ SNPs lies close to a significant association result, in which case it may be desirable to take a more aggressive approach to calling the genotypes for that SNP. In this article, we illustrate that genotype calling can be improved by taking better advantage of external information, such as prior information about cluster distributions and family genotype constraints, particularly when the data quality is low. Specifically, we propose two family-based genotype calling methods, and we apply our methods to both simulated and real data. We also discuss the problem of genotyping of trisomic individuals as a special example of how to use external information to improve genotype calls. We demonstrate our methods on a real dataset consisting of genotypes of 160 parent/child trios in which the child is trisomic for chromosome 21 (Down syndrome). The data were generated by the Illumina platform (Shen et al., 2005, www.illumina.com). Subjects were recruited from the Down Syndrome Clinic at Kennedy Kreiger Institute in Baltimore, Maryland, as described in detail by Kerstann et al. (2004). Additional subjects were from the Atlanta, Georgia, metropolitan area and were recruited from Sibley Heart Center Cardiology, which is part of Children's Healthcare of Atlanta.
2 METHODS
2.1 K-means methods for trio data
The K-means clustering algorithm (Hartigan and Wong, 1979) is a popular, unsupervised clustering method that is fast, straightforward and fairly effective. Here, we propose to modify the K-means algorithm so that family information can be used to improve the accuracy of the genotypes called in trios. Basically, we consider all the genotype combinations of a family trio that agree with Mendelian rules (Table 1), and we calculate the sum of the distance of each family member to the center of the corresponding genotype cluster. At each iteration step, we update the genotypes of all three family members based on this sum. We refer to our modified method as the trio K-means method. Details of this method for disomic and trisomic data are provided in the Supplementary Material 1 and 3, respectively.
Table 1.
Fifteen family types of a SNP marker for a nu-clear family with one disomic offspring
| Family type | Parent 1 | Parent 2 | Child |
|---|---|---|---|
| 1 | AA | AA | AA |
| 2 | AA | AB | AA |
| 3 | AB | ||
| 4 | AA | BB | AB |
| 5 | AB | AA | AA |
| 6 | AB | ||
| 7 | AB | AB | AA |
| 8 | AB | ||
| 9 | BB | ||
| 10 | AB | BB | AB |
| 11 | BB | ||
| 12 | BB | AA | AB |
| 13 | BB | AA | AB |
| 14 | BB | ||
| 15 | BB | BB | BB |
2.2 Model-based methods for trio data
To incorporate the pedigree information into the model-based clustering methods, we propose a genotype-calling method that combines the pedigree likelihood and a parametric mixture-model approach. This method is easily applicable to pedigrees of almost any size and configuration. Our likelihood is similar to that of Sabatti and Lange (2008), but we do not use it in a Bayesian context, so we do not make any assumptions about allele or genotype frequencies. Moreover, we work only with one-dimensional data, so our likelihood is applicable to data from any platform.
2.2.1 Likelihood
Let y be the observed one-dimensional value for an individual. We assume the following parametric penetrance model:
| (1) |
where λ ∈ Λ = {AA, AB, BB}, and ξλ is the parameter vector for genotype λ. f(ξλ) could be any parametric model that fits the data well. In this article, we illustrate the use of the Gaussian-mixture model and the beta-mixture model. We will refer these two methods as the trio Gaussian-mixture model and the trio beta-mixture model, respectively. Let Yi = (yfi, ymi, yki) be the observed data for the father, mother and child of the i-th trio. Let Gi = (gfi, gmi, gki)be the corresponding genotype vector. First, let us assume that we can observe the genotype vector. Then the likelihood for the i-th trio is:
 |
(2) |
where θ = (pλ′s, ξλ′s)T.
If we have a total of n trios, the full likelihood is
| (3) |
2.2.2 Genotype determination using Bayes rule
If the parameters are known, then we can determine the genotypes of all three members of a family using Bayes’ rule. The posterior probability of the family genotype vector Gi = (gfi, gmi, gki) given the observed values Yi = (yfi, ymi, yki) is
| (4) |
where
and
 |
In this case, gfi, gmi and gki are the genotypes of the father, mother and child for the j-th family type listed in Table 1.
2.2.3 Estimation method
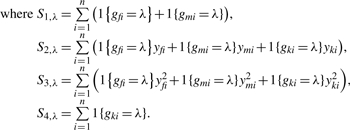
If the Gaussian-mixture model is assumed for the penetrance term of the model, p(y|g = λ), a convenient expectation maximization (EM) algorithm can be constructed to estimate the parameters. Here the parameter vector is
The update algorithm is:
 |
 |
If we assume a beta-mixture model for the penetrance term, the parameter vector becomes θ = (pλ′s, αλ′s, βλ′s)T. We can still use the same update algorithm for pλ. For the estimation of αλ′s and βλ′s we use the nlm package in R to maximize the E(log(L(Y, θ))) at the M-step. The nlm algorithm converges fairly quickly; however, it is sensitive to the initial values. In our case, we started with some initial calls (by K-means or some other simple methods) to facilitate the procedure of selecting initial values.
2.2.4 Determination of the cluster number
Fujisawa et al. (2004) proposed a Gaussian-mixture approach in combination with the penalized likelihood for genotype calling of SNP array data. Their approach performs well in selecting of the number of clusters. Here, we took advantage of the fact that the number of clusters is limited and that the number of configurations for missing clusters is also limited (e.g. we do not expect to have a missing middle cluster). We modified the EM algorithm so that when pλ(t) is smaller than a preset small number x, we can consider the cluster empty from step t and up.
2.2.5 Extension to trisomic data
To apply similar model-based methods to trisomic trio data, we need to rewrite the likelihood. The overall likelihood is quite similar to the likelihood function shown above. Denote the parent that contributes two chromosomes as the NDJP and the parent that contributes one chromosome as the CDJP. Denote the genotypes of the NJPD, CJPD and child as gNi, gCi and gki respectively and yNi, yCi and yki as the corresponding values observed. The likelihood for the i-th trio is
 |
(5) |
In the disomic model, the transmission probability Pr(gk|gf, gm) is 1, 0.5, 0.25 or 0 according to Mendelian rules. In the trisomic model, the transmission probability Pr(gk|gN, gC) is a function of the population genotype frequencies and of whether the two alleles from the NDJP are reduced to homozygosity (i.e. whether they are replicates of the same allele of the NDJP). The model for these probabilities is described in Xu et al. (2004), and briefly in the Supplementary Material 2. In addition to considering the three genotypes for disomic individuals (the parents), we also need to consider four additional genotype clusters for trisomic individuals (the offspring). That is, we need to consider two mixture models at the same time. Further details of the genotype-calling methods for trisomic trios and the estimation procedures are included in the Supplementary Material 4.
3 RESULTS
3.1 Simulation studies
We conducted two simulation studies to compare the performance of our methods and other related clustering algorithms. We simulated disomic trio data in one study, and we simulated trisomic trio data in the other. For each study, we simulated 1000 datasets, each consisting of 150 trios. We used a beta distribution in simulating the observations in different genotype groups because our previous experience indicated that the distribution of the homozygote clusters is highly skewed in several platforms, including the Illumina platform.
3.1.1 Simulation studies of disomic trios
In this simulation study, the parents and children were all disomic, and the datasets that we simulated represented poor-quality data. We applied six different clustering methods to the datasets. Three family-based methods treated the family trio as a group and are therefore referred to as ‘trio’ methods: the trio K-means clustering method, the trio Gaussian-mixture model and the trio beta-mixture model. In contrast, three corresponding methods treated each member of the family trio independently: the K-means clustering method, the regular Gaussian-mixture model and the regular beta-mixture model.
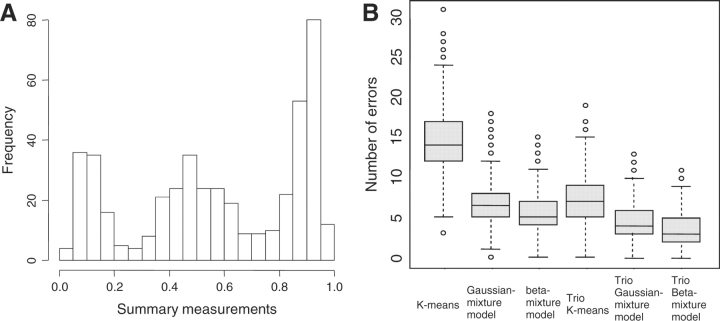
Figure 3A provides an example of a simulated dataset, and Figure 3B provides an example of the simulation results (for detailed results, see Supplementary Material 5). As expected, when the data were of poor quality, the methods that incorporated the family information consistently performed better than their counterpart methods that ignored the family information. On average, there were one-third to one-half fewer errors when the family information was used in the genotype calling process. In general, we would expect model-based methods to perform better than the K-means related methods, since the model-based methods allow different variances to be estimated for each genotype cluster. In this simulation study, data for the homozygous clusters were less skewed than the good-quality data shown in Figure 1B. Nevertheless, the beta-mixture models still performed better than the Gaussian-mixture models. The use of a beta-mixture model as the penetrance term in the likelihood therefore seems to be more appropriate. It may in some sense seem obvious that the beta-mixture model would perform better, since we used the beta distribution to generate our data. However, to our knowledge, the beta-mixture model has not been used previously for clustering of genotype data, despite the fact that most genotyping technologies produce skewed intensity distributions for homozygotes.
Fig. 3.
Disomic Simulation Study. (A) Histogram of an example of simulated data.(B) Boxplots of the simulation results.
In this study, we also found that the K-means methods had a higher error rate in heterozygotes than in homozygotes (that is, they had a greater tendency to categorize true heterozygotes as homozygotes). The Gaussian-mixture models had a higher error rate in homozygotes than in heterozygotes. In contrast, the beta-mixture models had similar error rates in heterozygotes and homozygotes (see the Supplementary Material 5). We saw a similar pattern in the analysis of a real dataset generated by the Illumina platform (data not shown).
3.1.2 Simulation studies of trisomic trios
In this simulation study, the parents were disomic and the children were trisomic. To apply the K-means clustering method and the beta-mixture model to trisomic trio data, we needed to separate the dataset into two subsets, one for the disomic parents and the other for the trisomic offspring. Because we simulated data that represented typical trisomic data that we had seen in the Down syndrome study (Kerstann et al., 2004), the homozygous genotype clusters were fairly skewed. Therefore, we omitted the Gaussian-mixture model from our trisomic simulation study and compared the remaining four methods: the trio K-means clustering method, the trio beta-mixture model, the regular K-means clustering method and the regular beta-mixture model.
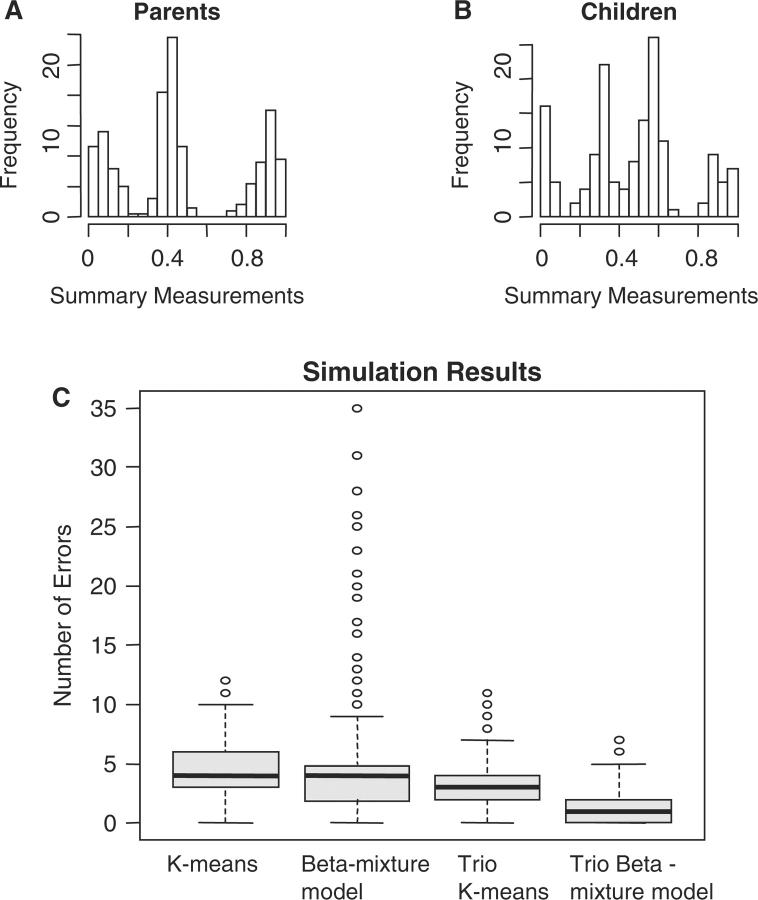
Figure 4A and B provides examples of simulated datasets for disomic parents and trisomic offspring, and Figure 4C provides boxplots of the simulation results (for detailed results, see the Supplementary Material 6). As in the study of disomic trios, the genotype calls were improved when the family information was incorporated and the variance structure was controlled. However, in the study of trisomic trios, the family information appeared to make a larger contribution to the genotype-calling procedure than did the control of the variance structure. This was especially obvious when the results of the two model-based methods were compared. We found that, on average, there were two-thirds fewer errors when the trio beta-mixture model was used than when the regular beta-mixture model was used. There were one-third fewer errors when the trio K-means method was used than when the regular K-means method was used. We also found that the performance of the regular beta-mixture model was quite unstable. Although it performed better on average than the K-means method, there were numerous cases in which it made more errors than the K-means method. The trio beta-mixture model, on the other hand, was much more stable (Figure 4C).
Fig. 4.
Trisomic Simulation Study. (A) and (B) Histogram of an example of simulated data. (C) Boxplots of the simulation results.
3.2 Real data example
We applied the regular K-means clustering algorithm, the regular beta-mixture model, and their corresponding family-based methods, the trio K-means algorithm and the trio beta-mixture model to a real dataset generated by the Down sydrome study. The subjects were genotyped using the BeadStation from Illumina Inc., San Diego, California, USA (www.illumina.com). Data points that were very close to the origin were considered failed reactions. These subjects were not included in the analysis.
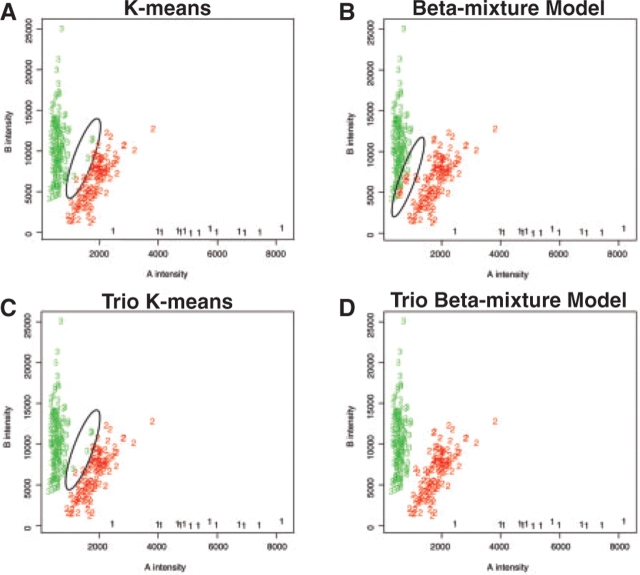
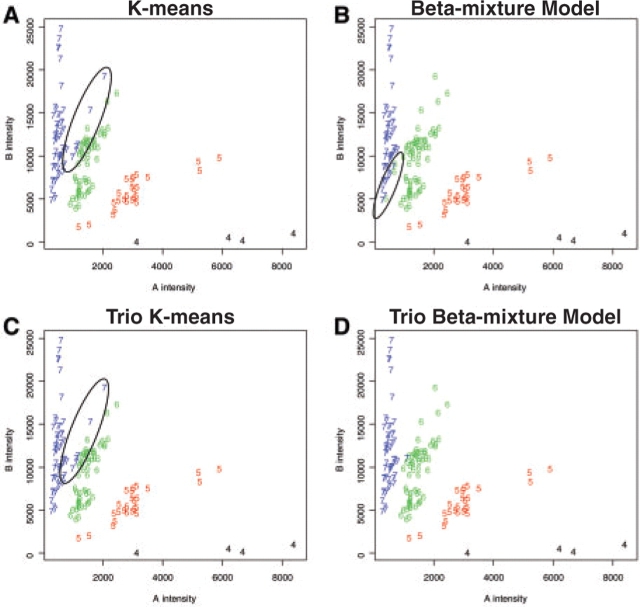
Figures 5 and 6 show the reconstructed two-dimensional results of one SNP for parents and children, respectively. In these figures, the presumed misclassified individuals are circled. Because the variances for the heterozygote clusters are much larger than those for the homozygote clusters, the K-means methods tend to mistakenly assign some of the heterozygotes to the homozygote genotype cluster (Figs 5A, 5C, 6A and C). The impact of family information is obvious when we compare the results of the regular beta-mixture model and those of the trio beta-mixture model (Figs 5B, 5D, 6B and 6D). Our simulation study showed that the performance of the regular beta-mixture model was not stable. In our real data example, the regular beta-mixture model fails the task of distinguishing the heterozygous and the homozygous individuals with relatively low intensities. The trio beta-mixture model, on the other hand, appears to yield the most reasonable results (Figs 5D and 6D).
Fig. 5.
Reconstructed clustering results for parents in the real dataset. Genotype cluster 1 = AA genotype group, genotype cluster 2 = AB genotype group, genotype cluster 3 = BB genotype group. The apparently misclassified individuals are circled.
Fig. 6.
Reconstructed clustering results for children in the real dataset. Genotype cluster 4 = AAA genotype group, genotype cluster 5 = AAB genotype group, genotype cluster 6 = ABB genotype group, genotype cluster 7 = BBB genotype group. The apparently misclassified individuals are circled.
There is no gold standard for the genotypes called for this data. However, in our experience calling 219 SNPs in this dataset, for 206 SNPs, family-based calling changed 1 or fewer calls. But for 13 SNPs, clusters were not even correctly identified using independent calls, and only family-based calls generated acceptable data.
4 DISCUSSION
The goal of this article is to show that we can use some specific features of the genotyping problem to improve clustering methods for making genotype calls from SNP array data, particularly when the data quality is low. The specific features we discussed in this article include: (i) differences in the variance structures and shapes of the distributions for different genotype clusters; (ii) constraints on genotype calls based on family structure; and (iii) limits on the number of clusters. We also proposed two new genotype calling methods for family data (demonstrated for trios). We studied the performance of the various methods by simulation. We also compared the results of these methods on a real dataset. We found that, when the data quality is low, those methods that use additional information improved the genotype calls significantly. When the quality of the data is good, most methods can give satisfactory results, though improvement is still possible (Supplementary Material 5). We also showed that our methods can be used to obtain high-quality genotype calls for trisomic individuals, and that the addition of the external information is particularly important for that application. We demonstrated our methods only on trios and not extended families, but our trio-mixture models can be easily extended to incorporate larger pedigrees or individuals not in families. However, the trio K-means method, though very simple and straightforward, cannot be extended to handle larger family data.
Our results emphasize four points. First, since the variances in the heterozygous genotype clusters are typically much bigger than those in the homozygous genotype clusters, it is important to control for the variance structure. This makes the model-based methods (beta-mixture model and Gaussian-mixture model) superior to the K-means methods, in general. Second, the shapes of the clusters for different genotype groups are often dramatically different. For example, the distributions of heterozygous genotype clusters tend to be symmetric, while those of homozygous genotype clusters tend to be skewed for many or even most genotyping technologies. Therefore, the beta-mixture model seems to fit the data better than the Gaussian-mixture model does. Third, when pedigree information is available, its inclusion in clustering techniques can substantially reduce errors in genotype calling. This is particularly true if the data quality is poor or if the dataset involves trisomic subjects. Fourth, the impact of family information is greater in trisomic data than in disomic data, since there are more genotype constraints affecting trisomic trios.
In our study, we used data from the Illumina platform. We found that the beta-mixture model fit this data better than the Gaussian-mixture model did, since the homozygote clusters were skewed. We also found that the Gaussian-mixture model-assigned heterozygous genotypes to some of the homozygous individuals. These findings might not necessarily be true for other platforms. As was illustrated in Figure 1, the two-dimensional and one-dimensional plots of the data in Figure 1A and B were quite different from those of data in Figure 1C and D. Both different platforms and different methods of DNA preparation can have an impact on the quality and shape of the data. Unlike the Illumina data shown in Figure 1A and B, the Taqman data shown in Figure 1C and D were prepared using whole-genome amplification. In the whole-genome amplified dataset, the distributions of all three genotype clusters are flatter and more symmetric. The Gaussian-mixture model appeared to be a better fit for this dataset (data not shown).
An important issue to keep in mind while using our family-based (trio) approaches is that they force all genotypes to follow Mendelian inheritance rules within each family. But genetic studies often have a few errors in reported family structure, most often due to sample swaps, non-paternity or unreported adoption. If the genotypes are called using a family-based method without first finding these family structure errors, there will be two problems. The most obvious problem is that some genotypes will be mis-called. The other problem, however, is that there will be outliers in the clusters, which may distort all of the estimation. For example, suppose a true AB is called as AA in order to enforce Mendelian rules. Then the AA cluster will include a point that may be far beyond its natural boundaries, which will affect both mean and variance estimates for that cluster and thus potentially affect other genotype calls. We recommend that genotype calling be done first with non-family-based methods in order to identify families with an excess of non-Mendelian calls. Then the family-based methods can be applied after the reasons for the non-Mendelian calls have been identified. Another way to deal with this problem (for the model-based methods only) is to examine the posterior probabilities of the genotype calls and set up a no-call cutoff value. This solution should also help maintain the stability of the genotype calls if there are true technical outliers (e.g. a true AA point that falls in the AB cluster because of pure technical aberration).
Genotyping of trisomic individuals is more complicated than genotyping of disomic individuals. To date, we are the first group who addresses this problem formally. The unique family structure of the trisomic trios makes the family-based models more suitable for the task. Our results showed that by incorporating the family structure, we not only improved but also stablized the performance of the likelihood-based clustering method.
As a final note, we would like to suggest (Sabatti and Lange, 2008) that using posterior probabilities of genotypes rather than absolute genotype calls might improve almost all statistical genetic analyses. The model-based methods that we have proposed here are of course easily adaptable to generate such probabilistic data.
Funding
This work was supported by NIH R01 MH067234 (to Y.L., E.F.), NIH R01 HB02374 (to E.F.), NIH P01 HD24605 (to L.J.H.B., S.L.S.), NIH R01 HD38979 (to L.J.H.B., S.L.S., E.F., S.C.), NIH R01 HL08330 (to S.L.S., E.F.), F32 HD046337 (to L.J.H.B.), Children's Healthcare of Atlanta Cardiac Research Committee (to L.J.H.B.), CRC US DHS NIH MO1 RR00039 (to L.J.H.B., S.L.S.), NIH KL2 RR024154-03 (G.C.T) and by the technical assistance of the General Clinical Research Center at Emory University (NIH/NCRR M01 RR00039). Illumina genotyping data were produced through an Early Career Investigator Award from the Seattle SNPs Program for Genomic Applications (PGA) supported by U01 HL66682 from the National Heart, Lung, and Blood Institute (to L.J.H.B.).
Conflict of Interest: none declared.
Supplementary Material
REFERENCES
- Affymetrix . Technical Report. Santa Clara, California: Affymetrix, Inc.; 2006. BLMM: an improved genotype calling method for the GeneChip Human Mapping 500K Array Set. White Paper. [Google Scholar]
- Celeux G, Govaert G. A classification EM algorithm for clustering and two stochastic versions. Comput. Stat. Data Anal. 1992;14:315–332. [Google Scholar]
- Carvalho B, et al. Exploration normalization and genotype calls of high density oligonucleotide SNP array data. Biostatistics. 2007;8:485–499. doi: 10.1093/biostatistics/kxl042. [DOI] [PubMed] [Google Scholar]
- Clayton DG, et al. Population structure, differential bias and genomic control in a large-scale, case-control association study. Nat. Genet. 2005;37:1243–1246. doi: 10.1038/ng1653. [DOI] [PubMed] [Google Scholar]
- Di X, et al. Dynamic model-based algorithms for screening and genotyping over 100K SNPs on oligonucleotide microarrays. Bioinformatics. 2005;21:1958–1963. doi: 10.1093/bioinformatics/bti275. [DOI] [PubMed] [Google Scholar]
- Fujisawa H, et al. Genotyping of single nucleotide polymorphism using model-based clustering. Bioinformatics. 2004;20:718–726. doi: 10.1093/bioinformatics/btg475. [DOI] [PubMed] [Google Scholar]
- Gordon D, Finch SJ. Factors affecting statistical power in the detection of genetic association. J. Clin. Invest. 2005;115:1408–1418. doi: 10.1172/JCI24756. [DOI] [PMC free article] [PubMed] [Google Scholar]
- Gordon D, et al. A transmission/disequilibrium test that allows for genotyping errors in the analysis of single-nucleotide polymorphism data. Am. J. Hum. Genet. 2001;69:371–380. doi: 10.1086/321981. [DOI] [PMC free article] [PubMed] [Google Scholar]
- Gordon D, et al. Power and sample size calculation for case-control genetic association tests when errors are present: application to single nucleotide polymorphisms. Hum. Hered. 2002;54:22–23. doi: 10.1159/000066696. [DOI] [PubMed] [Google Scholar]
- Hartigan JA, Wong MA. A K-means clustering algorithm. Appl. Stat. 1979;28:100–108. [Google Scholar]
- Kerstann KF, et al. Linkage disequilibrium mapping in trisomic populations: analytical approaches and an application to congenital heart defects in Down syndrome. Genet. Epidemiol. 2004;27:240–251. doi: 10.1002/gepi.20019. [DOI] [PubMed] [Google Scholar]
- Liu W, et al. Algorithms for large-scale genotyping microarrays. Bioinformatics. 2003;19:2397–2403. doi: 10.1093/bioinformatics/btg332. [DOI] [PubMed] [Google Scholar]
- Moskvina V, et al. Effect of differential genotyping error rate on the type I error probability of case-control studies. Hum. Hered. 2006;61:55–64. doi: 10.1159/000092553. [DOI] [PubMed] [Google Scholar]
- Mote VL, Anderson RL. An investigation of the effect of misclassification on the properties of χ2-tests in the analysis of categorical data. Biometrika. 1965;52:95–109. [PubMed] [Google Scholar]
- Nicolae DL, et al. GEL: a novel genotyping calling algorithm using empirical likelihood. Bioinformatics. 2006;22:1942–1947. doi: 10.1093/bioinformatics/btl341. [DOI] [PubMed] [Google Scholar]
- Pompanon F, et al. Genotyping errors: causes, consequences and solutions. Nat. Rev. Genet. 2005;6:847–859. doi: 10.1038/nrg1707. [DOI] [PubMed] [Google Scholar]
- Rabbee N, Speed TP. A genotype calling algorithm for Affymetrix SNP arrays. Bioinformatics. 2006;22:7–12. doi: 10.1093/bioinformatics/bti741. [DOI] [PubMed] [Google Scholar]
- Sabatti C, Lange K. Bayesian Gaussian mixture models for high density genotyping arrays. JASA. 2008;103:89–100. doi: 10.1198/016214507000000338.. [DOI] [PMC free article] [PubMed] [Google Scholar]
- Shen R, et al. High-throughput SNP genotyping on universal bead arrays. Mutation Res. 2005;573:70–82. doi: 10.1016/j.mrfmmm.2004.07.022. [DOI] [PubMed] [Google Scholar]
- Teo YY, et al. A genotype calling algorithm for the Illumina BeadArray platform. Bioinformatics. 2007;23:2741–2746. doi: 10.1093/bioinformatics/btm443. [DOI] [PMC free article] [PubMed] [Google Scholar]
- Xiao Y, et al. A multi-array multi-SNP genotyping algorithm for Affymetrix SNP microarrays. Bioinformatics. 2007;23:1459–1467. doi: 10.1093/bioinformatics/btm131. [DOI] [PubMed] [Google Scholar]
- Xu Z, et al. A trisomic transmission disequilibrium test. Genet. Epidemiol. 2004;26:125–131. doi: 10.1002/gepi.10302. [DOI] [PubMed] [Google Scholar]
Associated Data
This section collects any data citations, data availability statements, or supplementary materials included in this article.


