

Abstract
The emergence of antibiotic resistance in Mycobacterium tuberculosis has raised the concern that pathogen strains that are virtually untreatable may become widespread. The acquisition of resistance to antibiotics results in a longer duration of infection in a host, but this resistance may come at a cost through a decreased transmission rate. This raises the question of whether the overall fitness of drug-resistant strains is higher than that of sensitive strains—essential information for predicting the spread of the disease. Here, we directly estimate the transmission cost of drug resistance, the rate at which resistance evolves, and the relative fitness of resistant strains. These estimates are made by using explicit models of the transmission and evolution of sensitive and resistant strains of M. tuberculosis, using approximate Bayesian computation, and molecular epidemiology data from Cuba, Estonia, and Venezuela. We find that the transmission cost of drug resistance relative to sensitivity can be as low as 10%, that resistance evolves at rates of ≈0.0025–0.02 per case per year, and that the overall fitness of resistant strains is comparable with that of sensitive strains. Furthermore, the contribution of transmission to the spread of drug resistance is very high compared with acquired resistance due to treatment failure (up to 99%). Estimating such parameters directly from in vivo data will be critical to understanding and responding to antibiotic resistance. For instance, projections using our estimates suggest that the prevalence of tuberculosis may decline with successful treatment, but the proportion of cases associated with resistance is likely to increase.
Keywords: antibiotic resistance, approximate Bayesian computation, bacterial evolution, molecular epidemiology, stochastic model
Despite the development of a number of effective treatments over the past half century, tuberculosis remains one of the most destructive bacterial infections in humans. A third of the world's population carries the bacterium, and even though it remains latent in most of these cases, it is responsible for ≈1.6 million deaths each year (1). In addition to this persistent death rate, an increasing number of strains that are resistant to one or several of the available treatments have been observed. Indeed, recent years have seen the emergence of extensively drug-resistant strains (XDR TB), that are resistant to almost all available antibiotic treatments (2). In this article we address the question of whether the overall reproductive fitness of drug-resistant strains is higher than that of sensitive strains −essential information for predicting the spread of the disease (3).
Potentially mitigating the spread of antibiotic resistance is a possible biological cost to fitness associated with drug resistance. Evidence for this cost comes from in vitro competition studies of drug-resistant bacteria (4, 5). For instance, in the case of tuberculosis, the relative growth advantage of drug-resistant strains from clinical isolates has been shown to be between 0.71 and 1.16 in an in vitro competition assay (6). This observation suggests that a typical resistant strain in the epidemiological context may have at most a mild transmission cost. Furthermore, mutations that compensate for the fitness cost may occur in the wild (6). Therefore, the fitness of drug-resistant strains in the epidemiological context could be as high as that of the sensitive strains or even higher (7, 8). Estimates of relative fitness have also been obtained by using odds ratios derived from molecular epidemiological data (9). These estimates indicate a wide range of fitness costs associated with resistance, including the possibility that some resistant strains bear no fitness cost.
With little fitness cost to the resistance phenotype, one expects transmission of resistant strains to be a substantial contributor to the prevalence of drug resistance. This idea is supported by studies showing resistant isolates to be genetically homogeneous in some geographic areas (10, 11). Other studies argue for the importance of acquired resistance given the genetic heterogeneity of resistant isolates in other areas (12), and that serial samples from patients reveal the relatively frequent occurrence of drug resistance mutations (13). The significance of acquired resistance is also supported by the observation that prior treatment is a major risk factor for multidrug-resistant tuberculosis in Europe (14). Because it is difficult to determine the source of resistance for any given case, in practice, cases are categorized as “primary” if patients were never treated or treated for <1 month, and as “acquired” if patients were treated for >1 month (15). This is an imperfect classification for understanding the relative contributions of transmission and the de novo evolution of resistance because the acquired category also includes the possibility of transmitted resistant strains. There is a need to quantify these contributions more carefully.
The emergence of drug-resistant Mycobacterium tuberculosis has been studied through mathematical modeling. Through these models parameters such as detection rates and treatment success rates have been identified as important epidemiological factors (7, 8, 16–19). Mathematical models describing drug resistance dynamics rely on assumptions about the relative fitness of drug-resistant strains, among other factors. Accurate estimates of the underlying parameters are of critical importance to predicting the spread of drug resistance (20).
One approach to measuring the relative fitness of resistant strains is to use molecular epidemiological data that allow classification of isolates into genotypic classes (clusters). The relative fitness of resistant strains compared with that of sensitive strains has thereby been quantified from a comparison of their genetic clustering (9). Such methods are indirect in that the dynamics of tuberculosis transmission, evolution of resistance, and mutation of molecular markers are not explicitly taken into account. By mathematically modeling these stochastic processes simultaneously and applying modern computational Bayesian methods of inference (21), we improve these estimates of the relative fitness. Additionally we estimate the cost to transmission incurred by resistance, the rate of acquisition of drug resistance due to treatment failure, and we quantify the relative contributions of resistance evolution (acquired) versus transmission of resistant strains (primary).
In this study, we estimate these quantities using detailed molecular data from M. tuberculosis strains isolated from Cuba (22), Estonia (10), and Venezuela (23). Inference in a Bayesian framework involves constructing a likelihood function for the observed data by using a stochastic model. The level of realism attained by using the stochastic model we have developed (see Fig. 1) makes it impractical to work with likelihood functions directly. We therefore use a recently proposed form of approximate Bayesian computation (21). This methodology approximates posterior distributions of the parameters by simulating datasets under the model and comparing these with empirical data through a weighting function involving summary statistics.
Fig. 1.

The epidemiological model. As described in Materials and Methods, the number of individuals in each subpopulation of the model changes according to a stochastic linear birth–death process. The parameters are defined as follows: α is the transmission rate per individual per unit time, c is the transmission cost due to resistance, ρ is the rate of evolution of resistance per individual per unit time, τ is the rate of detection (and treatment commencement) per individual per unit time, and εS and εR are the rates of cure due to treatment for sensitive and resistant strains, respectively. The mutation rate of the marker μ and the rate of death or natural recovery δ are not shown in this figure; these occur in every state. Mutation of the marker does not affect the phenotype but gives rise to a new genotype.
Results
The posterior point estimates obtained from the approximate Bayesian computation procedure can be summarized as follows. The transmission cost of resistance is ≈0.1 for the data from Cuba and from Estonia and ≈0.7 for the data from Venezuela. Estimates of the rate of evolution of resistance vary from 0.0025 (Cuba) to 0.020 (Venezuela). Table 1 provides point estimates with credibility intervals of these parameters, and Fig. 2 shows marginal posterior distributions.
Table 1.
Posterior estimates of quantities of interest
| Parameter | Data set | Median | 95% CI |
|---|---|---|---|
| Transmission cost* | Cuba (IS6110) | 0.0935 | (−0.3789, 0.4229) |
| (c) | Cuba (spoligotypes) | 0.1241 | (−0.1636, 0.3888) |
| Estonia (IS6110 ) | 0.0956 | (−0.1096, 0.3514) | |
| Venezuela (spoligotypes) | 0.6999 | (0.2969, 0.9988) | |
| Rate of evolution of resistance† | Cuba (IS6110 ) | 0.0025 | (0.0001, 0.0172) |
| (ρ) | Cuba (spoligotypes) | 0.0052 | (0.0002, 0.0269) |
| Estonia (IS6110) | 0.0116 | (0.0001, 0.0670) | |
| Venezuela (spoligotypes) | 0.0202 | (0.0032, 0.1035) | |
| Relative fitness‡ | Cuba (IS6110) | 1.0418 | (0.7108, 1.5833) |
| (ΦRS) | Cuba (spoligotypes) | 1.0071 | (0.6971, 1.3076) |
| Estonia (IS6110) | 1.0426 | (0.7674, 1.2740) | |
| Venezuela (spoligotypes) | 0.3478 | (0.0013, 0.8095) | |
| Proportion of resistance acquired due to treatment failure | Cuba (IS6110) | 0.0139 | (0.0000, 0.1923) |
| Cuba (spoligotypes) | 0.0270 | (0.0000, 0.2381) | |
| Estonia (IS6110) | 0.0188 | (0.0000, 0.1571) | |
| Venezuela (spoligotypes) | 0.6667 | (0.1857, 1.0000) |
*See also Fig. 1.
†Units for rate of evolution of resistance is per case per year, whereas transmission cost and relative fitness are dimensionless.
‡See Section 1.3 of SI Appendix.
Fig. 2.

Marginal posterior distributions. (A) The transmission cost c. (B) The rate of evolution of resistance ρ. (C) The relative fitness ΦRS of resistant strains compared with sensitive strains. The isolates from Venezuela were genotyped by using spoligotyping (spol.); isolates from Estonia were typed by using IS6110; isolates from Cuba were typed by using both spoligotyping and IS6110-typing. (D) The proportion of resistant cases in the population that arose through treatment failure leading to the evolution of resistance from sensitivity.
Because strain fitness depends on both the transmission rate and the duration of infection, the transmission cost of resistance alone does not capture the overall fitness cost. The fitness of resistant strains relative to sensitive strains gives a measure of the overall advantage (or disadvantage) that resistance confers and can be expressed in terms of the model parameters (Eq. 1). Our results, using stochastic models with epidemiological data, provide statistical evidence that the population-level fitness of drug-resistant tuberculosis could be as high as that of drug-sensitive strains. Our estimates of the relative fitness of drug-resistant strains vary from ≈0.3 in Venezuela to ≈1.0 in Cuba and Estonia (Table 1 and Fig. 2).
We examined the relative contributions of treatment failure and the direct transmission of resistant strains to the ascendance of drug resistance. Our results suggest that direct transmission, rather than evolution after treatment failure, is the major factor responsible for the prevalence of resistant strains, with >90% of resistant cases in Estonia and Cuba attributable to transmission (Fig. 2D).
Projections were computed by using our model, simulating forwards in time by using the posterior parameter distribution. In these projections both moderate cure rates (based on 50% treatment success) and optimistic cure rates [based on the WHO target of 85% treatment success (1)] lead to a decline in the median total number of tuberculosis cases (Fig. 3 A and B). The proportion of these cases that are associated with drug-resistant strains increases (Fig. 3 C and D). The decline in the total cases is sharper under the assumption of higher cure rates, but in each scenario, all cases eventually become associated with resistant strains. Fig. 3 C and D also gives the proportion of simulations that resulted in extinction of tuberculosis. Increased cure rates lead to local eradication with high probability after 60 y.
Fig. 3.

Projection of cases resistant to drugs by simulating the model forwards by using the parameter estimates from the Estonia data. (A and C) Moderate cure rates of εS = 0.52 and εR = 0.202 (50% treatment success). (B and D) Optimistic cure rates of εS = 2.95 and εR = 0.47 (85% treatment success). A and B show the posterior median total number of cases of tuberculosis over time (black lines) and the median number of cases with drug-resistant M. tuberculosis (red lines), starting with the estimated posterior distribution of parameters. C and D show the proportion of cases that are drug resistant (black lines) and the cumulative proportion of simulations that undergo extinction (red lines). In both scenarios, the case detection and treatment rate is τ = 1.21, which corresponds to the WHO target of 70% of cases detected and treated. Solid lines represent median values, and error bars indicate minimum 95% credibility intervals at 10-y intervals.
The methodology used here has heavy computatational demands that constrain the level of realism of the model. However, a cross-validation of our results is possible because the data from Cuba consist of the same isolates typed with two different markers. The shared epidemiological history of these two datasets should produce estimates that differ only in mutation rate. This is broadly what we observe. Indeed, we find that the mutation rate of IS6110 is 5–10 times higher than that of spoligotypes [see supporting information (SI) Appendix], agreeing with previous results (24).
Discussion
This study reveals relatively high fitnesses of resistant strains in Cuba and Estonia. These high values may reflect an inconsistency in treatment programs in these countries from the 1950s to the 1990s. There may have been long periods of ineffective treatment—indeed, Estonia now has one of the highest rates of multidrug resistance in the world (1). The intermittent presence of drugs and the resulting transmission of resistant strains would have given drug-resistant strains collectively more time within untreated hosts. This may have allowed mutations to evolve that compensate for the fitness cost, resulting in higher relative fitness for resistant strains. In contrast, the lower estimate of the fitness of drug-resistant strains in Venezuela is consistent with the early introduction of an effective national tuberculosis-control program (1936) (1) and a steady decrease in tuberculosis prevalence since 1939 (23). These results support previous evidence that circulating strains have lower fitness cost (6), suggesting that resistant strains in regions with ineffective control strategies have higher fitness.
We found a high proportion of drug-resistant cases due to transmission compared with the evolution of resistance due to treatment failure in Estonia and Cuba. For these countries, we confirm the interpretation of (10) and others that transmission of resistant strains is the major contributor to the drug resistance problem. This observation suggests that it may be effective to allocate resources to containing the transmission of resistant strains. The relative contribution of transmission in Venezuela is likely to be lower, although it is still high enough to consider focusing on blocking transmission.
Factors other than drug resistance, including host and bacterial factors, are likely to confer differential fitnesses among strains. Previous work provides a method for detecting differences in transmission rates among different genotypes (25). That study showed, however, that these differences are generally not large and do not occur frequently. Nevertheless a more complex model in conjunction with more detailed data may provide opportunities to further develop our methods to better characterize the dynamics of resistance. For example, stochastic models with multiple states of resistance such as that of (26) can be used to further our understanding of the emergence of multidrug-resistant or extensively drug-resistant tuberculosis.
Accurate estimates of parameters such as the cost of resistance are important for the design of public health measures and predicting epidemiological outcomes. Future prevalence of drug resistance has been intensely debated (3, 7, 18), and projections depend on knowledge of strain fitnesses. Under the modeling assumptions of Cohen and Murray (8), if the cost to fitness is between 0 and 0.1 (our estimates for Estonia and Cuba), then a peak incidence of ≈400–600 infectious tuberculosis cases per 100,000 will occur ≈170–220 years after the introduction of antibiotics (figure 2B of ref. 8). Projections from our stochastic model (Fig. 3), add to this forecast by suggesting that with an increased case detection and treatment probability (1) of 70%, the prevalence of tuberculosis may decline and the disease may even be locally eradicated. However, the proportion of cases associated with resistance will increase (see Fig. 3 and SI Appendix).
We remark that these predictions are likely to be optimistic for two reasons. First, they require consistent and sustained success in detection and treatment over long periods of time. Second, if compensatory mutations occur, the transmission cost would continue to decline, leading to fitter resistant strains and serious epidemiological consequences (27). The design of effective treatment programmes will need to take account of both the magnitude of the fitness cost, as well as its future evolution via compensatory mutation.
Materials and Methods
We briefly present the model and methods here and provide the details in the SI Appendix; see also Table S1, Table S2, Table S3, Table S4, Table S5, and Figs. S1–S3 for additional information. To estimate epidemiological parameters from molecular epidemiological data, we (i) develop a stochastic model of the dynamics of tuberculosis transmission, the evolution of drug resistance, and mutation of genetic markers, and (ii) apply approximate Bayesian computation (ABC) to generate posterior distributions of parameters from empirical data. We analyzed data from population level studies of M. tuberculosis isolates from patients in Cuba (22), Estonia (10), and Venezuela (23). These datasets were identified through a comprehensive examination of a large pool of candidate datasets described in previous work (24). The key criterion for selection of a dataset was that the full distribution of genotypes in the sample along with the drug-resistance status of every isolate was provided. These datasets used standard methods for molecular typing and drug-resistance testing, they were collected over relatively short time periods, and were from regions where information about the time of introduction of antibiotics is available.
The stochastic model extends a previously described birth–death-mutation model (28) by including antibiotic resistance and sensitivity. A population of infectious individuals is divided into several subpopulations (see Fig. 1). This model tracks only infectious cases. Individuals are classified according to whether the strain they are infected with is resistant to at least one antibiotic or not and whether they are undergoing treatment or not. Treated individuals carrying drug-resistant strains are further subdivided according to whether resistance was acquired through treatment failure or through transmission. Individuals move from one subpopulation to another through the acquisition of resistance or the commencement of treatment. They join the system through transmission and leave it through death or recovery. Underlying this model structure is a further classification of individuals according to bacterial genotype.
There are six types of event in this model. Transmission of drug-sensitive strains occurs at a rate of α per case per year. The transmission rate of resistant strains is given a cost c, so that resistant strains transmit at α (1 − c) per case per year. Note that when the parameter c is positive, it describes a transmission cost of resistance, and when it is negative, there is a transmission benefit to resistance. We assume that the cost to transmission c is independent of marker-based genotypes. Untreated cases are detected and commence treatment at a rate of τ per case per year. The rate at which drug-sensitive cases acquire resistance due to treatment failure is ρ per case per year. Treated cases recover due to treatment at a rate of εS per case per year for sensitive strains and εR for resistant strains, with εS > εR. Recovery in the absence of treatment along with death occur at a combined rate of δ per case per year. Mutation at the marker of interest occurs at the rate μ per case per year. The model assumes that each infectious individual carries a single genotype of M. tuberculosis and that the genetic marker is not under selection. The evolution of the molecular marker thus does not influence the transmission dynamics with respect to drug resistance but does allow genetic variation in M. tuberculosis to be tracked. We simulate this process for the purpose of comparison with molecular data. Of the eight parameters in the model, δ, τ, εS, and εR are fixed by using estimates obtained from the literature and the others, α, c, ρ, and μ, are estimated (as shown in Table S1 and discussed in the SI Appendix).
Each simulation of this process begins with a population of 4,000 drug-sensitive infectious cases and allows the population to evolve for 40 y. This duration models the period between the introduction of antibiotics in these countries in the 1950s and the collection of the samples in the 1990s. In each simulation, the distribution of genotypes in the initial infectious population is randomly generated according to the infinite-alleles model (see the SI Appendix for more details). This has the effect of integrating out uncertainty in the initial distribution. The infinite-alleles model has been shown to adequately describe the distribution of M. tuberculosis genotypes into clusters (24).
The relative fitness of drug-resistant strains based on this model can be expressed as
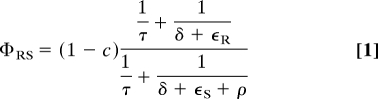 |
as derived in the SI Appendix.
The procedure for Bayesian inference uses the ABC-PRC algorithm proposed in ref. 21. The algorithm generates a weighted sample from an approximation to the true, but intractable, posterior distribution. The approximation is based on the ability of the model to reproduce informative summary quantities of the data by embedding the intractable target posterior within an augmented model from which sampling is viable. The ability to reproduce summary quantities is evaluated through weighted Euclidean distance between simulated and observed summary statistics. We used 11 summary statistics and weighted them according to their sensitivity to variation in model parameter values. These statistics include the number of distinct genotypes, the proportion of isolates that are drug resistant, and a range of other statistics based on the relationship between resistance phenotype and marker genotype. Table S3 describes these statistics and SI Appendix Section 2 provides further details of the estimation procedure.
The future of drug resistance in M. tuberculosis was explored by using the posterior distribution of parameters obtained through the Bayesian methods and simulating forwards in time. For these projections, we assumed that 70% of cases are detected and treated, which is the target set by the WHO (29), corresponding to τ = 1.21. We consider two scenarios: (i) moderate cure rates based on 50% treatment success for sensitive cases (see Table S1), and (ii) an optimistic cure proportion for sensitive cases of 85%, which is again the WHO target (29). These success proportions correspond to cure rates of (i) εS = 0.52 and εR = 0.202 (moderate) and (ii) εS = 2.95 and εR = 0.47 (optimistic).
Supplementary Material
Acknowledgments.
We thank C. Bergstrom and L. Simonsen for discussions; S. Alizon, K. Koelle, and T. Stadler for comments on the manuscript; R. Z. Aandahl for technical computational assistance; and C. Sola, S. Samper, and L. Aristimuño for providing the full dataset from Venezuela. This work was supported by the Australian Research Council under the Discovery Project Scheme (DP0556732 and DP0664970).
Footnotes
The authors declare no conflict of interest.
This article is a PNAS Direct Submission. C.B. is a guest editor invited by the Editorial Board.
This article contains supporting information online at www.pnas.org/cgi/content/full/0902437106/DCSupplemental.
References
- 1.World Health Organization. WHO report 2004. Geneva: WHO; 2004. Anti-tuberculosis drug resistance in the world. Tech Rep (WHO/HTM/TB/2004.343), available at www.who.int/tb/publications/2004/en/index.html. [Google Scholar]
- 2.Cohen J. Infectious disease: Extensively drug-resistant TB gets foothold in South Africa. Science. 2006;313:1554. doi: 10.1126/science.313.5793.1554a. [DOI] [PubMed] [Google Scholar]
- 3.Cohen T, Sommers B, Murray M. The effect of drug resistance on the fitness of Mycobacterium tuberculosis. Lancet Infect Dis. 2003;3:13–21. doi: 10.1016/s1473-3099(03)00483-3. [DOI] [PubMed] [Google Scholar]
- 4.Andersson DI, Levin BR. The biological cost of antibiotic resistance. Curr Opin Microbiol. 1999;2:489–493. doi: 10.1016/s1369-5274(99)00005-3. [DOI] [PubMed] [Google Scholar]
- 5.Sander P, et al. Fitness cost of chromosomal drug resistance-conferring mutations. Antimicrob Agents Chemother. 2002;46:1204–1211. doi: 10.1128/AAC.46.5.1204-1211.2002. [DOI] [PMC free article] [PubMed] [Google Scholar]
- 6.Gagneux S, et al. The competitive cost of antibiotic resistance in Mycobacterium tuberculosis. Science. 2006;312:1944–1946. doi: 10.1126/science.1124410. [DOI] [PubMed] [Google Scholar]
- 7.Blower SM, Chou T. Modeling the emergence of the ‘hot zones’: Tuberculosis and the amplification dynamics of drug resistance. Nat Med. 2004;10:1111–1116. doi: 10.1038/nm1102. [DOI] [PubMed] [Google Scholar]
- 8.Cohen T, Murray M. Modeling epidemics of multidrug-resistant M. tuberculosis of heterogeneous fitness. Nat Med. 2004;10:1117–1121. doi: 10.1038/nm1110. [DOI] [PMC free article] [PubMed] [Google Scholar]
- 9.Dye C, Williams BG, Espinal MA, Raviglione MC. Erasing the world's slow stain: Strategies to beat multidrug-resistant tuberculosis. Science. 2002;295:2042–2046. doi: 10.1126/science.1063814. [DOI] [PubMed] [Google Scholar]
- 10.Kruuner A, et al. Spread of drug-resistant pulmonary tuberculosis in Estonia. J Clin Microbiol. 2001;39:3339–3345. doi: 10.1128/JCM.39.9.3339-3345.2001. [DOI] [PMC free article] [PubMed] [Google Scholar]
- 11.Bifani P, et al. Molecular identification of streptomycin monoresistant Mycobacterium tuberculosis related to multidrug-resistant W strain. Emerg Infect Dis. 2001;7:842–848. doi: 10.3201/eid0705.010512. [DOI] [PMC free article] [PubMed] [Google Scholar]
- 12.Wilson RW, et al. Evidence from molecular fingerprinting of limited spread of drug-resistant tuberculosis in Texas. J Clin Microbiol. 1999;37:3255–3259. doi: 10.1128/jcm.37.10.3255-3259.1999. [DOI] [PMC free article] [PubMed] [Google Scholar]
- 13.Post FA, et al. Genetic polymorphism in Mycobacterium tuberculosis isolates from patients with chronic multidrug-resistant tuberculosis. J Infect Dis. 2004;190:99–106. doi: 10.1086/421501. [DOI] [PubMed] [Google Scholar]
- 14.Faustini A, Hall AJ, Perucci CA. Risk factors for multidrug resistant tuberculosis in Europe: A systematic review. Thorax. 2006;61:158–163. doi: 10.1136/thx.2005.045963. [DOI] [PMC free article] [PubMed] [Google Scholar]
- 15.Mathema B, Kurepina NE, Bifani PJ, Kreiswirth BN. Molecular epidemiology of tuberculosis: Current insights. Clin Microbiol Rev. 2006;19:658–685. doi: 10.1128/CMR.00061-05. [DOI] [PMC free article] [PubMed] [Google Scholar]
- 16.Lipsitch M, Levin BR. Population dynamics of tuberculosis treatment: Mathematical models of the roles of non-compliance and bacterial heterogeneity in the evolution of drug resistance. Int J Tuberc Lung Dis. 1998;2:187–199. [PubMed] [Google Scholar]
- 17.Blower SM, Gerberding JL. Understanding, predicting and controlling the emergence of drug-resistant tuberculosis: A theoretical framework. J Mol Med. 1998;76:624–636. doi: 10.1007/s001090050260. [DOI] [PubMed] [Google Scholar]
- 18.Dye C, Williams BG. Criteria for the control of drug-resistant tuberculosis. Proc Natl Acad Sci USA. 2000;97:8180–8185. doi: 10.1073/pnas.140102797. [DOI] [PMC free article] [PubMed] [Google Scholar]
- 19.Dye C, Espinal MA. Will tuberculosis become resistant to all antibiotics? Proc R Soc London Ser B. 2001;268:45–52. doi: 10.1098/rspb.2000.1328. [DOI] [PMC free article] [PubMed] [Google Scholar]
- 20.Böttger EC, Springer B. Tuberculosis: Drug resistance, fitness, and strategies for global control. Eur J Pediatr. 2008;167:141–148. doi: 10.1007/s00431-007-0606-9. [DOI] [PubMed] [Google Scholar]
- 21.Sisson SA, Fan Y, Tanaka MM. Sequential Monte Carlo without likelihoods. Proc Natl Acad Sci USA. 2007;104:1760–1765. doi: 10.1073/pnas.0908847106. and correction (2009) [DOI] [PMC free article] [PubMed] [Google Scholar]
- 22.Diaz R, et al. Molecular epidemiology of tuberculosis in Cuba outside of Havana, July 1994-June 1995: Utility of spoligotyping versus IS6110 restriction fragment length polymorphism. Int J Tuberc Lung Dis. 1998;2:743–750. [PubMed] [Google Scholar]
- 23.Aristimuño L, et al. Molecular characterisation of Mycobacterium tuberculosis isolates in the first national survey of anti-tuberculosis drug resistance from Venezuela. BMC Microbiol. 2006;6:90. doi: 10.1186/1471-2180-6-90. [DOI] [PMC free article] [PubMed] [Google Scholar]
- 24.Luciani F, Francis AR, Tanaka MM. Interpreting genotype cluster sizes of Mycobacterium tuberculosis isolates typed with IS6110 and spoligotyping. Infect Genet Evol. 2008;8:182–190. doi: 10.1016/j.meegid.2007.12.004. [DOI] [PubMed] [Google Scholar]
- 25.Tanaka MM, Francis AR. Detecting emerging strains of tuberculosis by using spoligotypes. Proc Natl Acad Sci USA. 2006;103:15266–15271. doi: 10.1073/pnas.0603130103. [DOI] [PMC free article] [PubMed] [Google Scholar]
- 26.Basu S, et al. Averting epidemics of extensively drug-resistant tuberculosis. Proc Natl Acad Sci USA. 2009;106:7672–7677. doi: 10.1073/pnas.0812472106. [DOI] [PMC free article] [PubMed] [Google Scholar]
- 27.Handel A, Regoes RR, Antia R. The role of compensatory mutations in the emergence of drug resistance. PLoS Comput Biol. 2006;2:e137. doi: 10.1371/journal.pcbi.0020137. [DOI] [PMC free article] [PubMed] [Google Scholar]
- 28.Tanaka MM, Francis AR, Luciani F, Sisson SA. Using approximate Bayesian computation to estimate tuberculosis transmission parameters from genotype data. Genetics. 2006;173:1511–1520. doi: 10.1534/genetics.106.055574. [DOI] [PMC free article] [PubMed] [Google Scholar]
- 29.World Health Organisation. Geneva: WHO; 2008. Implementing the WHO Stop TB Strategy: A handbook for national tuberculosis control programmes. Tech Rep (WHO/HTM/TB/2008.401) [PubMed] [Google Scholar]
Associated Data
This section collects any data citations, data availability statements, or supplementary materials included in this article.