

Abstract
Copper deficiency is associated with impaired brain development and mitochondrial dysfunction. Perinatal copper deficiency was produced in Holtzman rats. In vivo proton NMR spectroscopy was used to quantify 18 cerebellar and hippocampal metabolites on postnatal day 21 (P21). Copper status was evaluated in male copper-adequate (CuA) and copper-deficient (CuD) brothers at P19 and at P23, 2 days following NMR experiments, by metal and in vitro metabolite data. Compared to CuA pups, CuD pups had lower ascorbate concentration in both brain regions, confirming prior HPLC data. Both regions of CuD rats also had lower N-acetylaspartate levels consistent with delayed development or impaired mitochondrial function similar to prior work demonstrating elevated lactate and citrate. For other metabolites, the P21 neurochemical profile of CuD rats was remarkably similar to CuA rats but uniquely different from iron-deficient or chronic hypoxia models. Further research is needed to determine the neurochemical consequences of copper deficiency.
Keywords: copper deficient, rat, cerebellum, hippocampus, NMR, metabolites
Introduction
Copper (Cu) is an essential micronutrient for brain development.1 Disturbance of copper metabolism in humans occurs in Menkes’ disease in which deletion of the Cu efflux pump ATP7A prevents efficient movement of Cu across the basolateral membrane of intestinal cells, resulting in peripheral tissue Cu deficiency throughout infancy, a critical period in brain development. Menkes’ disease results in various neurological pathologies including severe mental retardation and developmental delays particularly in the cerebellum.2–5 Rodent models of Menkes’ disease exhibit parallel neurological symptoms.6,7 Cu deficient (CuD) rats experience blunted brain development, most pronounced in the cerebellum, marked by reduced myelination and synaptogenesis as well as motor-function disturbances.7–12 Delayed development of the hippocampus has also been reported in CuD rat pups.13
Though the precise mechanism remains unclear, it is commonly hypothesized that Cu deficiency impairs brain development by disturbing brain energy metabolism via mitochondrial dysfunction.4 Cu is a co-factor for complex IV of the mitochondrial electron transport chain also referred to as cytochrome c oxidase (CCO). Cu deficiency greatly impacts brain CCO activity and protein levels.14,15 Though isolated brain mitochondria from CuD rats have lower Cu,Zn-superoxide dismutase, the reduction is modest compared to CCO.15 Cu deficiency also leads to morphological abnormalities in CuD rat brain mitochondria.16 Elevated lactate levels, a marker of mitochondrial impairment, were detected in brain and cerebrospinal fluid of Menkes’ disease patients.17–19 Higher lactate levels were also measured in metabolite extracts of whole brain and cerebella of CuD rat pups, consistent with impaired mitochondrial metabolism.16,20
NMR studies of brain N-acetylaspartate (NAA) in a Menkes’ disease patient undergoing subcutaneous Cu supplementation treatment provide additional evidence for Cu deficient impairment of brain mitochondria in humans.19 Concentration and synthesis of NAA, a neuron-specific metabolite synthesized by brain mitochondria, is a marker of integrity of brain mitochondrial function.21–24 High brain lactate levels and low NAA concentrations were reversed by Cu supplementation, suggesting that Cu deficiency in Menkes’ disease was directly impacting brain mitochondrial function.
Rodent models of Cu deficiency are important tools for understanding metabolic issues underlying the neuropathology of Menkes’ disease. However, many metabolic aspects of the rodent model remain uncharacterized. Currently, it is unknown if NAA levels are also affected by Cu deficiency in rodent brain. Furthermore, CuD rat pups have recently been shown also to exhibit brain iron (Fe) deficiency.25 Like Cu, Fe is also a co-factor for mitochondrial enzymes including CCO. The possibility that Fe deficiency underlies the metabolic changes observed in CuD rodent brain remains to be determined.
Previously published proton NMR spectroscopy studies of Fe deficiency in developing rat brain revealed a unique pattern of metabolite changes in the hippocampus and striatum, including higher levels of NAA in the early postnatal period.26,27 The purpose of the present study was to determine the effect of Cu deficiency on the neurochemical profile of the developing rat brain. In vivo proton NMR spectroscopy at 9.4 T was used to assess metabolic changes in hippocampus and cerebellum of male rat pups on postnatal day 21 (P21). Cerebellum was chosen because of its sensitivity to Cu deficiency and hippocampus was chosen for comparison with previously published results of Fe deficiency in rats.26
Materials and methods
Animal care and induction of Cu deficiency
Holtzman sperm-positive rats were purchased commercially (Harlan Sprague Dawley; Indianapolis, IN, USA) and received either Cu-adequate (CuA) or Cu-deficient (CuD) dietary treatment consisting of a Cu-deficient, modified AIN-76A diet (Teklad Laboratories; Madison, WI, USA) that contained 0.43 mg Cu/kg by analysis. Normal AIN-76A diet contains approximately 6 mg Cu/kg. All dams and offspring were fed the CuD diet. CuA groups drank water supplemented with cupric sulfate, 20 mg Cu/l, and CuD groups drank de-ionized Cu-free water.28
Littermates of rat pups intended for NMR analysis were sampled at P19 to evaluate Cu status at a date prior to NMR analysis. Rat brain NMR analysis was conducted at P21 and NMR-analyzed pups were sacrificed at P23. Cerebella were rapidly extracted and frozen for further metabolic analysis as described previously.20
All experiments sampled rats from a minimum of four separate litters of each treatment group. All animals were maintained at 24°C with 55% relative humidity on a 12-h light cycle (0700–1900 h). All protocols were formally approved by the University of Minnesota Animal Care Committee.
In vivo proton NMR spectroscopy
Rats were anesthetized by flow gas mixture (N2O:O2, 1:1) containing 1.5–2% isoflurane. Air temperature surrounding the rats was maintained at 30°C by warm water circulation and verified by thermosensor.
Experiments were performed on a 9.4 T/31-cm magnet equipped with an 11-cm gradient coil and strong second–order shim coils (Magnex Scientific, UK). The magnet was interfaced to a Varian INOVA console (Varian, Inc.; Palo Alto, CA, USA). A quadrature surface RF coil with two loops of 14-mm diameter was used for both RF transmission and reception. All first- and second-order shim terms were automatically adjusted using FASTMAP with EPI readout.29,30 Ultra-short echo-time STEAM (TR/TM/TE = 5000/20/2 ms) combined with outer volume suppression and VAPOR water suppression was used for localization.31 Data were saved as arrays of FIDs (8 transients per FID), corrected for the frequency drift, summed, and finally corrected for residual eddy current effects using the reference water signal. The position of the volume of interest (VOI) was selected based on multi-slice RARE images. Data were collected from two VOIs centered in hippocampus (11 μl) and cerebellum (15 μl).
Metabolite quantification
In vivo proton NMR spectra were analyzed using LCModel.32 The unsuppressed water signal measured from the same VOI was used as an internal reference for the quantification, assuming 82% brain water content at P21. The LCModel analysis calculates the best fit to the experimental spectrum as a linear combination of model, solution spectra of brain metabolites. The following 18 metabolites were included in the basis set: alanine (Ala), ascorbate (Asc), aspartate (Asp), creatine (Cr), γ-aminobutyric acid (GABA), glucose (Glc), glutamate (Glu), glutamine (Gln), glutathione (GSH), glycerophosphorylcholine (GPC), myo-inositol (myo-Ins), lactate (Lac), N-acetylaspartate (NAA), N-acetylaspartylglutamate (NAAG), phosphocreatine (PCr), phosphorylcholine (PCho), phosphorylethanolamine (PE) and taurine (Tau) (Fig. 1). In addition, the spectrum of fast relaxing macromolecules, experimentally measured in the mouse brain with an inversion recovery experiment using a short repetition time (TR = 2.0 s, inversion time = 0.675 s), was included in the basis set as previously described.31,33 Most metabolites were quantified with Cramer-Rao lower bounds (CRLB) of 2–30%, corresponding to estimated errors in metabolite concentrations of 0.2–0.5 μmol/g. Only Ala and Asp were quantified in hippocampus with CRLB > 30% and were not consistently quantified in cerebellum.
Figure 1.

In vivo proton NMR spectra acquired from hippocampus and cerebellum of Cu-adequate and Cu-deficient rat pups. STEAM, TE = 2 ms, TR = 5 s; hippocampus: VOI = 11 μl, number of transients NT = 160; cerebellum: VOI = 15 μl, NT = 160. Processing: frequency correction of FID arrays, FID summation, correction for the residual eddy currents, Gaussian multiplication (σ = 0.15 s), FT, zero-order phase correction. Insets: transverse and sagittal RARE images of the brain with the position of the VOIs centered in hippocampus and cerebellum
Tissue collection at P19 and P23
To prevent changes in metabolite concentrations induced by anesthetics, animals were decapitated without anesthesia. To minimize stress experienced by animals from handling before decapitation, rats were handled daily from P0 to day of tissue collection. Upon decapitation, cerebella were immediately removed from the skull and frozen in liquid nitrogen. Only cerebella frozen in under 15 s from the time of decapitation were analyzed. Cerebellar extraction time did not differ between CuA and CuD animals. Fast-frozen cerebella were stored at −75°C until analysis. Remaining brain and a piece of liver tissue were collected for total Cu analysis. Upon decapitation, trunk blood was collected in heparinized tubes and spun immediately to obtain plasma, which was rapidly frozen and stored at −75°C until analysis.
Biochemical and metabolite analyses
Brains, without cerebella, were wet-digested with HNO3 (Trace Metal grade: Fisher Scientific; Pittsburgh, PA, USA) and samples were analyzed for total Cu and Fe content by flame atomic absorption spectroscopy (Model 1100B: Perkin-Elmer; Norwalk, CT, USA). Protein content of tissue samples was determined using a modified version of the Lowry method.34
Plasma was collected from heparinized blood and used to evaluate metabolite concentrations. Cerebellar metabolite extracts were prepared and analyzed according to Lowry et al. with some modifications.35 Briefly, fast frozen tissues were powdered under liquid nitrogen and then transferred to tubes, chilled on dry ice, and mixed with 5 volumes of 0.7 M HClO4. Tubes were then transferred to a −8°C alcohol bath, where samples and acid were mixed. This mixture was then rapidly homogenized using a tissue probe cooled to 4°C. Homogenates were spun and the supernatant neutralized with KHCO3 to yield the final cerebellar metabolite extract. Plasma and cerebellar extract metabolite concentrations of lactate and citrate were determined using enzymatic analyses as previously described.35 For fructose-2,6-bisphosphate (F2,6BP) analysis, frozen tissue was processed and extracts analyzed as described elsewhere.36 Fructose-6-phosphate phosphotransferase, the enzyme necessary for F2,6BP determination, was isolated from potatoes as previously described.36
Statistical analysis
Mean ± SEM values were calculated. Student’s unpaired two-tailed t-test was used to compare data between the two dietary treatments, α = 0.05. Variance equality was evaluated by F-test. Coefficient of variance was determined for lactate data to compare NMR with enzyme coupled data. All data were processed using Microsoft Excel™.
Results
Induction of moderate Cu deficiency in rat pups
To establish Cu status of rat pups undergoing proton NMR spectroscopy at P21, brothers of animals to be studied by NMR, were assessed for tissue Cu levels at P19 (Table 1). Tissue Cu levels were also assessed at P23 in the pups that underwent proton NMR spectroscopy 2 days earlier. Significantly lower brain and liver tissue Cu levels (Table 1) confirmed successful induction of perinatal Cu deficiency. In previous models of perinatal Cu deficiency, CuD pups consistently exhibited lower body weights at P13 and beyond.20,28 However, CuD rat pups in this experiment had no body weight differences from CuA pups at either day of analysis (Table 1). Importantly, brain/body weight (mg/g) was also not impacted by diet at P23: CuA 20.3 ± 1.2 (n = 4) versus 19.8 ± 0.6 for CuD; P > 0.05.
Table 1.
Body weight and tissue copper levels in male rat pups on postnatal days 19 and 23
| P19 | P23 | |||
|---|---|---|---|---|
| Characteristic | CuA | CuD | CuA | CuD |
| Body weight (g) | 51.4 ± 2.1 | 49.9 ± 1.5 | 72.5 ± 3.5 | 67.6 ± 2.6 |
| Brain copper (μg/g) | 2.04 ± 0.03 | 0.57 ± 0.04* | 2.33 ± 0.05 | 0.63 ± 0.04* |
| Liver copper (μg/g) | 32.9 ± 3.6 | 1.25 ± 0.16* | 18.4 ± 3.6 | 0.87 ± 0.07* |
Values are mean ± SEM (n = 4 for P23, and n = 7–10 for P19). Cu-adequate (CuA) mean values were compared to Cu-deficient (CuD) male rat pups (*P < 0.05)
Proton NMR spectroscopy of CuD and CuA brain
Pups used for proton NMR spectroscopy were in good health and similar in body weight (g): CuA 61 ± 3.8 (n = 4) compared to 58 ± 1.7 for CuD; P > 0.05. In general, most neurochemical metabolites detected in P21 cerebellum and hippocampus were not statistically impacted by dietary Cu deficiency (Table 2). However, there were some notable exceptions. Proton NMR spectroscopy detected 17% and 22% lower ascorbate levels in cerebellum and hippocampus of CuD rat pups compared to controls (Fig. 2). This observation is similar to the 20% lower ascorbate content previously seen in CuD mouse brain using HPLC techniques on fast frozen tissue.37 Using enzymatic coupled assays of brain metabolite extracts, previous studies established that dietary Cu deficiency did not alter phosphocreatine levels.27 Proton NMR spectroscopy on P21 rats in the current studies confirmed this previous observation using this new method (Figs 1 and 2). Proton NMR spectroscopy indicated that creatine levels were not altered in CuD rat brain (Fig. 2).
Table 2.
Metabolite concentrations determined by in vivo proton NMR spectroscopy in cerebellum and hippocampus of Cu adequate and Cu deficient rat pups
| Metabolite (μmol/g) | Cerebellum | Hippocampus | ||
|---|---|---|---|---|
| CuA | CuD | CuA | CuD | |
| Alanine | 0.65 ± 0.02 | 0.93 ± 0.23 | 0.90 ± 0.33 | |
| Ascorbate | 3.91 ± 0.33 | 3.21 ± 0.34* | 4.20 ± 0.67 | 3.29 ± 0.31* |
| Aspartate | 1.13 ± 0.03 | 1.73 ± 0.18 | 1.58 ± 0.35 | |
| Creatine | 5.81 ± 0.87 | 5.61 ± 0.55 | 3.97 ± 0.59 | 4.08 ± 0.29 |
| P-Creatine | 5.70 ± 0.92 | 5.65 ± 0.49 | 4.77 ± 0.22 | 4.21 ± 0.42 |
| GABA | 1.59 ± 0.09 | 1.58 ± 0.25 | 1.22 ± 0.26 | 1.23 ± 0.12 |
| Glucose | 2.49 ± 0.36 | 2.51 ± 0.59 | 2.83 ± 0.41 | 2.87 ± 0.46 |
| Glutamine | 2.44 ± 0.41 | 2.27 ± 0.40 | 1.93 ± 0.39 | 1.45 ± 0.29 |
| Glutamate | 9.06 ± 0.32 | 8.20 ± 0.50 | 8.35 ± 1.37 | 8.05 ± 0.48 |
| Glutathione | 0.69 ± 0.15 | 0.99 ± 0.20 | 0.81 ± 0.01 | 0.84 ± 0.26 |
| GPC + P-Cho | 1.22 ± 0.19 | 1.37 ± 0.14 | 0.77 ± 0.13 | 0.89 ± 0.07 |
| Myo-inositol | 4.71 ± 0.47 | 4.68 ± 0.56 | 4.16 ± 0.58 | 3.71 ± 0.15 |
| Lactate | 1.75 ± 0.78 | 1.56 ± 0.56 | 1.91 ± 0.76 | 1.80 ± 0.74 |
| NAA | 7.52 ± 0.20 | 6.85 ± 0.26* | 8.77 ± 0.14 | 8.11 ± 0.27* |
| NAAG | 0.87 ± 0.14 | 1.16 ± 0.10* | 0.81 ± 0.13 | 0.86 ± 0.26 |
| PE | 2.09 ± 0.84 | 2.02 ± 0.16 | 3.23 ± 0.52 | 3.08 ± 0.15 |
| Taurine | 9.51 ± 1.07 | 9.16 ± 1.35 | 10.0 ± 1.04 | 9.99 ± 1.00 |
Male rats measured on postnatal day 21, values are mean ± SD (n = 4). Within a region, Cu-adequate (CuA) mean values were compared to Cu-deficient (CuD) rat pups (*P < 0.05).
GPC, glycerophosphorylcholine; GABA, γ-aminobutyric acid; NAA, N-acetylaspartate; NAAG, N-acetylaspartylglutamate; P-Cho, phosphorylcholine; PE, phosphorylethanolamine.
Cerebellar alanine and aspartate were not consistently quantified.
Figure 2.

Quantification of ascorbate, phosphocreatine, and creatine in cerebellum and hippocampus of Cu-adequate (Cu+) and Cu-deficient (Cu−) P21 male rats using proton NMR spectroscopy. Values are mean ± SEM (n = 4). Mean values of Cu-deficient pups were significantly different from Cu-adequate pups (*P < 0.05)
Characterization of mitochondrial dysfunction in CuD rat brain
Since elevated brain lactate is a marker for mitochondrial distress in both human and rodent CuD brain, it was of special interest to measure lactate by proton NMR spectroscopy.16,19,20 Analyses at P21 did not detect higher lactate levels (μmol/g) in CuD pups in either hippocampus (Table 2) or cerebellum (Fig. 3A). This is possibly due to the higher variability in measuring lactate levels during proton NMR spectroscopy. However, following NMR experiments, analysis of metabolite extracts from cerebella collected without anesthesia on the same rats at P23 revealed 40% higher levels of lactate in CuD pups compared to CuA pups (Fig. 3B). The coefficient of variations (CVs) for the enzyme metabolite analyses were 7% for CuD and 9% for CuA. This was much lower than for the cerebellar proton NMR spectroscopy data, CuD CV was 36% and for CuA CV was 44%. Modestly higher lactate at P23 was consistent with mitochondrial impairment. Analysis of older P30 CuD siblings of those analyzed by proton NMR spectroscopy, demonstrated that CuD cerebellar lactate levels were further augmented by prolonged Cu deficiency as lactate concentration was 1-fold higher in CuD than CuA at P30 (1.64 ± 0.08 in CuA compared to 3.34 ± 0.65 in CuD pups (n = 4); P < 0.01.
Figure 3.
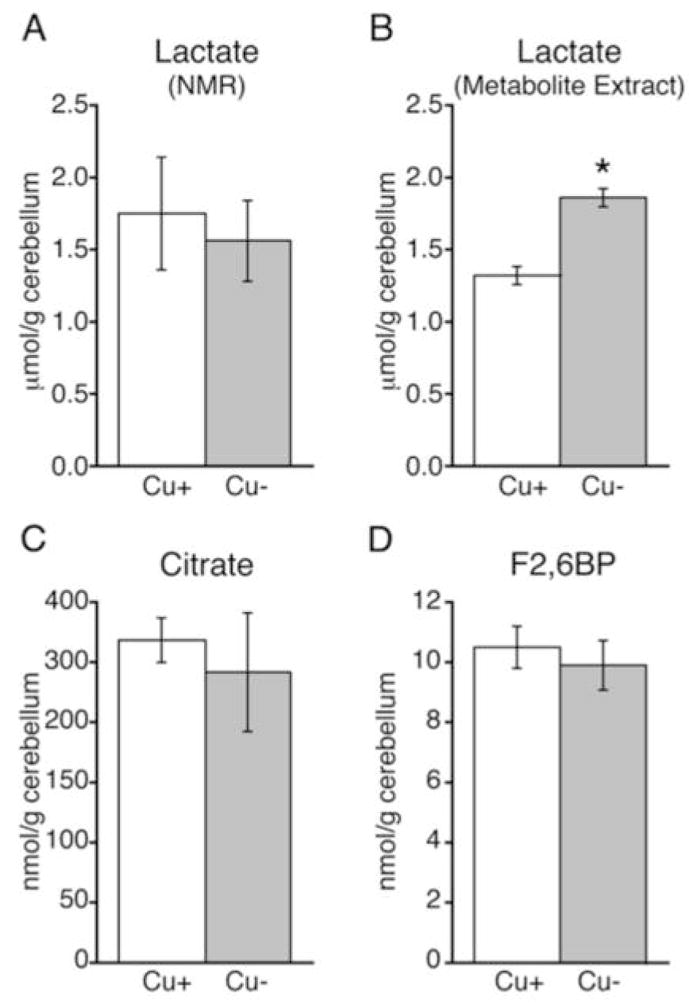
Lactate, was measured in Cu-adequate (Cu+) and Cu-deficient (Cu−) rat pup cerebella by proton NMR spectroscopy at P21 (A) and spectrophotometrically in cerebellar metabolite extracts in the same rats at P23 (B). Additional cerebellar metabolites, citrate (C) and fructose 2,6 bisphos phate (F2,6BP) (D) were determined by enzyme spectrophotometry in extracts at P23. Values are mean ± SEM (n = 4). Mean values of Cu-deficient pups were significantly different from Cu-adequate pups (*P < 0.01)
In previous experiments, severe mitochondrial inhibition in CuD cerebella was accompanied by increased citrate levels, likely a reflection of citric acid cycle inhibition.38 CuD cerebellar citrate levels were not altered in the current experiment (Fig. 3C). Low cerebellar F2,6BP levels have been observed in cases of severe mitochondrial impairment stemming from Cu deficiency likely due to citrate’s inhibition of phosphofructokinae 2.38 However, CuD cerebellar F2,6BP metabolite levels were unchanged in the current experiment (Fig. 3D). Thus, Cu deficiency observed in this experiment induced moderate mitochondrial impairment as compared to prior work with this model.
NAA concentrations in CuD rat hippocampus and cerebellum
NAA, a putative marker for brain mitochondrial impairment and/or brain development, was evaluated in CuD and CuA rat pup hippocampus and the cerebellum by proton NMR spectroscopy. NAA levels in both brain regions were found to be significantly lower in CuD rat pups as compared to controls (Fig. 4). Concentrations of NAA were modestly lower by 9% in cerebellum and 8% in hippocampus.
Figure 4.
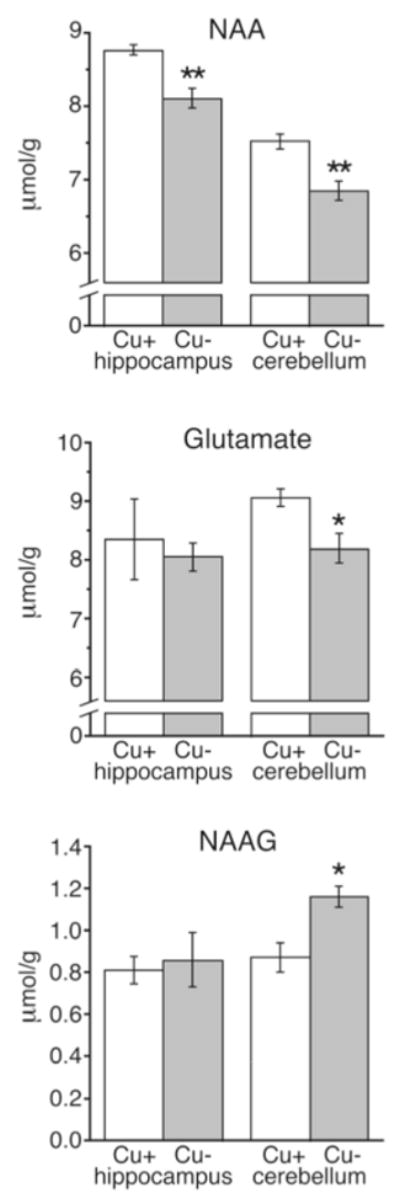
Quantification of N-acetylaspartate (NAA), glutamate, and N-acetylaspartylglutamate (NAAG) concentrations in hippocampus and cerebella of P21 male rats by proton NMR spectroscopy. Values are mean ± SEM (n = 4). Cu-adequate (Cu+) and Cu-deficient (Cu−) mean values were compared (*P < 0.05; **P < 0.01)
CuD rat pup cerebellar levels of a NAA related compound N-acetylaspartylglutamate (NAAG) also significantly differed from CuA controls. NAAG is synthesized in neurons from NAA and glutamate and can be broken down into NAA and glutamate at the astrocytic cell membrane.23 While glutamate concentration was lower in CuD rat pup cerebella compared to CuA controls, NAAG concentration was significantly higher (Fig. 4).
Brain iron deficiency and proton NMR metabolite profile of hippocampus in CuD pups
Corroborating previous studies, brain Fe deficiency was confirmed in CuD rat pups intended for proton NMR spectroscopy. At P19, CuD brothers of rat pups intended for NMR analysis had brain Fe levels 28% lower than CuA rats (Table 3). At P23, lower brain Fe levels in CuD rat pups, analyzed by proton NMR two days earlier, were also determined and found to be 31% lower than CuA controls (Table 3). Hemoglobin levels in CuD rat pups at both P19 and P23 were lower than CuA rats but liver Fe levels remained unaltered in these young rats.
Table 3.
Iron status of male rat pups determined on postnatal days 19 and 23
| Characteristic | P19 | P23 | ||
|---|---|---|---|---|
| CuA | CuD | CuA | CuD | |
| Brain iron (μg/g) | 9.03 ± 0.53 | 6.47 ± 0.28* | 11.2 ± 0.4 | 7.60 ± 0.6* |
| Liver iron (μg/g) | 21.7 ± 1.6 | 21.2 ± 1.2 | 34.8 ± 11.6 | 36.6 ± 4.8 |
| Hemoglobin (g/l) | 78.6 ± 1.5 | 60.0 ± 0.7* | 105 ± 1.5 | 79.6 ± 2.7* |
Values are mean ± SEM (n = 4 for P23, and n = 7–10 for P19). Cu-adequate (CuA) mean values were compared to Cu-deficient (CuD) rat pups (*P < 0.05). Brain iron data have been corrected for blood iron contamination.25
Fe deficiency, evaluated by proton NMR spectroscopy in the hippocampus of rat brain, altered the metabolite profile compared to Fe-adequate rat pups.26 In the current experiment, proton NMR spectroscopy of P21 CuD rat pup hippocampus revealed no change in phosphocreatine levels and lower NAA concentrations (Fig. 2). CuD hippocampal phosphocreatine to creatine ratio was unchanged (1.23 ± 0.11 in CuA versus 1.04 ± 0.09 in CuD pups. Furthermore, metabolites that were reported altered by Fe deficiency (GABA, phosphorylethanolamine and taurine) were not altered in CuD rat pup hippocampus (Table 2).
Discussion
Previous NMR spectroscopy studies of humans with Menkes’ disease have indicated that brain Cu deficiency is associated with elevated levels of brain lactate and lower levels of NAA, a metabolite synthesized in mitochondria.19 It is possible that this association reflects abnormal brain mitochondrial function in Menkes’ disease. One objective of the current studies was to determine whether Cu deficiency in a rodent model of Menkes’ disease also exhibited changes in brain NAA content and whether Fe deficiency accompanying Cu deficiency potentially influenced the metabolic changes observed in CuD brain. Cu deficiency was established in rat pups and proton NMR spectroscopy detected metabolite levels known either to change or remain constant in CuD rat brain based on earlier experiments, including lower ascorbate and unchanged phosphocreatine levels.
Lower ascorbate levels in CuD rat brain in these studies and previously in young CuD mice and Brindled mice illustrate a common consequence of Cu deficit in brain.37 Mechanisms to explain lower ascorbate are unknown. It is likely not due to impaired synthesis by liver since this has been ruled out, for mice at least.39 It is possible that lower ascorbate may be reflective of increased reactive oxygen species because of limiting CCO, Cu, Zn-SOD, and abnormal mitochondria. However, it should be noted that proton NMR data found no alteration in steady-state levels of GSH.
Previous studies of CuD rat pups suggested that Cu deficiency alters mitochondrial function in whole brain and cerebella.16,20 Higher lactate levels from fast-frozen CuD cerebella confirmed mitochondrial dysfunction in both CuD rat pups analyzed at P23, two days after NMR experiments, and older CuD siblings at P30. Mitochondrial impairment, as reflected by lactate levels in these experiments, was not as severe as seen previously where cerebellar lactate levels were markedly above control levels as early as age P24.20 Although proton NMR failed to detect significantly higher cerebellar lactate at P21, this may be due to changes in mitochondrial metabolism accompanying anesthesia during NMR or the modest degree of Cu deficiency at P21. Previous studies demonstrated lactate levels to be especially sensitive to varying levels of anesthetics.40 However, others have not detected lactate changes due isoflurane anesthesia.41
NAA synthesis and concentrations are tightly linked to mitochondrial metabolism and integrity.21,22 This study is the first to confirm, in vivo, that (as seen in Cu deficiency for human brain) CuD rat pups have lower NAA concentrations in at least two brain regions – hippocampus and cerebellum. Since NAA is thought to be a neuron-specific metabolite, this study is the first to provide in vivo evidence consistent with mitochondrial impairment specifically in neurons of CuD rat brain. Furthermore, this study shows that even moderate Cu deficiency can lead to metabolic consequences, including lower NAA levels. NAA levels change during brain development.23 Thus, the lower levels of NAA observed in CuD brain may reflect a delay in development and may not be directly linked with mitochondrial impairment. However, pups used in the current study for proton NMR had no alterations in brain or body weight, thus had no overt developmental impairment.
Neuronally generated NAA has been implicated as an important source of acetyl-CoA used by oligodendrocytes for myelin synthesis.23 Lower NAA levels in CuD rat brain may be a factor associated with hypomyelination observed in Cu deficiency.7,11,42
The majority of previously published NMR studies normalize NAA signal intensity to total creatine signal intensity by reporting the NAA:creatine ratio.19,24 Normalization of NAA concentrations to total creatine concentration in the current experiment resulted in significant reduction of NAA in cerebellum of CuD pups (P < 0.05). Cerebellum is perhaps the most affected brain region in Cu deficiency and the robustness of the observed NAA reduction, regardless of the data expression, may be a reflection of the severity of the impact of Cu deficiency on this brain region.5 Another NAA-related compound, NAAG, was also changed only in cerebellum but not in hippocampus. Interestingly, cerebellar NAAG levels were higher in CuD pups while compounds required for its synthesis, NAA and glutamate, were lower consistent with inhibition of NAAG catabolism in the CuD cerebellum. NAAG is released by neurons and is thought to be catabolized at the astrocytic cell surface.23 This suggests impairment in CuD cerebellar astrocytes, and hints at potential complexity of changes in cerebellum by Cu deficiency.
One potentially confounding issue complicating interpretation of data obtained from CuD rat brain is Fe deficiency induced by Cu-deficient diet during development.25 Fe deficiency, as evaluated by brain Fe content, observed in P23 CuD rat pup brain in this experiment is similar to that observed in dietary Fe deficiency at P28: 30% lower compared to 19% lower for dietary Fe deficiency, respectively.26 However, proton NMR profile comparison revealed little similarity between hippocampal secondary Fe deficiency resulting from dietary Cu deficiency in the current studies and primary dietary Fe deficiency studied previously in rats. Notably, we detected lower NAA levels in secondary Fe deficiency in CuD hippocampus, while NAA in dietary Fe deficiency was reported to be higher. Also, while hippocampal phosphocreatine is increased in dietary Fe deficiency, current NMR data confirm previous metabolite analyses that phosphocreatine is unaltered by Fe deficiency secondary to Cu deficiency.16 Thus, overall data suggest that Cu deficiency produces unique changes to the rat brain NMR metabolite profile distinct from that of dietary Fe deficiency. This evidence supports the contention that the primary cause for metabolic alterations in CuD rat brain is Cu deficiency rather than the resulting secondary Fe deficiency. Further evidence of this has been demonstrated in a recent study showing that Fe supplementation of CuD rat pups failed to reverse metabolic and behavioral abnormalities of Cu-deficient brain including reduced CCO activity.43 Additional research will be necessary to determine the impact, if any, of altered Fe status on Cu-deficient brain.
Acknowledgments
Funding was provided, in part, by NIH HD 39708. The Center for Magnetic Resonance Research is, in part, supported by NIH grants P41 RR008079 and P30 NS057091 and by the W.M. Keck Foundation. Expert assistance from Dr Joshua Pyatskowit for metal analyses is appreciated.
References
- 1.Copper Prohaska., JR . In: Present Knowledge in Nutrition. Bowman BA, Russell RM, editors. Washington, DC: International Life Sciences Institute; 2006. pp. 458–470. [Google Scholar]
- 2.Danks DM, Campbell PE, Stevens BJ, et al. Menkes’s kinky hair syndrome. An inherited defect in copper absorption with widespread effects. Pediatrics. 1972;50:188–201. [PubMed] [Google Scholar]
- 3.Menkes JH, Alter M, Steigleder GK, et al. A sex-linked recessive disorder with retardation of growth, peculiar hair, and focal cerebral and cerebellar degeneration. Pediatrics. 1962;29:764–779. [PubMed] [Google Scholar]
- 4.Mercer JF. Menkes syndrome and animal models. Am J Clin Nutr. 1998;67:1022S–1028S. doi: 10.1093/ajcn/67.5.1022S. [DOI] [PubMed] [Google Scholar]
- 5.Donsante A, Tang J, Godwin SC, et al. Differences in ATP7A gene expression underlie intrafamilial variability in Menkes disease/occipital horn syndrome. J Med Genet. 2007;44:492–497. doi: 10.1136/jmg.2007.050013. [DOI] [PMC free article] [PubMed] [Google Scholar]
- 6.Hunt DM. Primary defect in copper transport underlies mottled mutants in the mouse. Nature. 1974;249:852–854. doi: 10.1038/249852a0. [DOI] [PubMed] [Google Scholar]
- 7.Prohaska JR, Wells WW. Copper deficiency in the developing rat brain: a possible model for Menkes’ steely-hair disease. J Neurochem. 1974;23:91–98. doi: 10.1111/j.1471-4159.1974.tb06920.x. [DOI] [PubMed] [Google Scholar]
- 8.Everson GJ, Tsai HC, Wang TI. Copper deficiency in the guinea pig. J Nutr. 1967;93:533–540. doi: 10.1093/jn/93.4.533. [DOI] [PubMed] [Google Scholar]
- 9.El Meskini R, Crabtree KL, Cline LB, et al. ATP7A (Menkes protein) functions in axonal targeting and synaptogenesis. Mol Cell Neurosci. 2007;34:409–421. doi: 10.1016/j.mcn.2006.11.018. [DOI] [PMC free article] [PubMed] [Google Scholar]
- 10.Prohaska JR. Changes in brain enzymes accompanying deficiencies of the trace elements, copper, selenium, or zinc. In: McHowell J, Gawthorne JM, White CL, editors. Trace Element Metabolism in Man and Animals (TEMA-4) Canberra: Australian Academy of Science; 1981. pp. 275–282. [Google Scholar]
- 11.Zimmerman AW, Matthieu JM, Quarles RH, et al. Hypomyelination in copper-deficient rats. Prenatal and postnatal copper replacement. Arch Neurol. 1976;33:111–119. doi: 10.1001/archneur.1976.00500020039007. [DOI] [PubMed] [Google Scholar]
- 12.Penland JG, Prohaska JR. Abnormal motor function persists following recovery from perinatal copper deficiency in rats. J Nutr. 2004;134:1984–1988. doi: 10.1093/jn/134.8.1984. [DOI] [PubMed] [Google Scholar]
- 13.Hunt CD, Idso JP. Moderate copper deprivation during gestation and lactation affects dentate gyrus and hippocampal maturation in immature male rats. J Nutr. 1995;125:2700–2710. doi: 10.1093/jn/125.10.2700. [DOI] [PubMed] [Google Scholar]
- 14.Cohen E, Elvehjem CA. The relation of iron and copper to cytochrome and oxidase content of animal tissues. J Biol Chem. 1934;107:97–105. [Google Scholar]
- 15.Gybina AA, Prohaska JR. Variable response of selected cuproproteins in rat choroid plexus and cerebellum following perinatal copper deficiency. Genes Nutr. 2006;1:51–60. doi: 10.1007/BF02829936. [DOI] [PMC free article] [PubMed] [Google Scholar]
- 16.Prohaska JR, Wells WW. Copper deficiency in the developing rat brain: evidence for abnormal mitochondria. J Neurochem. 1975;25:221–228. doi: 10.1111/j.1471-4159.1975.tb06956.x. [DOI] [PubMed] [Google Scholar]
- 17.Kodama H, Murata Y, Kobayashi M. Clinical manifestations and treatment of Menkes disease and its variants. Pediatr Int. 1999;41:423–429. doi: 10.1046/j.1442-200x.1999.01095.x. [DOI] [PubMed] [Google Scholar]
- 18.Loyola MA, Dodson WE. Metabolic consequences of trichopoliodystrophy. J Pediatr. 1981;98:588–591. doi: 10.1016/s0022-3476(81)80770-6. [DOI] [PubMed] [Google Scholar]
- 19.Munakata M, Sakamoto O, Kitamura T, et al. The effects of copper-histidine therapy on brain metabolism in a patient with Menkes disease: a proton magnetic resonance spectroscopic study. Brain Dev. 2005;27:297–300. doi: 10.1016/j.braindev.2004.08.002. [DOI] [PubMed] [Google Scholar]
- 20.Gybina AA, Prohaska JR. Copper deficiency results in AMP-activated protein kinase activation and acetylCoA carboxylase phosphorylation in rat cerebellum. Brain Res. 2008;1204:69–76. doi: 10.1016/j.brainres.2008.01.087. [DOI] [PMC free article] [PubMed] [Google Scholar]
- 21.Bates TE, Strangward M, Keelan J, et al. Inhibition of N-acetylaspartate production: implications for 1H MRS studies in vivo. Neuroreport. 1996;7:1397–1400. [PubMed] [Google Scholar]
- 22.Clark JB. N-Acetyl aspartate: a marker for neuronal loss or mitochondrial dysfunction. Dev Neurosci. 1998;20:271–276. doi: 10.1159/000017321. [DOI] [PubMed] [Google Scholar]
- 23.Moffett JR, Ross B, Arun P, et al. N-Acetylaspartate in the CNS: from neurodiagnostics to neurobiology. Prog Neurobiol. 2007;81:89–131. doi: 10.1016/j.pneurobio.2006.12.003. [DOI] [PMC free article] [PubMed] [Google Scholar]
- 24.Signoretti S, Marmarou A, Aygok GA, et al. Assessment of mitochondrial impairment in traumatic brain injury using high-resolution proton magnetic resonance spectroscopy. J Neurosurg. 2008;108:42–52. doi: 10.3171/JNS/2008/108/01/0042. [DOI] [PubMed] [Google Scholar]
- 25.Prohaska JR, Gybina AA. Rat brain iron concentration is lower following perinatal copper deficiency. J Neurochem. 2005;93:698–705. doi: 10.1111/j.1471-4159.2005.03091.x. [DOI] [PMC free article] [PubMed] [Google Scholar]
- 26.Rao R, Tkac I, Townsend EL, et al. Perinatal iron deficiency alters the neurochemical profile of the developing rat hippocampus. J Nutr. 2003;133:3215–3221. doi: 10.1093/jn/133.10.3215. [DOI] [PubMed] [Google Scholar]
- 27.Ward KL, Tkac I, Jing Y, et al. Gestational and lactational iron deficiency alters the developing striatal metabolome and associated behaviors in young rats. J Nutr. 2007;137:1043–1049. doi: 10.1093/jn/137.4.1043. [DOI] [PMC free article] [PubMed] [Google Scholar]
- 28.Gybina AA, Prohaska JR. Increased rat brain cytochrome c correlates with degree of perinatal copper deficiency rather than apoptosis. J Nutr. 2003;133:3361–3368. doi: 10.1093/jn/133.11.3361. [DOI] [PubMed] [Google Scholar]
- 29.Gruetter R. Automatic, localized in vivo adjustment of all first- and second-order shim coils. Magn Reson Med. 1993;29:804–811. doi: 10.1002/mrm.1910290613. [DOI] [PubMed] [Google Scholar]
- 30.Gruetter R, Tkac I. Field mapping without reference scan using asymmetric echo-planar techniques. Magn Reson Med. 2000;43:319–323. doi: 10.1002/(sici)1522-2594(200002)43:2<319::aid-mrm22>3.0.co;2-1. [DOI] [PubMed] [Google Scholar]
- 31.Tkac I, Henry PG, Andersen P, et al. Highly resolved in vivo1H NMR spectroscopy of the mouse brain at 9.4 T. Magn Reson Med. 2004;52:478–484. doi: 10.1002/mrm.20184. [DOI] [PubMed] [Google Scholar]
- 32.Provencher SW. Estimation of metabolite concentrations from localized in vivo proton NMR spectra. Magn Reson Med. 1993;30:672–679. doi: 10.1002/mrm.1910300604. [DOI] [PubMed] [Google Scholar]
- 33.Pfeuffer J, Tkac I, Provencher SW, et al. Toward an in vivo neurochemical profile: quantification of 18 metabolites in short-echo-time (1)H NMR spectra of the rat brain. J Magn Reson. 1999;141:104–120. doi: 10.1006/jmre.1999.1895. [DOI] [PubMed] [Google Scholar]
- 34.Markwell MA, Haas SM, Bieber LL, et al. A modification of the Lowry procedure to simplify protein determination in membrane and lipoprotein samples. Anal Biochem. 1978;87:206–210. doi: 10.1016/0003-2697(78)90586-9. [DOI] [PubMed] [Google Scholar]
- 35.Lowry OH, Passonneau JV. A flexible system of enzymatic analysis. New York: Academic Press; 1972. [Google Scholar]
- 36.Van Schaftingen E, Lederer B, Bartrons R, et al. A kinetic study of pyrophosphate: fructose-6-phosphate phosphotransferase from potato tubers. Application to a microassay of fructose 2,6-bisphosphate. Eur J Bio chem. 1982;129:191–195. doi: 10.1111/j.1432-1033.1982.tb07039.x. [DOI] [PubMed] [Google Scholar]
- 37.Prohaska JR, Cox DA. Decreased brain ascorbate levels in copper-deficient mice and in brindled mice. J Nutr. 1983;113:2623–2629. doi: 10.1093/jn/113.12.2623. [DOI] [PubMed] [Google Scholar]
- 38.Gybina AA, Prohaska JR. Fructose 2,6 bisphosphate is lower in copper deficient rat cerebellum despite higher content of phosphorylated AMP-activated protein kinase. Exp Biol Med. 2008;233:1262–1270. doi: 10.3181/0804-RM-132. [DOI] [PMC free article] [PubMed] [Google Scholar]
- 39.Prohaska JR, Cox DA, Bailey WR. Ascorbic acid synthesis and concentrations in organs of copper-deficient and brindled mice. Biol Trace Elem Res. 1984;6:441–453. doi: 10.1007/BF02989261. [DOI] [PubMed] [Google Scholar]
- 40.Valette J, Guillermier M, Besret L, et al. Isoflurane strongly affects the diffusion of intracellular metabolites, as shown by 1H nuclear magnetic resonance spectroscopy of the monkey brain. J Cereb Blood Flow Metab. 2007;27:588–596. doi: 10.1038/sj.jcbfm.9600353. [DOI] [PubMed] [Google Scholar]
- 41.Kofke WA, Hawkins RA, Davis DW, et al. Comparison of the effects of volatile anesthetics on brain glucose metabolism in rats. Anesthesiology. 1987;66:810–813. doi: 10.1097/00000542-198706000-00016. [DOI] [PubMed] [Google Scholar]
- 42.Dipaolo RV, Kanfer JN, Newberne PM. Copper deficiency and the central nervous system. Myelination in the rat: morphological and biochemical studies. J Neuropathol Exp Neurol. 1974;33:226–236. doi: 10.1097/00005072-197404000-00003. [DOI] [PubMed] [Google Scholar]
- 43.Pyatskowit JW, Prohaska JR. Iron injection restores brain iron and hemoglobin deficits in perinatal copper deficient rats. J Nutr. 2008;138:1880–1886. doi: 10.1093/jn/138.10.1880. [DOI] [PubMed] [Google Scholar]