Abstract
The structures of a number of stereoisomers of carotenoids have been revealed in three-dimensional X-ray crystallographic investigations of pigment-protein complexes from photosynthetic organisms. Despite these structural elucidations, the reason for the presence of stereoisomers in these systems is not well understood. An important unresolved issue is whether the natural selection of geometric isomers of carotenoids in photosynthetic pigment-protein complexes is determined by the structure of the protein binding site or by the need for the organism to accomplish a specific physiological task. The association of cis isomers of a carotenoid with reaction centers and trans isomers of the same carotenoid with light-harvesting pigment-protein complexes has led to the hypothesis that the stereoisomers play distinctly different physiological roles. A systematic investigation of the photophysics and photochemistry of purified, stable geometric isomers of carotenoids is needed to understand if a relationship between stereochemistry and biological function exists. In this work we present a comparative study of the spectroscopy and excited state dynamics of cis and trans isomers of three different open-chain carotenoids in solution. The molecules are neurosporene (n=9), spheroidene (n=10), and spirilloxanthin (n=13), where n is the number of conjugated π-electron double bonds. The spectroscopic experiments were carried out on geometric isomers of the carotenoids purified by high performance liquid chromatography (HPLC) and then frozen to 77 K to inhibit isomerization. The spectral data taken at 77 K provide a high resolution view of the spectroscopic differences between geometric isomers. The kinetic data reveal that the lifetime of the lowest excited singlet state of a cis-isomer is consistently shorter than that of its corresponding all-trans counterpart despite the fact that the excited state energy of the cis molecule is typically higher than that of the trans molecule. Quantum theoretical calculations on an n=9 linear polyene were carried out to examine this process. The calculations indicate that the electronic coupling terms are significantly higher for the cis isomer, and when combined with the Franck-Condon factors, predict internal conversion rates roughly double those of the all-trans species. The electronic effects more than offset the decrease in coupling efficiencies associated with the higher system origin energies and explain the observed shorter cis isomer lifetimes.
Introduction
The basic molecular structure of carotenoids consists of a system of conjugated π-electron carbon-carbon double bonds [1-3]. The extended nature of this carbon skeleton makes carotenoids susceptible to geometric isomerization. Typically, the all-trans geometric isomer of carotenoids is the most favored configuration thermodynamically, but stable cis stereoisomers may be produced from the all-trans isomer by thermal, photochemical or catalytic processes [4]. The stability of a particular cis isomer depends on the depth of the potential well and the height of the barrier for isomerization to the trans or other cis configurations [5].
Carotenoids are well-known for their strong visible absorption in the 400 to 500 nm region and this gives rise to their yellow, orange and red coloration. This absorption band is associated with a strongly allowed S0 (11Ag-) → S2 (11Bu+) transition in the idealized C2h point group [6,7]. In contrast, transitions to and from S0 (11Ag-) and the lowest excited singlet state, S1 (21Ag-), are forbidden by symmetry. The position and shape of the strong visible absorption band are sensitive to the length of the π-electron conjugated chain and to the presence of attached functional groups. Hence, absorption spectroscopy is frequently used to identify carotenoid structures [8]. Absorption spectroscopy also confirms the presence of geometric isomers through another absorption band in the ultraviolet region whose intensity is sensitive to the position of a cis double bond in the conjugated π-electron chain [1,4,9]. This short wavelength band is referred to as a “cis-peak” and is associated with an S0 (11Ag-) → S3 (11Ag+) transition that becomes more allowed as the symmetry of the molecule is reduced upon isomerization from a trans to a cis configuration [1,10]. All-trans-isomers have very small, sometimes imperceptible, cis-peaks whereas central-cis isomers have cis-peaks that may approach half the intensity of the major visible S0 (11Ag-) → S2 (11Bu+) absorption band.
A number of stereoisomers of carotenoids have been found in the three-dimensional X-ray crystal structures of pigment-protein complexes from photosynthetic organisms [11-15]. For example, of the twenty-two carotenoids resolved in the electron density map of cyanobacterial Photosystem I, seventeen are in the all-trans configuration, and five adopt a cis isomeric form: two are 9-cis, and one each are 9,9′-cis, 9,13′-cis, and 13-cis [15]. In another example, carotenoids in photosynthetic bacterial reaction center pigment-protein complexes adopt a 15,15′-cis geometric isomeric configuration whereas carotenoids in light-harvesting complexes from the same species take on the all-trans configuration [14]. Despite this knowledge of the stereochemistry of protein-bound carotenoids, the role these isomers play in photosynthesis and in other biological systems is not well understood. Different geometric isomers of carotenoids have been associated with varying levels of antioxidant efficacy, but the molecular basis for this behavior has yet to be elucidated [16-18]. An important question is whether the selection of cis isomers in biological systems in general, and in photosynthetic pigment-protein complexes in particular, is determined solely by the structure of the carotenoid binding site in the protein or by the need for the organism to accomplish a specific physiological task. The fact that photosynthetic reaction centers, which contain cis-carotenoids, perform electron transfer across a phospholipid membrane, and light-harvesting complexes, which contain trans-carotenoids, and carry out the distinctly different process of excitation energy transfer, has led to the hypothesis that the incorporation by nature of different stereoisomers in these proteins is physiologically significant [12,19]. The natural selection of the 15,15′-cis isomer in reaction centers has been proposed to be a structural key in the mechanism for the deactivation of harmful excited triplet states of bacteriochlorophyll [12,19,20]. Triplet states of bacteriochlorophyll (and chlorophyll) are known to sensitize the formation of singlet oxygen, a powerful oxidizing agent, which must be deactivated to protect the photosynthetic apparatus [19,21,22]. Work by other researchers have questioned whether specific geometric isomers and geometric isomerization are controlling factors in the mechanism of photoprotection [23,24]. However, more systematic investigations of the photophysics and photochemistry of well-defined, purified geometric isomers of carotenoids are needed to understand if a relationship between stereochemistry and biological function exists.
In this work we present a comparative study of the spectroscopy and excited state dynamics of geometric isomers three different open-chain carotenoids in solution. The molecules are neurosporene (n=9), spheroidene (n=10), and spirilloxanthin (n=13), where n is the number of conjugated π-electron double bonds (Fig. 1). The spectroscopic experiments were carried out on geometric isomers of the carotenoids purified by high performance liquid chromatography (HPLC) and then frozen to 77 K to inhibit isomerization. The spectral data taken at 77 K are better resolved than at room temperature and provide a detailed look at the spectroscopic properties of the geometric isomers. Transient absorption experiments revealed that the lifetimes of the lowest excited singlet state of the cis-isomers are uniformly shorter than those of their corresponding all-trans counterparts. This occurs despite the fact that the excited state energies of the cis carotenoids were determined here to be higher, and therefore the lifetimes of the cis isomers are expected to be longer, than those of the trans molecules. Quantum computations provide a rationale for this observation.
Fig. 1.
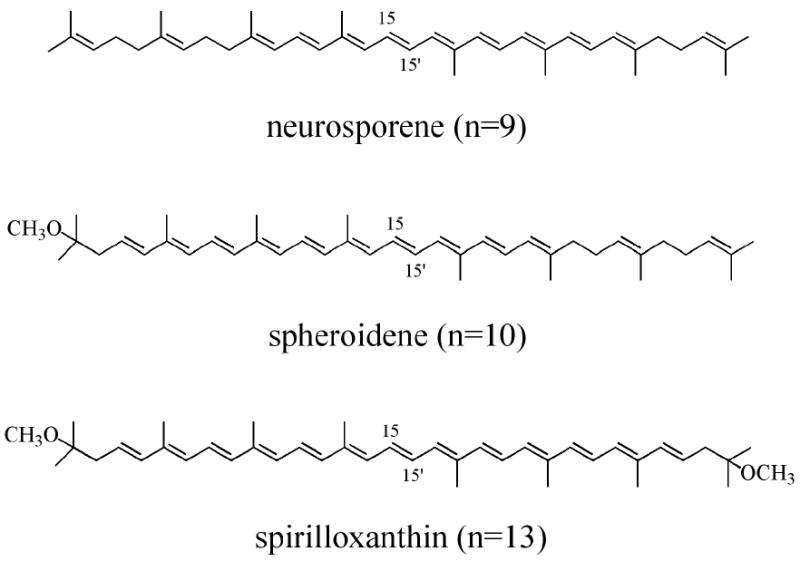
Structures of the all-trans isomers of neurosporene, spheroidene and spirilloxanthin.
Materials and Methods
Cells of Rhodobacter (Rb.) sphaeroides wild type 2.4.1, G1C and Rhodospirillum (Rps.) rubrum wild type were grown anaerobically in peptone/yeast extract media or Van Niels' media and harvested during the stationary growth phase by centrifugation. Neurosporene and spheroidene were obtained from approximately 3 g of wet pack Rb. sphaeroides G1C and Rb. sphaeroides 2.4.1 cells respectively. The cells were mixed with 30 mL of methanol/acetone (1/1, v/v, technical grade) and centrifuged at 6000 × g for 5 min in a Sorvall SS34 rotor. The supernatant containing a mixture of bacteriochlorophyll and carotenoids was collected and dried using a rotary evaporator. The dry residue was dissolved in ∼200 mL of methanol/petroleum ether (9/1, v/v, technical grade) and saponified using 5 % w/v KOH in order to decompose the bacteriochlorophyll [25]. The solution was then washed with water in a separatory funnel. The ether layer containing the mixture of carotenoids was collected and dried using a stream of nitrogen gas.
Neurosporene was purified using an alumina (Sigma) gravity column (250 ×10 mm) with petroleum ether as the eluting solvent. Spheroidene was purified using a Millipore Waters 600E HPLC system employing a preparative Nova-Pak 25 × 100 mm C18 PrePak Cartridge using a gradient mobile phase 100% A to 100% B over 40 min, where A was acetonitrile/methanol/water (87/10/3, v/v/v), and B was ethyl acetate. The flow rate was 9.0 mL/min. Isomers of neurosporene and spheroidene were obtained using a YMC C30 carotenoid column and an isocratic mobile phase of methyl-tert-butyl ether (MTBE)/methanol (38/62, v/v) with a flow rate of 1.5 mL/min. Spirilloxanthin was obtained as described previously [26]. Isomers of spirilloxanthin were separated using YMC C30 carotenoid column with an isocratic mobile phase of hexane/2-propanol (80/20, v/v) with a flow rate of 1.5 mL/min. The isomers of all the carotenoids were dried with a gentle stream of nitrogen and stored at -80 °C until ready to use in the spectroscopic experiments.
Transient absorption was carried out using a femtosecond laser spectrometer system described previously [27]. The 77 K experiments were done using a helium cryostat (Janis Model STVP100). Neurosporene and spheroidene were studied in EPA (diethyl ether/isopentane/ethanol, 5/5/2, v/v/v), and because of its lack of solubility in EPA, spirilloxanthin was studied in 2-methyltetrahydrofuran (2-MTHF). The samples were excited at wavelengths corresponding to their spectral origin (0-0) vibronic bands and had optical densities of ∼0.5 in a 2 mm path length cuvette at the excitation wavelength. The integrity of the samples was checked by taking absorption spectra before and after every transient absorption experiment. Surface Explorer (v.1.0.6) was used to correct for dispersion in the transient absorption spectra, and ASUFit 3.0 software provided by Dr. Evaldas Katilius at Arizona State University was used for global fitting of the datasets.
Results
Steady-state absorption spectra
Steady-state absorption spectra of all-trans and cis isomers of neurosporene and spheroidene in EPA, and spirilloxanthin in 2-MTHF at 77 K are shown in Figs. 2A-C. The low temperature spectra display a high degree of vibronic resolution. Multiple vibronic bands are observed in all the spectra. Also, the spectra of the molecules shift to longer wavelength and the vibronic resolution decreases with increasing n. In all cases, the spectra of the cis isomers of the molecules are blue-shifted by ∼7 nm relative to their corresponding all-trans isomers. In addition, the cis molecules display pronounced cis-peaks in the UV region. The large amplitude of the cis-peaks for neurosporene and spirilloxanthin (thin lines in Figs. 2A and C) indicate that these are spectra of central-cis configurations of these isomers: 15,15′-cis for spirilloxanthin, and most likely 13′,14′-cis for neurosporene. These are the least sterically hindered cis-configurations of these molecules, and therefore the most stable. For spheroidene, two stable cis isomers were obtained from the HPLC. The isomer displaying the largest cis-peak in its absorption spectrum (thin line in Fig. 2B) has been assigned to the 13,14-cis configuration on the basis of a computational analysis and resonance Raman spectroscopy [28,29]. The fact that the other spheroidene isomer has a smaller cis-peak (dashed line in Fig. 2B) indicates that the cis-bond in this molecule resides closer to the ends of the conjugated π-electron chain. Hereafter, these geometric isomers will be referred to as either central-cis or terminal-cis.
Fig. 2.
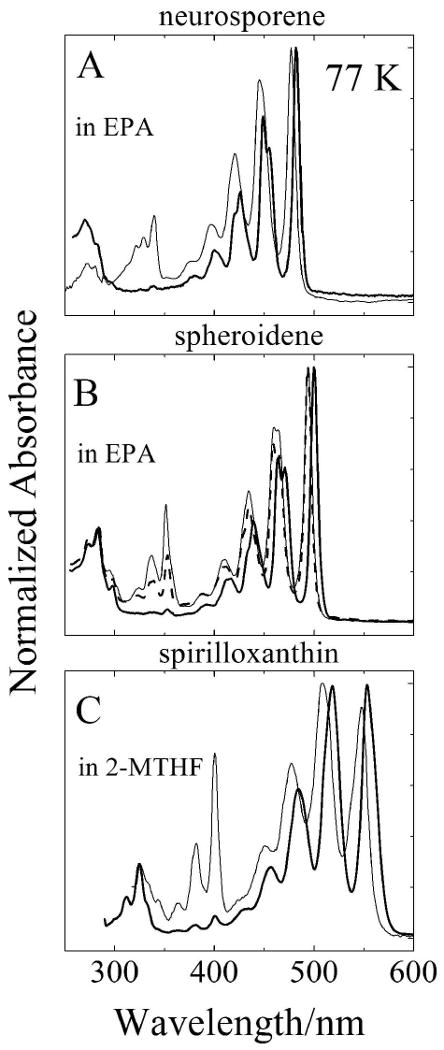
Steady-state absorption spectra of all-trans (—) and central-cis isomers (—) of: (A) neurosporene; (B) spheroidene; and (C) spirilloxanthin. In the case of spheroidene the absorption spectrum of a terminal-cis isomer (----) is shown. The spectra were recorded at 77 K in EPA for neurosporene and spheroidene and in 2-MTHF for spirilloxnthin. The spectra were normalized to their absorption maxima.
Transient absorption spectra
Transient absorption spectra of the molecules taken at various delay times after the excitation pulse are shown in Fig. 3. At very early times the spectra exhibit negative bands in the region 450 to 550 nm. These correspond to a combination of the immediate onset of bleaching of the strongly allowed S0 (11Ag-) → S2 (11Bu+) absorption and stimulated emission from the S2 (11Bu+) state. For all the molecules there is a subsequent build-up of a strong transient absorption signal to longer wavelength. This signal is associated with an S1 (21Ag-) → Sn transition and was observed to be extremely sharp for the all-trans and terminal cis isomers compared to the central-cis molecules (Fig. 3). The position of this band shifts to longer wavelength with increasing n. For the central-cis molecules, a noticeable shoulder appears on the short wavelength side of the main transient absorption band. For neurosporene and spheroidene, the spectra taken at the 500 fs time delay exhibit broadening of the main band that disappears at longer times. Also seen in the spectra taken at the earlier time delays are small but noticeable bands 50 to 75 nm to longer wavelength of the major peak. These bands are much larger for the central-cis isomers than for the trans configurations and disappear as time progresses beyond 1 ps while the major transient absorption band persists.
Fig. 3.
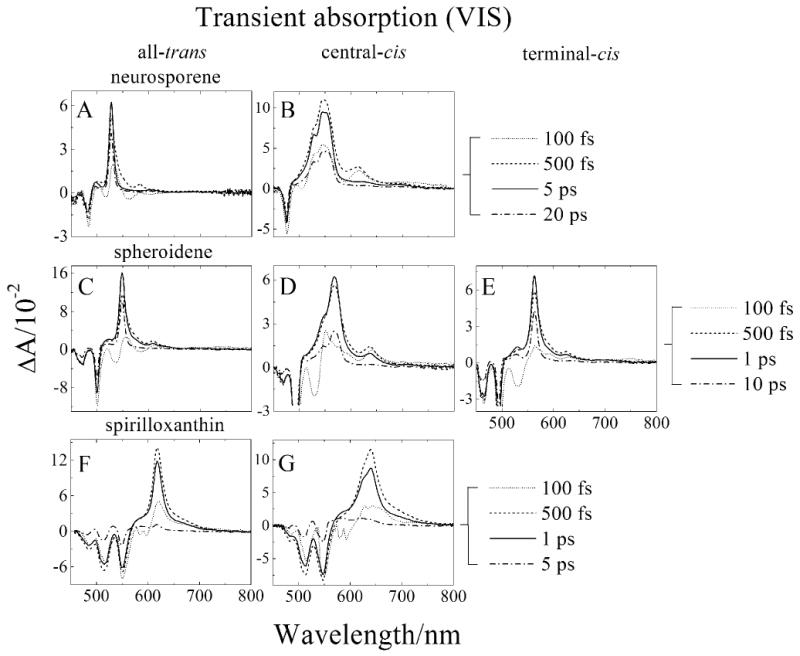
Transient absorption spectra in the visible (VIS) spectra region of: (A) all-trans-neurosporene; (B) central-cis-neurosporene; (C) all-trans-spheroidene; (D) central-cis-spheroidene; (E) terminal-cis-spheroidene; (F) all-trans-spirilloxanthin; and (G) central-cis-spirilloxanthin taken at various delay times after excitation. The spectra were recorded at 77 K in EPA for neurosporene and spheroidene and in 2-MTHF for spirilloxnthin.
Global fitting analysis
Global fitting of the transient absorption datasets taken in the visible spectral region were carried out using a model invoking a sequential decay pathway for the photo-excited singlet states. The results obtained in this manner are termed evolution associated difference spectra (EADS) [30] and are shown in Fig. 4. For all the molecules three EADS components were sufficient to obtain a satisfactory fit based on a chi square (χ2) test and minimization the residual matrix. The global fitting results of the neurosporene and spheroidene datasets are very similar and are shown in Figs. 4A-E. The fastest kinetic component has a time constant of 120 to 160 fs and shows several negative bands in the range 450 to 650 nm. As mentioned above, these are associated with a combination of stimulated emission from the S2 (11Bu+) state, and bleaching of the steady state S0 (11Ag-) → S2 (11Bu+) absorption transition. The second EADS component has a lifetime ranging from 640 fs to 1.1 ps and is assigned to transient absorption from a vibrationally non-equilibrated S1 (11Ag+) excited state [26,27,31-38]. For all the isomers of neurosporene and spheroidene, the lineshape of this second EADS is broad and exhibits two well-defined peaks (dashed lines in Figs. 4A-E). The third, and last EADS component has a spectral profile typical of a transition from a vibrationally relaxed S1 (21Ag-) state to a higher Sn excited state [26,31-33,39-44]. The lifetime of this component represents that of the S1 (21Ag-) state. The S1 (21Ag-) lifetimes for all-trans-spheroidene and neurosporene obtained here are in good agreement with those reported previously [26,31,45-49]. It is important to note that the S1 (21Ag-) lifetimes of the central-cis isomers are significantly shorter than those of their all-trans counterparts. (See Table 1.)
Fig. 4.
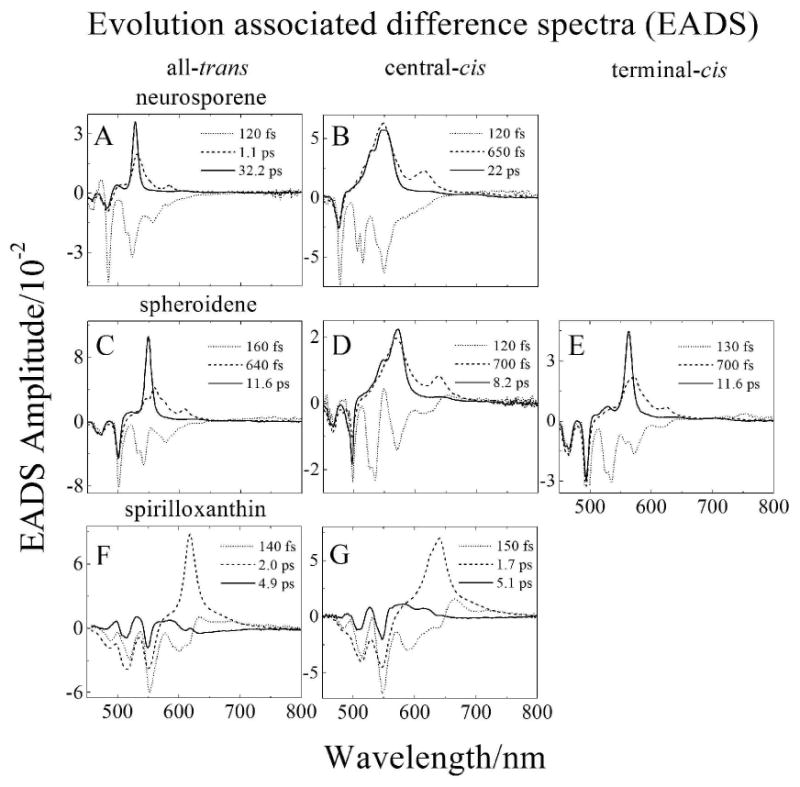
Global fitting results using an evolution (sequential) decay model (EADS) of the transient absorption datasets presented in Fig. 3 from: (A) all-trans-neurosporene; (B) central-cis-neurosporene; (C) all-trans-spheroidene; (D) central-cis-spheroidene; (E) terminal-cis-spheroidene; (F) all-trans-spirilloxanthin; and (G) central-cis-spirilloxanthin.
Table 1.
Energies and lifetimes of the S1 (21Ag-) excited states of geometric isomers of carotenoids.
| carotenoid | τ1a (ps) |
S1 (21Ag-) energy (cm-1) | solvent | T (K) |
Ref. | |
|---|---|---|---|---|---|---|
| S1-S2b | Fluor.c | |||||
| all-trans-neurosporene | ||||||
| 34.8 ± 0.1 | 14,400 ± 50 | EPA | 77 | this work | ||
| 23.0 ± 0.1 | n.d.d | acetone | RT | [26] | ||
| 25.5 ± 0.1 | n.d. | CS2 | RT | [26] | ||
| 21.2 ± 0.1 | n.d. | n-hexane | RT | [46] | ||
| 24.0 | n.d. | n-hexane | RT | [75] | ||
| 15,300 | n-hexane | RT | [45] | |||
| central-cis-neurosporene | ||||||
| 22.0 ± 0.1 | 14,950 ± 50 | EPA | 77 | this work | ||
| all-trans-spheroidene | ||||||
| 11.5 ± 0.1 | 13,440 ± 20 | EPA | 77 | this work | ||
| 7.8-8.5 | 13,400 ± 90 | n-hexane | RT | [49] | ||
| 7.7-8.2 | n.d. | n-hexane | RT | [31] | ||
| 8.7 ± 0.1 | n.d. | hexane | RT | [47] | ||
| 14,200 | n-hexane | RT | [45] | |||
| central-cis-spheroidene | ||||||
| 8.2 ± 0.1 | 13,840 ± 40 | EPA | 77 | this work | ||
| 13,14-locked-cis-spheroidene | ||||||
| 6.5 ± 0.1 | n.d. | n-hexane | RT | [31] | ||
| 15,15′-locked-cis-spheroidene | ||||||
| 7.1 ± 0.1 | n.d. | pet. ether | RT | [31] | ||
| all-trans-spirilloxanthin | ||||||
| 2.0 ± 0.1 | 11,430 ± 30 | 2-MTHF | 77 | this work | ||
| 1.3 | 11,500 ± 200 | n-hexane | RT | [76] | ||
| 1.4 | 11,530 ± 200 | LH1 | RT | [76] | ||
| 1.2 ± 0.2 | n.d. | acetone | RT | [26] | ||
| 1.5 ± 0.1 | n.d. | CS2 | RT | [26] | ||
| 1.7 ± 0.1 | n.d. | EPA | 77 | [26] | ||
| 1.4 | n.d. | hexane | RT | [52] | ||
| 1.3 | n.d. | 15% benzene in hexane | RT | [51] | ||
| 1.4 | n.d. | THF | RT | [50] | ||
| 1.5 | n.d. | benzene | RT | [53] | ||
| 11,900 | n-hexane | RT | [77] | |||
| central-cis-spirilloxanthin | ||||||
| 1.7 ± 0.1 | 11,870 ± 50 | 2-MTHF | 77 | this work | ||
Lifetime of the S1(21Ag-) excited state;
The value of the S1(21Ag-) excited state energy determined from the S1-S2 energy gap;
The S1(21Ag-) excited state energy determined from steady-state fluorescence;
not determined.
The global fitting results for all-trans and central-cis-spirilloxanthin are shown in Figs. 4F and G. The first EADS component has lifetimes of 140 and 150 fs for the all-trans and central-cis isomers, respectively. The profiles (dotted lines in Figs. 4F and G) are a complex combination of bleaching of the steady state S0 (11Ag-) → S2 (11Bu+) absorption spectrum at short wavelengths, stimulated emission from the S2 (11Bu+) excited state, evidenced by weak negative bands around 600 nm, and transient absorption from the vibronically excited S1 (21Ag-) state, appearing as positive bands in the range 620 to 750 nm. The second EADS component (dashed lines in Figs. 4F and G) is associated with transient absorption occurring from the relaxed S1 (21Ag-) excited state. This second EADS lineshape displays a single peak which is narrower and blue shifted for all-trans versus central-cis-spirilloxanthin. These components correspond to the lifetime of the S1 (21Ag-) state which is 2.0 ps for the all-trans isomer and 1.7 ps for the central-cis molecule. The value for the all-trans isomer is in agreement with previously published reports [26,50-53].
Previous room temperature investigations of spirilloxanthin revealed an additional longer-lived kinetic component associated with transient absorption from the so-called S* state [26,52]. The S* → Sn transition is characterized by a shoulder on the short wavelength side of the main S1 (21Ag-) → Sn transient absorption band. The third and final EADS component (solid lines in Figs. 4F and G) displays a weak broad band between 575 and 600 nm having a lifetime of ∼5 ps. Based on previous reports we assign this feature to transient absorption from S*.
Transient absorption in the NIR
Transient absorption spectra of central-cis and all-trans neurosporene, spheroidene and spirilloxanthin in the near infrared (NIR) region are shown in Fig. 5. The NIR transient absorption spectra of all-trans (solid line in Fig. 5A) and central-cis-neurosporene (dashed line in Fig. 5A) taken 100 fs after excitation show multiple peaks. The spectrum of the all-trans isomer has four peaks at 910, 1000, 1140 and 1340 nm. For central-cis-neurosporene, the first and second peaks almost coalesce into one peak, and the first three peaks shift to longer wavelength, compared to the all-trans-molecule. Because the fast delay time (∼100 fs) of this spectrum is comparable to the lifetime of the S2 (11Bu+) excited state of neurosporene, and the fact that these peaks disappear at longer times (Fig. 5B) the spectral profiles are attributed to an S2 (11Bu+) → Sn transition in keeping with previous assignments [49]. Transient absorption spectra in the NIR taken at 25 ps for all-trans-neurosporene and at 16 ps for the central-cis isomer are shown in Fig. 5B. These spectra exhibit vibronic structure with two peaks at 1110 and 1300 nm for the all-trans isomer (solid line in Fig. 5B) and at 1135 and 1330 nm for the central-cis molecule (dashed line in Fig. 5B). These are associated with absorption from a vibronically relaxed S1 (21Ag-) state to S2 (11Bu+) [49].
Fig. 5.
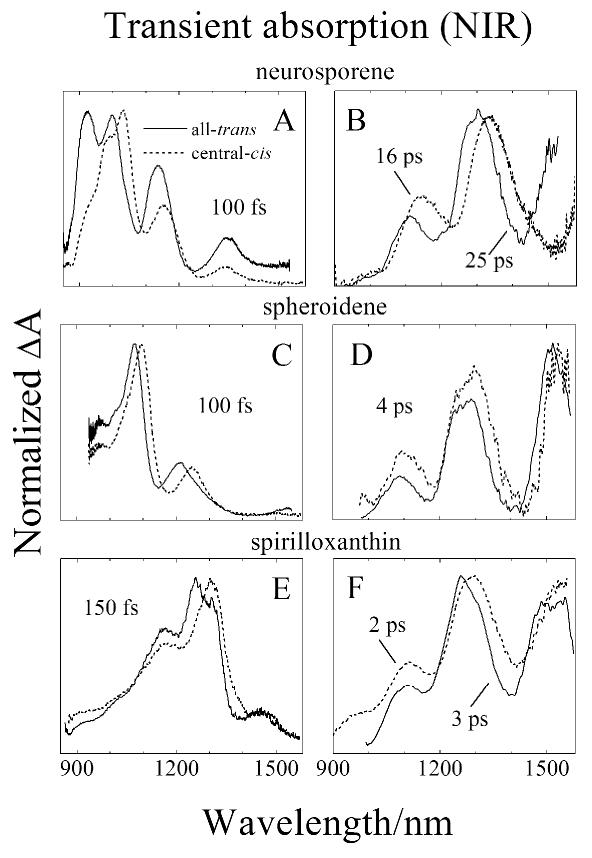
Transient absorption spectra in the near infrared (NIR) spectral region of central-cis (----) and all-trans (—) isomers of: (A and B) neurosporene; (C and D) spheroidene, and (E and F) spirilloxanthin. The delay times corresponding to when the spectra were taken are indicated in the figure. The spectra were recorded at 77 K in EPA for neurosporene and spheroidene and in 2-MTHF for spirilloxnthin.
The NIR transient absorption spectra of the all-trans and central-cis isomers of spheroidene taken at a 100 fs delay time are shown in Fig. 5C. The spectra have almost identical but shifted lineshapes with two peaks at 1072 and 1210 nm for the all-trans isomer and at 1096 and 1244 nm for central-cis-spheroidene. The spectra of the vibronically relaxed S1 (11Ag-) → S2 (11Bu+) transition of all-trans and central-cis-spheroidene were taken at a 4 ps delay time and are shown in Fig. 5D. The profiles have three peaks at 1090, 1260 and 1510 nm for the all-trans isomer, and like neurosporene, are red-shifted for the central-cis molecule to 1100, 1280 and 1535 nm.
The transient absorption spectra in the NIR of all-trans and central-cis-spirilloxanthin obtained at a 150 fs delay time are shown in Fig. 5E. The spectrum from all-trans-spirilloxanthin displays a maximum at 1250 nm which shifts to 1300 nm for central-cis-spirilloxanthin. Both spectra display a weak peak at 1460 nm and have a shoulder on the short wavelength side of the main band. The NIR transient absorption spectra taken at a 3 ps delay time for the all-trans isomer and at a 2 ps delay time for central-cis-spirilloxanthin reveal vibronic structure similar to that obtained for the other molecules, with three peaks at 1100, 1260 and 1510 nm for the all-trans isomer (solid line in Fig. 5F) which red-shift to 1110, 1290 and 1540 nm for central-cis-spirilloxanthin (dashed line in Fig. 5F).
Determination of the S1 (21Ag-) energies of the isomers
The difference between the energies of the S0 (11Ag-) → S2 (11Bu+) transition and the S1 (21Ag-) → S2 (11Bu+) transition yields the energy of the S1 (21Ag-) state of the molecule. The high resolution spectra taken at 77 K enhance the precision of this determination. Figure 6 shows the steady state S0 (11Ag-) → S2 (11Bu+) spectra (solid lines) of the all-trans and central-cis isomers overlaid with the S1 (21Ag-) → S2 (11Bu+) NIR transient absorption spectra (dashed lines) shifted on a wavenumber scale to maximize overlap of the lineshapes. The magnitude of the energy shift required to bring the two lineshapes into agreement corresponds to the value of the S1 (21Ag-) energy of the molecule. The data show that the S1 (21Ag-) energies of the central-cis isomers are uniformly higher than their corresponding all-trans isomers by 400-500 cm-1. The values of the S1 (21Ag-) energies are given in Fig. 6 and listed in Table 1 along with the values obtained previously for all-trans-spheroidene and all-trans-spirilloxanthin at room temperature. The present work provides the first determinations of the S1 (21Ag-) energies of cis-isomers of carotenoids.
Fig. 6.
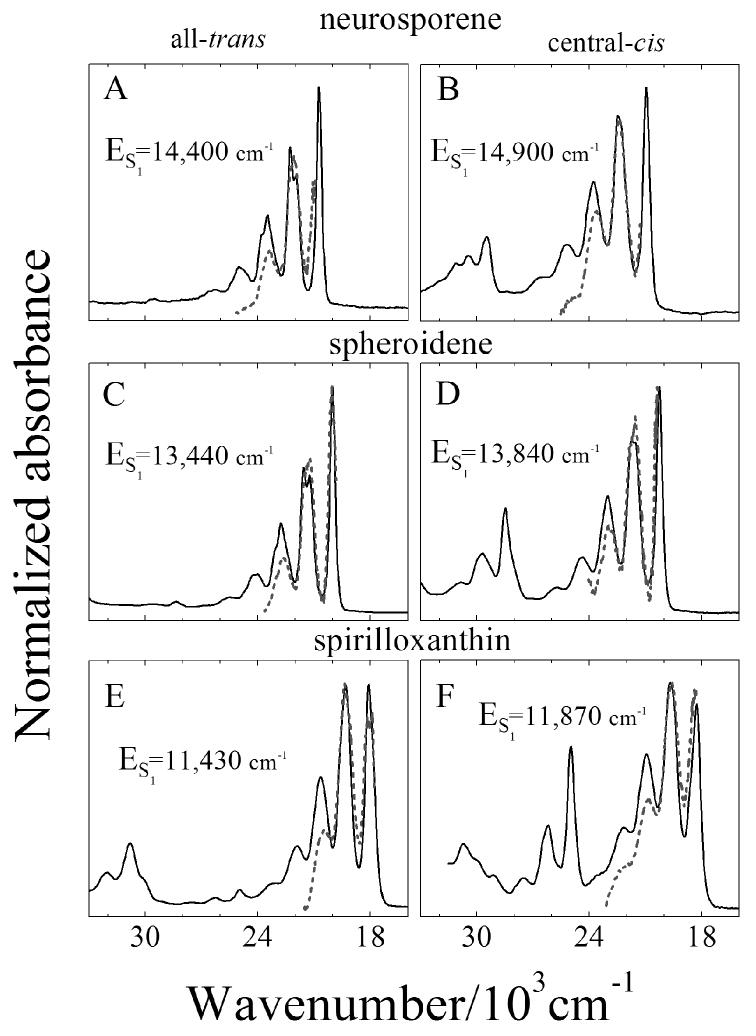
The S1 (21Ag-) → S2 (11Bu+) NIR transient absorption profiles (dashed lines) from Fig. 5 shifted in energy to give the best agreement with the steady-state absorption spectra (solid lines) from Fig. 2 plotted on a wavenumber scale. The magnitude of the shift of the S1 (21Ag-) → S2 (11Bu+) NIR spectra to bring the lineshapes into coincidence determines the energy of the S1 (21Ag-) state for each carotenoid isomer. These values are indicated in the figure and in Table 1.
Discussion
Spectroscopic features
The steady state absorption spectra shown in Fig. 2 exhibit highly resolved vibronic features most evident in low temperature mixed crystal solutions of the type studied here [54]. Previous investigations of model polyenes have revealed that the peaks are characterized by combinations of totally symmetric carbon-carbon single and double bond stretching modes of frequencies, ∼1200 and ∼1600 cm-1, that decrease with increasing conjugation [55,56]. For carotenoids the vibronic features corresponding to the single and double bond stretches often merge into progressions of bands having an intermediate frequencies. The absorption spectra of neurosporene and spheroidene (Figs. 2A and B) have their maximum intensity in the lowest energy (0-0) band. This most likely indicates a relatively small geometry change associated with the promotion of the molecule from the S0 (11Ag-) to the S2 (11Bu+) state. On the other hand, spirilloxanthin has almost equal intensity in its (0-0) and (0-1) bands for the all-trans isomer and has its maximum intensity in the (0-1) band for the central-cis isomer. This indicates a significant geometry change and shift in the minimum of the potential energy surface for spirilloxanthin in the S2 (11Bu+) state compared to the ground S0 (11Ag-) state. Also, from Fig. 2 it is evident that the spectra taken from the cis isomers are blue-shifted relative to those that taken from the all-trans isomers. The presence of a cis-bond within the π-electron conjugated chain may thus be thought of as decreasing its effective conjugation chain length which increases the S2 (11Bu+) energy of the cis isomer compared to the all-trans configuration [1].
The various transitions observed in the steady state and transient absorption spectra (Figs. 2, 3 and 5) and kinetically resolved in the global fitting analysis (Fig. 4) can be understood using the energy level diagram presented in Fig. 7. The all-trans isomers display strong steady-state S0 (11Ag-) → S2 (11Bu+), and transient S1 (21Ag-) → Sn and S1 (21Ag-) → S2 (11Bu+) absorption bands. The spectra of the central-cis isomers also display these transitions and, in addition, show S0 (11Ag-) → S3 (11Ag+) “cis-peaks” (Fig. 2). Interestingly, the EADS lineshapes of the central-cis isomers (Figs. 4B, D and G) show two strong transitions associated with the kinetic component assigned to the S1 (21Ag-) state lifetime. One of these transitions occurs as a shoulder on the short wavelength side of the second and strongest positive feature in the EADS amplitude spectra. For all three molecules, the shoulder appears at the precise wavelength where the transition occurs for the all-trans isomer. Upon first glance one might suspect that this may be due to some all-trans molecules being present in the central-cis sample, but absorption spectra taken before and after the transient experiments show this is not the case. Moreover, the dynamics of the features are significantly different for the all-trans configurations versus the central-cis molecules; e.g. 32.2 ps vs. 22 ps for all-trans- and central-cis-neurosoporene, respectively. This means that despite undergoing an all-trans to central-cis isomerization, the molecules retain some allowedness in the S1 (21Ag-) → Sn transition that occurs strongly in the all-trans spectra. The position and shape of the most prominent feature of the EADS component associated with the S1 (21Ag-) lifetime of the central-cis-isomers suggest it is due to a different S1 (21Ag-) → Sn transition, but with a broadened vibronic band structure. This transition is labeled S1 (21Ag-) → Sn′ in Fig. 7. It is observed that the spectral and temporal differences between the all-trans and central-cis molecules become less with increasing n. This is most likely due to the compression of electronic states leading to the coalescing of spectral features and kinetics as the π-electron conjugated chain length increases.
Fig.7.
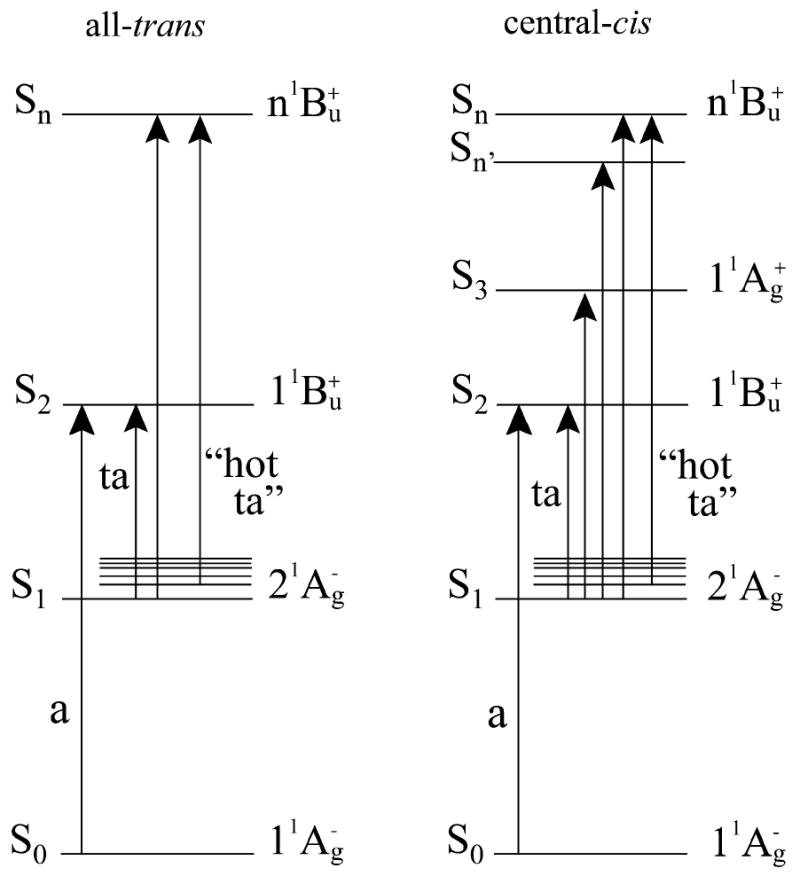
Energy level schematic of all-trans and central-cis carotenoids: a, absorption; ta transient absorption.
Transitions from a vibrationally “hot” S1 (21Ag-) state to a higher singlet state are also observed. This is clearly seen by taking a closer look at the lineshapes associated with the second EADS component shown in Fig. 4 (dashed lines). A magnified view of the 600 to 700 nm spectral region for the isomers of neurosporene and spheroidene is displayed in Fig. 8 (dashed lines) which reveals very clear peaks that are present only in the in the second EADS component. The energy separation between these small peaks appearing in these traces and the major transition displayed in the third EADS component (solid lines in Figs. 4A-E) is nearly constant for the all-trans and terminal-cis isomers of the molecules: 1788 cm-1 for all-trans-neurosporene; 1791 cm-1 for all-trans-spheroidene; and 1793 cm-1 for terminal-cis-spheroidene. Previous resonance Raman studies have shown that the vibronic bands in the absorption and fluorescence spectra of carotenoids are associated with totally symmetric C-C and C=C stretches of constant frequencies of ∼1200 and ∼1600 cm-1. Femtosecond time-resolved resonance Raman spectroscopy of all-trans-neurosporene and all-trans-spheroidene have shown that the frequency of C=C stretch increases to 1780 cm-1 and 1794 cm-1 as the molecules are promoted to the S1 (21Ag-) state [57,58]. The strong agreement between the vibronic assignments from the resonance Raman experiments and the energy separation between the resolved peaks in the transient absorption spectra taken at early times supports the view that these small bands are associated with transitions from an from upper vibronic (“hot”) level of S1 (21Ag) to a higher excited singlet state. In going from the all-trans configuration to a central-cis molecule, the energy separation between the major peaks and small bands increases by ∼100 cm-1. This reflects a small increase in the bond orders of the conjugated double bonds upon isomerization to the cis configuration.
Fig. 8.
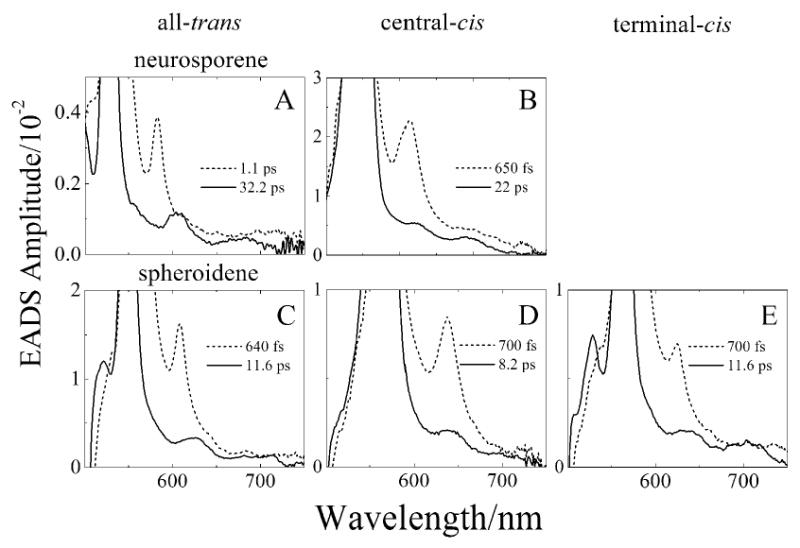
Enlarged view of the long wavelength region of the second and third EADS global fitting results from the analysis of the transient absorption spectra of the all-trans and central-cis neurosporene and spheroidene. See Fig. 4 for the full EADS lineshapes.
It is important to note that there is another set of small peaks appearing in the transient absorption spectra of neurosporene and spheroidene that are most evident in the expanded view of the longest lived EADS components from these molecules (solid lines in Fig. 8). These peaks appear after vibronic relaxation of the S1 (21Ag-) state. Summing the energies of these bands with the corresponding energy of the S1 (21Ag-) state (Fig. 6, Table 1) brings these features into close agreement with the cis-peaks in the steady state absorption spectra (Fig. S1). Thus, they are assigned to transient S1 (21Ag-) → S3 (11Ag+) transitions.
Lifetimes of the S1 (21Ag-) states
The present data reveal that the central-cis isomers of the carotenoids have shorter S1 (21Ag-) lifetimes than their all-trans counterparts confirming a previous report on β-carotene and locked-cis-spheroidene [31]. There are at least two plausible interpretations for this effect. The first is that the S1 (21Ag-) → S0 (11Ag-) radiative rate constant increases upon all-trans to central-cis isomerization. As an example, if one considers the change in the S1 (21Ag-) state lifetime of 11.6 ps to 8.2 ps in going from all-trans-spheroidene and central-cis-spheroidene (Table 1), the increase in radiative rate constant required to induce this change can be approximated by computing its value for the all-trans isomer from the equation, φf = krad · τ1 and comparing it with the value computed for the central-cis isomer. Using the quantum yield of S1 (21Ag-) emission φf = 10-7 from Fujii, et al. [45] for all-trans-spheroidene and the value, τ1 = 11.6 ps, obtained here, one finds krad = 8.6 × 10³ s-1. Using this value in the equation τ1 = (krad + knrad)−1, one obtains knrad = 8.6 × 10¹⁰ s-1 for all-trans spheroidene. Using this same value for knrad as an approximation for central-cis-spheroidene, an S1 (21Ag-) lifetime of 8.2 ps would yield krad = 3.6 × 10¹⁰ s-1. Plugging this value and the lifetime of 8.2 ps into the expression for the emission quantum yield of S1 (21Ag-) gives φf = 0.3 for the central-cis isomer. A comparison of the S1 (21Ag-) emission spectra of various isomers of carotenoids taken in our laboratory indicate they are all comparable in intensity with extremely low quantum (on the order of 10-7). Therefore, the shorter S1 (21Ag-) lifetime of central-cis compared to all-trans isomers of carotenoids is not consistent with a change in the rate of radiative decay upon isomerization.
The fact that deactivation of the S1 (21Ag-) excited states of carotenoids in solution occurs primarily via nonradiative means suggests that the process can be described by the energy gap law for radiationless transitions [59]. As previously discussed for carotenoids [60], the relevant form of the law assumes that the reduced displacement, ΔM, and depth, EM, of the minima in the potential energy surfaces corresponding to the electronic states involved in the transition is small compared to the energy gap, ΔE, between the states. In this so-called “weak-coupling” limit, the vibrational frequencies of the accepting modes, ħωM, are comparable to EM, and one obtains
| (1) |
where , knrad is the rate of radiationless decay between two states, C is the vibronic coupling matrix element, d is the number of degenerate or nearly degenerate modes of the frequency ωM, and ħωM is the energy of the accepting vibrational modes.
The shortening of the lifetime in going from the all-trans to the central-cis isomer may be due to changes in the displacement, ΔM, of the minima in the potential energy surfaces or it may be due to differences in the vibronic coupling matrix elements. A larger displacement for the cis isomer compared to the trans, evident in the absorption spectral profiles, would result in a smaller value of γ, and lead to a larger value of knrad for the cis isomer (Eq. 1). Isomer-specific configurational or conformational twisting of carotenoids in the S1 (21Ag-) state is not expected to be a significant factor in controlling nonradiative relaxation at the low temperature of the present experiments, and also based excited state resonance Raman spectroscopic experiments which do not reveal such activity [61]. However, modulation of vibronic couplings resulting from symmetric C-C or C=C stretching modes may be important [5,62,63]. Quantum computations provide a more rigorous analysis of the factors controlling nonradiative energy dissipation from S1 (21Ag-).
Calculation of internal conversion rates
The rates of internal conversion from the lowest 21Ag− covalent states of a linear C18 polyene (n=9) were calculated for the all-trans and central-cis configurations. These two molecules correspond to the linear, unsubstituted analogs of all-trans and central-cis neurosporene. The goal is to provide a quantitative explanation of why the central-cis configuration has a shorter lifetime than the all-trans configuration despite having a higher system origin energy.
This problem is approached by invoking Fermi's Golden Rule [64]:
| (2) |
where wif is the decay probability from the initial to the final state, Mif is the matrix element that describes the coupling of the initial and final states, and ρf is the density of final states. The lifetime of the initial (first excited singlet) state is given by the inverse of the decay probability:
| (3) |
For computational purposes, this equation is reconfigured so that it can be summed over individual contributions to the decay probability and each contribution can be weighed by the extent to which its total energy is in resonance with the initial state:
| (4) |
where the permutative sum is over all unique linear combinations of ground state vibrational modes that have total energies equal to, or near to, the energy of the system origin of the first excited singlet state. Although some implementations of Fermi's Golden rule make the assumption that the vibrational quanta must add up to exactly the final state energy, the present implementation allows for the effects of both inhomogeneity and computational error on the vibrational coupling. Thus, the density of states term is moved inside the sum and each permutation is weighted by its contribution to the total coupling between the initial (S1) and final (S0) states by:
| (5) |
where Γ is the inhomogeneous linewidth of the solute, is the system origin energy of the initial (excited singlet) state and Ev″ set is the total energy of the combined final (ground state) vibrational modes. The use of Eq. 5 serves two purposes. First it recognizes that molecules have a distribution of energies associated with inhomogeneity of the environment. The resulting inhomogeneity will allow different vibrational modes to couple to the excited state depending upon solvent dynamics. In this instance, Γ represents an the inhomogeneous linewidth appropriate for the solute in an inhomogeneous solvent environment. Second, Eq. 5 provides a convenient method of accommodating intrinsic error in the calculations. The ground and excited state vibrational manifolds were calculated using Hartree-Fock molecular orbital theory and a D95 basis set [65]. This choice is not optimal for vibrational analysis, but was necessary to allow calculation of the excited state properties using full single configuration interation (CIS). The calculated frequencies were scaled in both the ground and excited states using a scaling factor of 0.8883 which was calculated numerically by comparing RHF/D95 calculated frequencies with those calculated for the current molecules using properly scaled B3LYP/6-31G(d) methods scaled [66]. The analysis is presented in Fig. S2 in the supplementary section. The present theoretical treatment of the vibrational modes is only accurate to ± 200 cm-1 and the use of Eq. 5 provides a mechanism of handling this error in a reasonable way. A value of Γ = 400 cm-1 was adopted for a majority of these calculations, although other values were investigated to determine the sensitivity of the calculations to the value of this parameter (see below).
We now turn to the task of calculating the Franck-Condon terms and the vibrationally induced electronic coupling terms. Franck-Condon overlap integrals are difficult to calculate for large polyatomic molecules because the normal modes that are calculated for the equilibrium ground state are often modified in both frequency and mode vector composition upon excitation. This shift in the normal modes is often referred to as the Duschinsky effect (or Duschinsky rotation) and various methods have been proposed to handle the consequences [67-69]. Recently, Chang has proposed a new method of calculating Franck-Condon factors that is easily modified to handle those aspects of the Duschinsky effect associated with a change in the reduced mass of the normal mode upon excitation. The reduced mass of the ith vibrational mode is calculated by using the following formula:
| (6) |
where Dk,j is the (k,j)th element of the matrix that transforms the mass-weighted coordinates to the internal coordinates, Lj,i is the eigenvector matrix that diagonalizes the force constant matrix to yield the vibrational frequencies, and mj is the mass of the jth atom. The indices j and k are counting over each Cartesian component of each atom in the molecule where N is the total number of atoms and 3N is the total number of Cartesian displacements. The reduced mass of Eq. 6 is that which is printed out at the end of a frequency calculation in Gaussian. If the frequencies of the kth mode in the initial and final states are σi and σf, respectively, and the corresponding reduced masses of these modes are μi and μf, then the Duschinsky corrected displacement can be approximated by:
| (7) |
where the frequencies are in wavenumbers (cm-1) and the reduced masses are in amu. This displacement is then used in the calculation of the Franck-Condon factors using the numerical methods proposed by Chang [70]. The modified version includes the effect of changes in reduced mass on the overlap integral and the program, as implemented in MathScriptor, is presented in the Supplementary Section. In a large polyatomic molecule, the use of Eq. 7 requires that the vibrational modes in the ground and excited singlet states by accurately cross referenced, which is a non-trivial requirement when the equilibrium geometries of the ground and excited states are significantly different. This goal requires a mode-by-mode comparison of the normal mode vectors and is facilitated in the present study by the high symmetry (C2h or C2v) of the C18 polyene.
The vibrationally induced electronic coupling term, , was calculated using MNDO-PSDCI molecular orbital theory [71,72] and the following equation:
| (8) |
where v″σf is the frequency of the v″ th ground state mode, ΔEfi is the transition energy from the ground to the first excited singlet state at the ground state equilibrium geometry, ΔEfi (ΔQv″) is the analogous transition energy after displacement of the atoms to the “turning point” of the v″ th ground state mode, Ef is the ground state energy at its equilibrium geometry and Ef (ΔQv″) is the ground state energy when the molecule is displaced to the “turning point” of the v″ th ground state mode. Equation 8 was implemented using different theoretical methods to calculate the numerator and denominator of the last term. The numerator, which involves excited state energies, was evaluated by using MNDO-PSDCI molecular orbital theory [71-73]. The denominator, which involves ground state energies, was evaluated by using RHF/D95 methods within Gaussian 03 [74]. The normal modes (not mass-weighted) and the frequencies, v″σf, were also calculated by using RHF/D95 methods. The use of different procedures for the ground and excited state calculations is motivated by both expediency and accuracy. The MNDO-PSDCI semiempirical method is very reliable for the calculation of polyene electronic properties and by providing both single and double excitation within the π-system, the lowest-lying covalent state is properly described [71-73]. In the present case, these procedures calculate transition energies for the 11Bu+ state that are within 0.2 eV of the observed linear polyene absorption maxima. The procedures also predict a lowest-lying 21Ag− state, although the calculated splitting is smaller than that observed. Nevertheless, these procedures are adequate for the task of calculating the electronic coupling terms.
The excited state vibrational manifold for the 21Ag− was generated using RHF/D95 CIS methods. The CIS methods predict a lowest-lying 1Bu+ state, and a second excited 21Ag− state, and the latter was selected for both a high accuracy minimization and normal mode analysis. The 108 ground and excited state vibrations are sorted by symmetry and ordered so that the normal modes have optimal overlap. The coordinate shifts are calculated and the 72 ground and excited state vibrations with the largest shifts are collected for subsequent use in our calculation. These vibrations, and their Franck-Condon overlap integrals and electronic coupling terms are listed in Tables S1 and S2 of the supplementary section. The 16 vibrations that dominate the internal conversion processes of the all-trans and central-cis C18 polyene are listed in Tables 2 and 3. The five most important modes are shown in Fig. 9. These five modes have an optimal combination of electronic coupling and Franck-Condon overlap integrals that make them highly effective in depopulating the S1 state. However, other vibrations contribute in important ways (see below), and the fact that the central-cis polyene exhibits a higher internal conversion rate is due in large part to the participation of other modes. The interested reader can examine the properties of the 72 vibrations with observable coordinate shifts by reference to Tables S1 and S2 in the supplementary section. The contributions of these vibrations to the depopulation dynamics are explored in Figures 10 and 11, and discussed in more detail below.
Table 2.
Key ground state vibrational modes involved in the radiationless decay of the lowest-lying 21Ag- state of the all-trans C18 linear polyene.
| v″ | σf | sym | ||||
|---|---|---|---|---|---|---|
| cm-1 | C2h | cm-2 | cm-2 | |||
| 71 | 1649.3 | bu | 685.046 | 319.104 | ||
| 72 | 1655.1 | bu | 476.924 | 138.994 | ||
| 21 | 1633.8 | ag | 262.510 | 129.732 | ||
| 9 | 1124.0 | ag | 177.322 | 24.936 | ||
| 36 | 942.9 | au | 83.195 | 1.826 | ||
| 52 | 968.9 | bg | 57.727 | 3.559 | ||
| 8 | 1094.5 | ag | 46.316 | 31.891 | ||
| 31 | 432.3 | au | 41.721 | 7.635 | ||
| 29 | 222.0 | au | 30.481 | 8.098 | ||
| 32 | 649.6 | au | 29.233 | 5.054 | ||
| 69 | 1569.5 | bu | 26.545 | 13.369 | ||
| 44 | 237.5 | bg | 21.482 | 4.683 | ||
| 34 | 906.6 | au | 20.103 | 9.408 | ||
| 19 | 1547.8 | ag | 18.533 | 12.561 | ||
| 28 | 203.5 | au | 18.497 | 5.308 | ||
| 46 | 649.0 | bg | 16.792 | 2.725 | ||
| [above list] | 2012.429 | 718.883 | ||||
Table 3.
Key ground state vibrational modes involved in the radiationless decay of the lowest-lying 21Ag- state of the central-cis C18 linear polyene.
| v″ | σf | Sym | ||||
|---|---|---|---|---|---|---|
| cm-1 | C2v | cm-2 | cm-2 | |||
| 72 | 1654.5 | b2 | 701.422 | 230.917 | ||
| 71 | 1647.1 | b2 | 565.526 | 284.383 | ||
| 33 | 906.6 | a2 | 233.251 | 96.855 | ||
| 23 | 1636.2 | a1 | 203.370 | 115.032 | ||
| 11 | 1097.9 | a1 | 179.413 | 25.095 | ||
| 50 | 950.9 | b1 | 85.270 | 3.239 | ||
| 34 | 947.9 | a2 | 70.045 | 2.393 | ||
| 24 | 1639.2 | a1 | 53.967 | 4.476 | ||
| 70 | 1617.6 | b2 | 53.625 | 33.056 | ||
| 44 | 384.3 | b1 | 40.759 | 7.474 | ||
| 48 | 909.4 | b1 | 36.213 | 15.267 | ||
| 21 | 1542.2 | a1 | 34.951 | 25.804 | ||
| 60 | 1123.2 | b2 | 28.344 | 6.157 | ||
| 69 | 1569 | b2 | 26.298 | 12.854 | ||
| 59 | 1101.4 | b2 | 26.163 | 15.682 | ||
| 49 | 940.3 | b1 | 21.942 | 7.201 | ||
| [above list] | 2360.559 | 885.885 | ||||
Fig. 9.
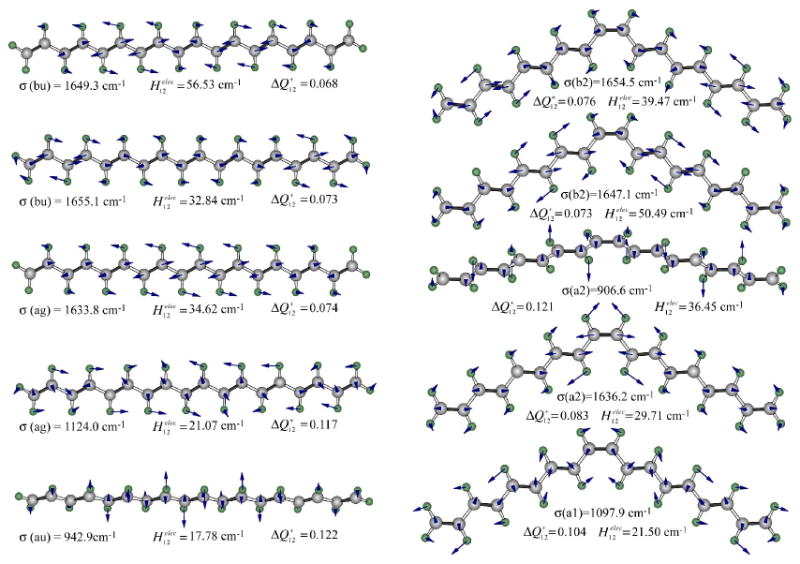
The key normal modes of all-trans C18 (left) and central-cis C18 (right) responsible for the radiationless decay of the lowest-lying 21Ag- singlet state. The dimensionless coordinate shift (ΔQ, Eq. 7) and the electronic coupling term (H, Eq. 8) are listed along with the vibrational frequency (σ), in wavenumbers.
Fig. 10.
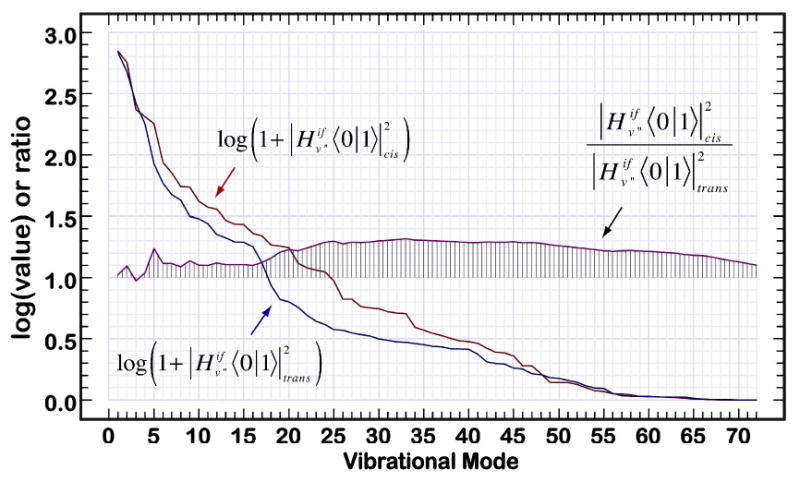
Analysis of the 72 most important ground state modes of C18 showing the log of the coupling product (Eq. 9) in wavenumbers squared and the ratio of coupling products for the mode fundamentals with reference to the 21Ag− excited state. The ratio of the rolling sum of these terms is shown in the central part of the plot with vertical lines delineating a unit ratio of 1.0. This plot indicates that the cis configuration of C18 will invariably couple more effectively to the ground state via radiationless processes in comparison to the all-trans configuration.
Fig 11.
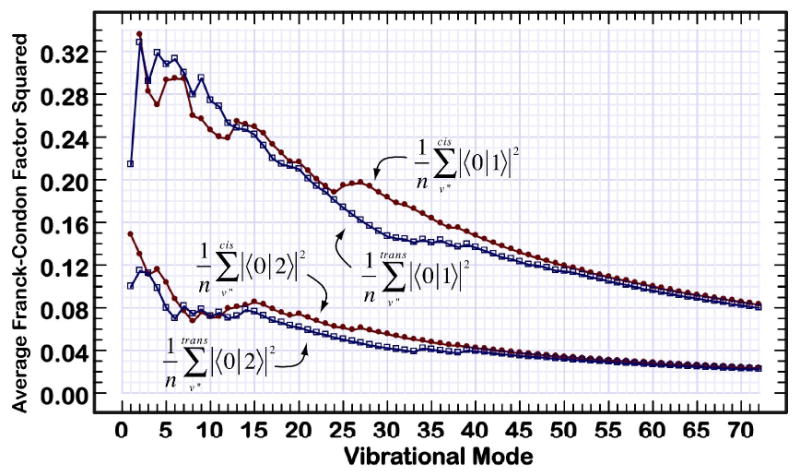
Average values of the Franck-Condon factors for the ground and first excited singlet states of central-cis and all-trans C18 polyene. The curves provide a rolling average of all vibrational modes up to and including the mode indicated, and the modes are listed in order of importance to coupling the two states via Eq. 4. The cis values are indicated with solid circles and the all-trans values are indicated with open squares.
What remains is to calculate the lifetime of the excited states. A program was written in MathScriptor that used the data in Tables S1 and S2 to generate permutations of vibrational levels using MonteCarlo methods. Each of the 72 vibrational modes was allowed to have 0, 1, 2 or 3 vibrational quanta. When a combination of ground state vibrations yielded a total energy within 2*Γ of the system origin energy of the target molecule, the ensemble was compared to a library of the previously accepted combinations. If identical to any, the ensemble was discarded. If new, the properties of the vibrational ensemble were calculated using Eq. 4 and added to the collection. The size of the collection was set prior to the calculation to be a value, N, between 10,000 and 20,000 (the effect of this variable on the outcome is examined in Table 4). Once N terms were accepted, the collection was sorted and new terms had to be larger than the smallest value to be added to the library. If the new rate was larger than the smallest rate in the sorted library, the ensemble was added to the library of accepted combinations and the smaller term it replaced discarded. This process continued until 3×10⁹ hits (ensemble energies within 2*Γ of the system origin energies) had been evaluated. We selected the maximum number of hits via trial and error noting that doubling it only increased our calculated rates by 5-11%. The results are presented in Table 4. The CPU intensive part of this simulation involves bookkeeping rather than the mathematics. A copy of the program is available upon request (rbirge@uconn.edu).
Table 4.
Comparison of the calculated lifetimes of the all-trans and central-cis C18 polyene with the observed lifetimes of the corresponding configurations of neurosporene.
| # | Assumptions(a) | τ(all-trans) (ps) |
τ(cis) (ps) |
||
|---|---|---|---|---|---|
| 0 | Neurosporene (Experimental) | 34.8 | 22.0 | 1.58 | |
| 1 | N=20,000; Γ=400 cm-1 | 70.0 | 36.8 | 1.90 | |
| 2 | N=15,000; Γ=400 cm-1 | 74.0 | 37.3 | 1.98 | |
| 3 | N=10,000; Γ=400 cm-1 | 84.7 | 42.5 | 1.99 | |
| 4 | N=10,000; Γ=800 cm-1 | 108 | 55.0 | 1.97 | |
| 5 | N=10,000; Γ=200 cm-1 | 86.1 | 40.1 | 2.15 | |
| 6 | N=10,000; Γ=50 cm-1 | 66.7 | 29.6 | 2.26 | |
| 7 | N=20,000; Γ=400 cm-1; | 84.5 | 25.9 | 3.26 | |
| 8 | N=10,000; Γ=400 cm-1; | 111 | 34.9 | 3.20 |
N is the number of unique ground state vibrational combinations evaluated in the calculation. Γ is the inhomogeneous linewidth used in Eq. 5. Other assumptions for calculations 1-6 include: system origin of all-trans C18 =14,400 cm-1, system origin of central-cis C18 =14,950 cm-1. Calculations 7 and 8 were carried out by arbitrarily setting the system origin energies of the initial states equal: cm-1.
A total of eight simulations were run to investigate the sensitivity of the calculations to the number of included configurations (N), the inhomogeneous linewidth (Γ) and the system origin energies. In all cases, the lifetime of the C18 central cis configuration was calculated to be shorter than the all-trans C18 configuration. The best calculation (simulation 1) gave a ratio of τ(all-trans)/τ(cis) = 1.90 in reasonable agreement with the observed value of 1.58 (top row). All lifetimes were calculated to be longer than the observed values, but this result is to be expected. These calculations were carried out on the linear polyene analog of neurosporene, and it is anticipated that the methyl groups and end groups would facilitate internal conversion by adding additional degrees of freedom. Furthermore, the present calculations are for vacuum conditions, and do not include the impact of solvent on the depopulation process. The consistent observation that the cis-isomer has a shorter lifetime can be traced to the enhanced electronic coupling terms observed for the majority of the vibrations (see Fig. 10) and for the most important vibrations in particular (Tables 3 and 4). The plots shown in Figure 10 examine the effect of configuration on the coupling product:
| (9) |
Although coupling products involving higher Franck-Condon factors also contribute, the product shown in Eq. 9 is the dominant term and higher order terms typically have similar or smaller values. Note that the vibrational modes displayed in Fig 10 have been sorted so that mode 1 has the highest coupling product and mode 72 the smallest. The two main plots are logarithmic and there is a nearly three orders of magnitude difference in the coupling efficiencies of the modes plotted in Fig. 10. The vertical bars in the center of the plot display a running sum of the ratios of the coupling products (cis over trans). As can be seen from an analysis of these plots, after the first five modes are included, the cis isomer is consistently more efficient in coupling to the ground state via radiationless processes. Not obvious from an analysis of Fig. 10 is the fact that differences in the electronic terms (Eq. 8) are the key to the effects displayed in Fig. 10. The Franck-Condon factors are of relatively minor importance in differentiating between the two isomers (Fig. 11), but these factors also slightly favor the cis-isomer depopulation dynamics.
Supplementary Material
Acknowledgments
This work is supported in the laboratory of HAF by the National Institutes of Health (GM-30353) and the University of Connecticut Research Foundation and in the laboratory of RRB by the National Institutes of Health (GM-34548).
Footnotes
Publisher's Disclaimer: This is a PDF file of an unedited manuscript that has been accepted for publication. As a service to our customers we are providing this early version of the manuscript. The manuscript will undergo copyediting, typesetting, and review of the resulting proof before it is published in its final citable form. Please note that during the production process errors may be discovered which could affect the content, and all legal disclaimers that apply to the journal pertain.
References
- 1.Isler O. Carotenoids. Birkhauser; Basel: 1971. [Google Scholar]
- 2.Frank HA, Young AJ, Britton G, Cogdell RJ. In: Advances in Photosynthesis. Govindjee, editor. Kluwer Academic Publishers; Dordrecht: 1999. [Google Scholar]
- 3.Britton G. In: Carotenoids. Britton G, Liaaen-Jensen S, Pfander H, editors. Birkhäuser Verlag; Basel: 1995. p. 13. [Google Scholar]
- 4.Zechmeister L. Cis-trans isomeric carotenoids, vitamin A, and arylpolyenes. Academic Press; New York: 1962. [Google Scholar]
- 5.Koyama Y, Fujii R. In: The Photochemistry of Carotenoids. Frank HA, Young AJ, Britton G, Cogdell RJ, editors. Kluwer Academic Publishers; Dordrecht: 1999. p. 161. [Google Scholar]
- 6.Hudson B, Kohler B. Ann Rev Phys Chem. 1974;25:437. [Google Scholar]
- 7.Hudson BS, Kohler BE, Schulten K. In: Excited States. Lim ED, editor. Academic Press; New York: 1982. p. 1. [Google Scholar]
- 8.Britton G, Liaaen-Jensen S, Pfander H. Handbook. Birkhäuser Verlag; Basel, Boston, Berlin: 2004. [Google Scholar]
- 9.Dale J. Acta Chemica Scandinavica. 1954;8:1235. [Google Scholar]
- 10.Kohler BE. In: Carotenoids. Britton G, Liaaen-Jensen S, Pfander H, editors. Vol. 3 Birkhäuser Verlag AG; Basel: 1995. [Google Scholar]
- 11.Hayashi H, Noguchi T, Tasumi M. Photochem Photobiol. 1989;49:337. [Google Scholar]
- 12.Koyama Y, Takatsuka I, Kanaji M, Tomimoto K, Kito M, Shimamura T, Yamashita J, Saiki K, Tsukida K. Photochem Photobiol. 1990;51:119. [Google Scholar]
- 13.Frank HA, Chynwat V, Hartwich G, Meyer M, Katheder I, Scheer H. Photosynth Res. 1993;37:193. doi: 10.1007/BF00032823. [DOI] [PubMed] [Google Scholar]
- 14.Frank HA, Cogdell RJ. In: Carotenoids in Photosynthesis. Young A, Britton G, editors. Springer-Verlag; London: 1993. p. 252. [Google Scholar]
- 15.Jordan P, Fromme P, Witt HT, Klukas O, Seanger W, Krauss N. Nature. 2001;411:909. doi: 10.1038/35082000. [DOI] [PubMed] [Google Scholar]
- 16.Boehm V, Puspitasari-Nienaber NL, Ferruzzi MG, Schwartz SJ. J Agric Food Chem. 2002;50:221. doi: 10.1021/jf010888q. [DOI] [PubMed] [Google Scholar]
- 17.Levy Y, Zaltsberg H, Ben-Amotz A, Kanter Y, Aviram M. Ann Nutr Metab. 2000;44:54. doi: 10.1159/000012821. [DOI] [PubMed] [Google Scholar]
- 18.Werman MJ, Mokady S, Ben-Amotz A. J Nutr Biochem. 2002;13:585. doi: 10.1016/s0955-2863(02)00210-3. [DOI] [PubMed] [Google Scholar]
- 19.Kuki M, Naruse M, Kakuno T, Koyama Y. Photochem Photobiol. 1995;62:502. [Google Scholar]
- 20.Hashimoto H, Koyama Y. J Phys Chem. 1988;92:2101. [Google Scholar]
- 21.Boucher F, Gingras G. Photochem Photobiol. 1984;40:277. [Google Scholar]
- 22.Koyama Y. Spectrosc Biol Mol, Eur Conf, 6th. 1995:183. [Google Scholar]
- 23.Bautista JA, Chynwat V, Cua A, Jansen FJ, Lugtenburg J, Gosztola D, Wasielewski MR, Frank HA. Photosyn Res. 1998;55:49. [Google Scholar]
- 24.Pendon ZD, v d Hoef I, Lugtenburg J, Frank HA. Photosynth Res. 2006;88:51. doi: 10.1007/s11120-005-9026-8. [DOI] [PubMed] [Google Scholar]
- 25.Schiedt K, Liaaen-Jensen S. Carotenoids. Birkhäuser Verlag; Basel, Boston, Berlin: 1995. [Google Scholar]
- 26.Niedzwiedzki D, Koscielecki JF, Cong H, Sullivan JO, Gibson GN, Birge RR, Frank HA. J Phys Chem B. 2007;111:5984. doi: 10.1021/jp070500f. [DOI] [PubMed] [Google Scholar]
- 27.Ilagan RP, Christensen RL, Chapp TW, Gibson GN, Pascher T, Polivka T, Frank HA. J Phys Chem A. 2005;109:3120. doi: 10.1021/jp0444161. [DOI] [PubMed] [Google Scholar]
- 28.Jiang YS, Kurimoto Y, Shimamura T, Ko-Chi N, Ohashi N, Mukai Y, Koyama Y. Biospectroscopy. 1996;2:47. [Google Scholar]
- 29.Pendon ZD, Sullivan JO, van der Hoef I, Lugtenburg J, Cua A, Bocian DF, Birge RR, Frank HA. Photosynth Res. 2005;86:5. doi: 10.1007/s11120-005-1205-0. [DOI] [PubMed] [Google Scholar]
- 30.van Stokkum IHM, Larsen DS, van Grondelle R. Biochim Biophys Acta. 2004;1657:82. doi: 10.1016/j.bbabio.2004.04.011. [DOI] [PubMed] [Google Scholar]
- 31.Pendon ZD, Gibson GN, van der Hoef I, Lugtenburg J, Frank HA. J Phys Chem B. 2005;109:21172. doi: 10.1021/jp0529117. [DOI] [PubMed] [Google Scholar]
- 32.Niedzwiedzki DM, Sullivan JO, Polivka T, Birge RR, Frank HA. J Phys Chem B. 2006;110:22872. doi: 10.1021/jp0622738. [DOI] [PubMed] [Google Scholar]
- 33.Billsten HH, Bhosale P, Yemelyanov A, Bernstein PS, Polivka T. Photochem Photobiol. 2003;78:138. doi: 10.1562/0031-8655(2003)078<0138:ppoxic>2.0.co;2. [DOI] [PubMed] [Google Scholar]
- 34.Billsten HH, Sundström V, Polívka T. J Phys Chem A. 2005;109:1521. doi: 10.1021/jp044847j. [DOI] [PubMed] [Google Scholar]
- 35.Wohlleben W, Buckup T, Hashimoto H, Cogdell RJ, Herek JL, Motzkus M. J Phys Chem B. 2004;108:3320. [Google Scholar]
- 36.Wohlleben W, Buckup T, Herek JL, Cogdell RJ, Motzkus M. Biophys J. 2003;85:442. doi: 10.1016/S0006-3495(03)74489-0. [DOI] [PMC free article] [PubMed] [Google Scholar]
- 37.Larsen DS, Papagiannakis E, van Stokkum IHM, Vengris M, Kennis JTM, van Grondelle R. Chem Phys Lett. 2003;381:733. [Google Scholar]
- 38.Papagiannakis E, van Stokkum IH, Vengris M, Cogdell RJ, van Grondelle R, Larsen DS. J Phys Chem B. 2006;110:5727. doi: 10.1021/jp054633h. [DOI] [PubMed] [Google Scholar]
- 39.Frank HA, Bautista JA, Josue J, Pendon Z, Hiller RG, Sharples FP, Gosztola D, Wasielewski MR. J Phys Chem B. 2000;104:4569. [Google Scholar]
- 40.Billsten HH, Zigmantas D, Sundström V, Polívka T. Chem Phys Lett. 2002;355:465. [Google Scholar]
- 41.Billsten HH, Pan J, Sinha S, Pascher T, Sundström V, Polívka T. J Phys Chem A. 2005;109:6852. doi: 10.1021/jp052227s. [DOI] [PubMed] [Google Scholar]
- 42.Polli D, Cerullo G, Lanzani G, De Silvestri S, Hashimoto H, Cogdell RJ. Synthetic Metals. 2003;139:893. [Google Scholar]
- 43.Polívka T, Sundström V. Chem Rev. 2004;104:2021. doi: 10.1021/cr020674n. [DOI] [PubMed] [Google Scholar]
- 44.Polívka T, Herek JL, Zigmantas D, Akerlund HE, Sundström V. Proc Nat Acad Sci USA. 1999;96:4914. doi: 10.1073/pnas.96.9.4914. [DOI] [PMC free article] [PubMed] [Google Scholar]
- 45.Fujii R, Onaka K, Kuki M, Koyama Y, Watanabe Y. Chem Phys Lett. 1998;288:847. [Google Scholar]
- 46.Zhang JP, Inaba T, Watanabe Y, Koyama Y. Chem Phys Lett. 2000;332:351. [Google Scholar]
- 47.Frank HA, Farhoosh R, Gebhard R, Lugtenburg J, Gosztola D, Wasielewski MR. Chem Phys Lett. 1993;207:88. [Google Scholar]
- 48.Polívka T, Zigmantas D, Herek JL, Bautista JA, Frank HA, Sundström V. Springer Ser Chem Phys. 2001;66:668. [Google Scholar]
- 49.Polívka T, Zigmantas D, Frank HA, Bautista JA, Herek JL, Koyama Y, Fujii R, Sundström V. J Phys Chem B. 2001;105:1072. [Google Scholar]
- 50.Nishimura K, Rondonuwu FS, Fujii R, Akahane J, Koyama Y, Kobayashi T. Chem Phys Lett. 2004;392:68. [Google Scholar]
- 51.Fujii R, Inaba T, Watanabe Y, Koyama Y, Zhang JP. Chem Phys Lett. 2003;369:165. [Google Scholar]
- 52.Gradinaru CC, Kennis JTM, Papagiannakis E, van Stokkum IHM, Cogdell RJ, Fleming GR, Niederman RA, van Grondelle R. Proc Natl Acad Sci USA. 2001;98:2364. doi: 10.1073/pnas.051501298. [DOI] [PMC free article] [PubMed] [Google Scholar]
- 53.Okamoto H, Ogura M, Nakabayashi T, Tasumi M. Chem Phys. 1998;236:309. [Google Scholar]
- 54.Simpson JH, McLaughlin L, Smith DS, Christensen RL. J Chem Phys. 1987;87:3360. [Google Scholar]
- 55.Christensen RL. In: The Photochemistry of Carotenoids. Frank HA, Young AJ, Britton G, Cogdell RJ, editors. Kluwer Academic Publishers; Dordrecht: 1999. p. 137. [Google Scholar]
- 56.Christensen RL, Barney EA, Broene RD, Galinato MGI, Frank HA. Arch Biochem Biophys. 2004;430:30. doi: 10.1016/j.abb.2004.02.026. [DOI] [PubMed] [Google Scholar]
- 57.Rondonuwu FS, Kakitani Y, Tamura H, Koyama Y. Chem Phys Lett. 2006;429:234. [Google Scholar]
- 58.Rondonuwu FS, Watanabe Y, Zhang JP, Furuichi K, Koyama Y. Chem Phys Lett. 2002;357:376. [Google Scholar]
- 59.Englman R, Jortner J. Mol Phys. 1970;18:145. [Google Scholar]
- 60.Chynwat V, Frank HA. Chem Phys. 1995;194:237. [Google Scholar]
- 61.Hashimoto H, Koyama Y, Hirata Y, Mataga N. J Phys Chem. 1991;95:3072. [Google Scholar]
- 62.Nagae H, Kuki M, Zhang JP, Sashima T, Mukai Y, Koyama Y. J Phys Chem A. 2000;104:4155. [Google Scholar]
- 63.Hashimoto H, Koyama Y. Chem Phys Lett. 1989;154:321. [Google Scholar]
- 64.Dirac PAM. Proc Royal Society London Series A. 1927;114:243. [Google Scholar]
- 65.Dunning TH, Jr, Hay PJ. In: Modern Theoretical Chemistry. Schaefer HF, editor. Plenum; New York, New York: 1976. p. 1. [Google Scholar]
- 66.Scott AP, Radom L. J Phys Chem. 1996;100:16502. [Google Scholar]
- 67.Reimers JR. The Journal of Chemical Physics. 2001;115:9103. [Google Scholar]
- 68.Myers AB, Pranata KS. The Journal of Physical Chemistry. 1989;93:5079. [Google Scholar]
- 69.Peng Q, Yi Y, Shuai Z, Shao J. The Journal of Chemical Physics. 2007;126:114302. doi: 10.1063/1.2710274. [DOI] [PubMed] [Google Scholar]
- 70.Chang JL. J Molecular Spectroscopy. 2005;232:102. [Google Scholar]
- 71.Martin CH, Birge RR. J Phys Chem A. 1998;102:852. [Google Scholar]
- 72.Ren L, Martin CH, Wise KJ, Gillespie NB, Luecke H, Lanyi JK, Spudich JL, Birge RR. Biochem. 2001;40:13906. doi: 10.1021/bi0116487. [DOI] [PubMed] [Google Scholar]
- 73.Shima S, Ilagan RP, Gillespie N, Sommer BJ, Hiller RG, Sharples FP, Frank HA, Birge RR. J Phys Chem A. 2003;107:8052. [Google Scholar]
- 74.M. J. Frisch, G. W. Trucks, H. B. Schlegel, G. E. Scuseria, M. Robb, J. R. Cheeseman, Montgomery Jr., T. Vreven, K. N. Kudin, J. C. Burant, J. M. Millam, S. S. Iyengar, J. Tomasi, V. Barone, B. Mennucci, M. Cossi, G. Scalmani, N. Rega, G. A. Petersson, H. Nakatsuji, M. Hada, M. Ehara, K. Toyota, R. Fukuda, J. Hasegawa, M. Ishida, T. Nakajima, Y. Honda, O. Kitao, H. Nakai, M. Klene, X. Li, J. E. Knox, H. P. Hratchian, J. B. Cross, C. Adamo, J. Jaramillo, R. Gomperts, R. E. Stratmann, O. Yazyev, A. J. Austin, R. Cammi, C. Pomelli, J. Ochterski, P. Y. Ayala, K. Morokuma, G. A. Voth, P. Salvador, J. J. Dannenberg, V. G. Zakrzewski, S. Dapprich, A. D. Daniels, M. C. Strain, O. Farkas, D. K. Malick, A. D. Rabuck, K. Raghavachari, J. B. Foresman, J. V. Ortiz, Q. Cui, A. G. Baboul, S. Clifford, J. Cioslowski, B. B. Stefanov, G. Liu, A. Liashenko, P. Piskorz, I. Komaromi, R. L. Martin, D. J. Fox, T. A. Keith, M. A. Al-Laham, C. Y. Peng, A. Nanayakkara, M. Challacombe, P. M. W. Gill, B. Johnson, W. Chen, M. W. Wong, C. Gonzalez, J. A. Pople, (2003).
- 75.Rondonuwu FS, Watanabe Y, Fujii R, Koyama Y. Chem Phys Lett. 2003;376:292. [Google Scholar]
- 76.Papagiannakis E, van Stokkum IHM, van Grondelle R. J Phys Chem B. 2003;107:11216. [Google Scholar]
- 77.Fujii R, Ishikawa T, Koyama Y, Taguchi M, Isobe Y, Nagae H, Watanabe Y. J Phys Chem A. 2001;105:5348. [Google Scholar]
Associated Data
This section collects any data citations, data availability statements, or supplementary materials included in this article.


