

Abstract
We used a new method we developed for automated hippocampal segmentation, called the auto context model, to analyze brain MRI scans of 400 subjects from the Alzheimer's disease neuroimaging initiative. After training the classifier on 21 hand‐labeled expert segmentations, we created binary maps of the hippocampus for three age‐ and sex‐matched groups: 100 subjects with Alzheimer's disease (AD), 200 with mild cognitive impairment (MCI) and 100 elderly controls (mean age: 75.84; SD: 6.64). Hippocampal traces were converted to parametric surface meshes and a radial atrophy mapping technique was used to compute average surface models and local statistics of atrophy. Surface‐based statistical maps visualized links between regional atrophy and diagnosis (MCI versus controls: P = 0.008; MCI versus AD: P = 0.001), mini‐mental state exam (MMSE) scores, and global and sum‐of‐boxes clinical dementia rating scores (CDR; all P < 0.0001, corrected). Right but not left hippocampal atrophy was associated with geriatric depression scores (P = 0.004, corrected); hippocampal atrophy was not associated with subsequent decline in MMSE and CDR scores, educational level, ApoE genotype, systolic or diastolic blood pressure measures, or homocysteine. We gradually reduced sample sizes and used false discovery rate curves to examine the method's power to detect associations with diagnosis and cognition in smaller samples. Forty subjects were sufficient to discriminate AD from normal and correlate atrophy with CDR scores; 104, 200, and 304 subjects, respectively, were required to correlate MMSE with atrophy, to distinguish MCI from normal, and MCI from AD. Hum Brain Mapp 2009. © 2009 Wiley‐Liss, Inc.
Keywords: hippocampus, automated segmentation, ADNI
INTRODUCTION
Alzheimer's disease (AD) is the most common form of dementia, affecting over 24 million people worldwide and over 5 million in the U.S. alone [Jorm et al.1987]. As the disease progresses, there is a relentless decline in memory function, which progresses to impair language, attention, orientation, visuospatial skills, and executive function. Imaging research has focused on detecting the earliest signs of dementia, either by visualizing the characteristic pathology of plaques and neurofibrillary tangles as they accumulate in the living brain [Braskie et al., in press] or by measuring the resulting neuronal loss observable on brain MRI as cortical and hippocampal atrophy [Thompson and Apostolova,2008].
As drug candidates that might slow the progression of Alzheimer's pathology have begun to be developed, the need to develop robust and sensitive imaging methods to quantify progression of Alzheimer's disease has become increasingly important. To this end, the National Institute of Aging and the pharmaceutical industry funded the Alzheimer's disease neuroimaging initiative (ADNI), with the goal of developing improved methods based on imaging and other biomarkers, for AD treatment trials. A variety of methods have been used to quantify structural deficits in brain MRI including: region‐of‐interest measurements (especially of the hippocampus [Frisoni et al.,1999]), the “boundary shift integral” technique which quantifies differences between two successively coregistered 3D MRIs [Fox et al.,2000], cortical thickness mapping [Burggren et al.,2008; Lerch et al.,2008; Salat et al.,2004; Thompson et al.,2004a], voxel‐based morphometry [Good et al.,2001; Whitwell et al., 2007], and tensor‐based morphometry [Hua et al.,2008; Studholme et al.,2004,2006; Thompson and Apostolova,2008].
Because of the need to combat the disease before neuronal loss is substantial, scientific interest has also focused on mild cognitive impairment (MCI), a predementia stage that carries a 4–6‐fold increased risk of future diagnosis of dementia, relative to the general population [Petersen,2000; Petersen et al.,1999,2001]. At this stage of the illness, molecular pathology and structural atrophy are most prevalent in the hippocampus and adjacent entorhinal cortex. A common biological marker of disease progression in MCI is morphological change in the hippocampus, assessed using volumetric measures [Jack et al.,1999; Kantarci and Jack,2003] or by mapping the spatial distribution of atrophy in 3D [Apostolova et al.,2006a,b; Csernansky et al.,1998; Frisoni et al.,2006; Thompson et al.,2004a].
Parametric surface reconstruction and modeling (hippocampal radial mapping) [Scher et al.,2007b; Thompson et al.,2004a; Xu et al.,2008] visualizes the profile of hippocampal tissue loss in 3D, showing that subregional hippocampal atrophy spreads in a pattern that follows the known trajectory of neurofibrillary tangle dissemination [Becker et al.,2006; Frisoni et al.,2006]. Distinct atrophic profiles have also been associated with those MCI subjects who imminently convert to AD versus those who do not [Apostolova et al.,2006b], and with other dementias such as Lewy Body and fronto‐temporal dementia [Sabattoli et al.,2008].
For all such studies, isolating the hippocampus in a large number of MRI scans is time‐consuming, and most studies still rely on manual outlining guided by expert knowledge of the location and shape of each region of interest (ROI) [Apostolova et al.,2006a; Du et al.,2001]. To accelerate epidemiological studies and clinical trials, this process should be automated. Some automated systems have been proposed for hippocampal segmentation [Barnes et al.,2004; Crum et al.,2001; Fischl et al.,2002; Hogan et al.,2000; Powell et al.,2008; Wang et al.,2007; Yushkevich et al.,2006], but none is yet widely used.
Here, we use a fully automated segmentation approach that we recently developed [Morra et al.,2008a,b,c,d], called the auto context model (ACM), which is based on a well‐known machine learning approach AdaBoost [Schapire et al.,1998]. For an overview of the methodology and validation please refer to an in‐press paper located at http://www.loni.ucla.edu/~thompson/PDF/JMorra-MICCAI08.pdf [Morra et al.,2008b]. As ACM can accurately segment the hippocampus, we were interested in using it to assess factors that affect hippocampal morphology in a large database. ACM is a pattern recognition based approach [Duda et al.,2001], and as such it requires a training set and a testing set. For training, we used 21 hand labeled hippocampi, and we tested the approach on 400 other subjects. All results in this article are only for the 400 testing subjects. After using ACM to segment the hippocampus on our 400 test subjects, we then applied a statistical mapping approach based on parametric surface meshes [Bansal et al.,2007; Csernansky et al.,1998; Styner et al.,2000; Thompson et al.,2004a; Wang et al.,2007]. We used these statistical maps to answer several biological questions regarding AD. We tested the following hypotheses: (1) that spatial maps would reveal systematic patterns of hippocampal differences between large groups of AD, MCI, and healthy elderly subjects, and factors that affect atrophy; (2) that MCI subjects who deteriorated and developed AD during a 1‐year follow‐up period would show greater atrophy than those who did not; and (3) that there would be greater hippocampal atrophy in carriers of the ApoE4 (apolipoprotein E4) allele that confers heightened risk for AD [Roses et al.,1995] versus noncarriers. To confirm the clinical relevance of these anatomical measures, we hypothesized that there would be correlations between hippocampal atrophy and several widely used measures of brain function (Mini‐Mental State Exam (MMSE) and Clinical Dementia Rating global scores, and sum‐of‐boxes scores). We correlated baseline hippocampal atrophy with subsequent clinical decline over a 1‐year follow‐up period. To examine factors influencing the disease process, we also correlated hippocampal atrophy with depression severity, educational level, cardiovascular measures (systolic and diastolic blood pressure), and serum measures. Finally, to evaluate the statistical power of our mapping methods and provide practical information for users of this technique, we gradually reduced the sample size to determine how many subjects would be required, in future studies, to detect associations between hippocampal atrophy and each of our clinical, behavioral, and genetic measures.
METHODS
Subjects
The ADNI [Mueller et al.,2005a,b] is a large multisite longitudinal MRI and FDG‐PET (fluorodeoxyglucose positron emission tomography) study of 800 adults, ages 55 to 90, including 200 elderly controls, 400 subjects with mild cognitive impairment, and 200 patients with AD. The ADNI was launched in 2003 by the National Institute on Aging (NIA), the National Institute of Biomedical Imaging and Bioengineering (NIBIB), the food and drug administration (FDA), private pharmaceutical companies and nonprofit organizations, as a $60 million, 5‐year public‐private partnership. The primary goal of ADNI has been to test whether serial MRI, PET, other biological markers, and clinical and neuropsychological assessment can be combined to measure the progression of MCI and early AD. Determination of sensitive and specific markers of very early AD progression is intended to aid researchers and clinicians to develop new treatments and monitor their effectiveness, as well as lessen the time and cost of clinical trials. The Principal Investigator of this initiative is Michael W. Weiner, M.D., VA Medical Center and University of California, San Francisco.
All subjects underwent thorough clinical/cognitive assessment at the time of scan acquisition. As part of each subject's cognitive evaluation, the MMSE was administered to provide a global measure of cognitive status based on evaluation of five cognitive domains [Cockrell and Folstein,1988; Folstein et al.,1975]; scores of 24 or less (out of a maximum of 30) are generally consistent with dementia. Two versions of the Clinical Dementia Rating (CDR) were also used as a measure of dementia severity [Hughes et al.,1982; Morris,1993]. The global CDR represents the overall level of dementia and a global CDR of 0, 0.5, 1, 2, and 3, respectively, indicate no dementia, very mild, mild, moderate, or severe dementia. The “sum‐of‐boxes” CDR score is the sum of six scores assessing different areas of cognitive function: memory, orientation, judgment and problem solving, community affairs, home and hobbies, and personal care. The sum of these scores ranges from 0 (no dementia) to 18 (very severe dementia). Table I shows the clinical scores and demographic measures for our sample. The elderly normal subjects in our sample had MMSE scores between 26 and 30, a global CDR of 0, a sum‐of‐boxes CDR between 0 and 0.5, and no other signs of MCI or other forms of dementia. The MCI subjects had MMSE scores ranging from 24 to 30, a global CDR of 0.5, a sum‐of‐boxes CDR score between 0.5 and 5, and mild memory complaints. Memory impairment was assessed via education‐adjusted scores on the Wechsler Memory Scale—Logical Memory II [Wechsler,1987]. All AD patients met NINCDS/ADRDA criteria for probable AD [McKhann et al.,1984] with an MMSE score between 20 and 26, a global CDR between 0.5 and 1, and a sum‐of‐boxes CDR between 1.0 and 9.0. As such, these subjects would be considered as having mild, but not severe, AD. Detailed exclusion criteria, for example, regarding concurrent use of psychoactive medications, may be found in the ADNI protocol (page 29, http://www.adni-info.org/images/stories/Documentation/adni_protocol_03.02.2005_ss.pdf). Briefly, subjects were excluded if they had any serious neurological disease other than incipient AD, any history of brain lesions or head trauma, or psychoactive medication use (including antidepressants, neuroleptics, chronic anxiolytics or sedative hypnotics, etc.).
Table I.
Demographic data are shown for several of the covariates tested throughout this article, with standard deviations in parentheses
| N | Males/females | Age (years) | MMSE | Global CDR | Sum of boxes CDR | MMSE change | Global CDR change | |
|---|---|---|---|---|---|---|---|---|
| Normal | 100 | 47/53 | 76.62 (4.83) | 29.14 (0.86) | 0 (0) | 0.015 (0.086) | −0.14 (1.42) | 0.053 (0.15) |
| MCI | 200 | 100/100 | 75.45 (7.03) | 26.94 (1.86) | 0.5 (0)a | 1.48 (0.84)a | −1.21 (2.88)a | 0.048 (0.23) |
| AD | 100 | 50/50 | 75.86 (7.25) | 23.41 (1.86) | 0.78 (0.25)a | 4.48 (1.56)a | −2.62 (4.57)a | 0.19 (0.53) |
| Sum of boxes CDR change | Change in diagnosis | ApoE4 (%) | Years of education | Systolic blood pressure (mmHg) | Diastolic blood pressure (mmHg) | Homocysteine (μM/L) | GD scale | |
| Normal | 0.11 (0.41) | 1 | 32 | 15.87 (1.84) | 137.9 (18.80) | 76.19 (9.52) | 9.27 (2.56) | 0.79 (1.11) |
| MCI | 0.80 (1.36)a | 26/−2 | 53.5 | 15.61 (3.16) | 135.5 (17.31) | 74.55 (11.01) | 10.39 (2.87)a | 1.58 (1.39)a |
| AD | 1.53 (2.17)a | −2 | 66 | 14.96 (3.31)b | 137.51 (17.02) | 75.22 (10.64) | 10.13 (3.09)b | 1.74 (1.42)a |
P < 0.01.
P < 0.05.
Only statistics for the subjects in the test set are reported because those are the brains used to obtain the clinical results presented throughout the article. All changes in scores refer to changes measured over a one‐year interval following the baseline MRI scans. For the change in diagnosis, entries represent the number of subjects that converted to that diagnosis (positive entries indicate a diagnosis moving to the next level of disease and negative entries indicate a downgrade of one level in diagnosis). For the sub‐analysis of subjects who changed diagnosis, only those who converted from MCI to AD were examined here because there were fewer than 3 subjects who underwent conversions of other types (e.g., MCI to normal). Presence of the ApoE4 allele, a risk gene for AD, may be modeled as a binary characteristic, so this column represents the number, as a percentage of the total N for that group that carry at least one copy of the ApoE4 allele. P‐values were determined only for the testing MCI and AD groups versus the testing normal group. Throughout the article, all P‐values were obtained from a two sided t‐test.
Throughout this article, we show whether or not a linkage exists between hippocampal morphology and different covariates of interest, including diagnosis (normal, MCI, AD), MMSE, global CDR, sum‐of‐boxes CDR, change (over 1 year) in diagnosis, change in MMSE, change in global CDR, change in sum of boxes CDR, the ApoE genotype, depression severity assessed using the GD (geriatric depression) scale [Yesavage et al.,1982], systolic and diastolic blood pressure, plasma homocysteine level, and educational level. Based on the available data at the time of writing, only baseline scans were analyzed, to maximize the sample size, but predictions of changes in clinical scores during the year after the baseline scan were also assessed, where available.
The study was conducted according to Good Clinical Practice, the Declaration of Helsinki and U.S. 21 CFR Part 50‐Protection of Human Subjects, and Part 56‐Institutional Review Boards. Written informed consent for the study was obtained from all participants before protocol‐specific procedures, including cognitive testing, were performed.
Training and Testing Set Descriptions
As noted earlier, when using a pattern recognition approach to identify structures in images, two nonoverlapping sets of images must be defined, for training and testing [Powell et al.,2008, Morra et al.,2008c]. The training set consists of a small sample of brain images, representative of the entire dataset, which are manually traced by experts. The testing set is a group of brain images that are to be segmented by the algorithm but have not been used for training the algorithm. Our training set consisted of 21 brain images, from seven healthy elderly individuals, seven individuals with MCI, and seven individuals with AD, and our testing set consisted of 100 healthy individuals, 200 individuals with MCI, and 100 individuals with AD. We chose to train on 21 subjects because this number was sufficient in previous studies that varied the training sample size [Morra et al., 2008]; smaller training sets degraded segmentation performance. We used 400 testing brains, in three diagnostic groups whose size matched the expected proportions that the final ADNI sample will have, once all the data has been acquired. Each of the three groups (AD, MCI, and controls) was age‐ and gender‐matched as closely as possible as shown in Table I.
To visualize the demographics of the dataset used in our experiments, Figure 1 gives an illustration of all subjects in the testing group broken down by age, sex, and diagnosis. The sex distribution with respect to age is comparable, but there is slightly higher variance in age in the MCI and AD groups.
Figure 1.
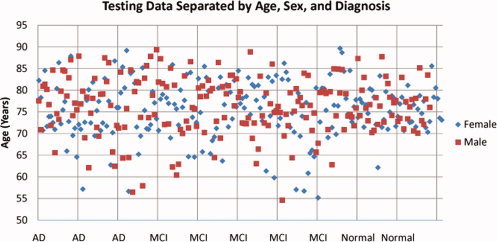
A visual representation of the testing data set. This plot shows a breakdown of all subjects by age, sex, and diagnosis. The points have been spread out along the horizontal axis to make it easier to see members of each diagnostic group. [Color figure can be viewed in the online issue, which is available at www.interscience.wiley.com.]
MRI Acquisition and Preprocessing
All subjects were scanned with a standardized MRI protocol, developed after a major effort evaluating and comparing 3D T1‐weighted sequences for morphometric analyses [Jack et al.,2008; Leow et al.,2006].
High‐resolution structural brain MRI scans were acquired at multiple ADNI sites using 1.5 Tesla MRI scanners manufactured by General Electric Healthcare, Siemens Medical Solutions, and Philips Medical Systems. ADNI also collects data at 3.0 T from a subset of subjects, but to avoid having to model field strength effects in this initial study, only 1.5 T images were used. All scans were collected according to the standard ADNI MRI protocol (http://www.loni.ucla.edu/ADNI/Research/Cores/index.shtml). For each subject, two T1‐weighted MRI scans were collected using a sagittal 3D MP‐RAGE sequence. Typical 1.5 T acquisition parameters are repetition time (TR) of 2,400 ms, minimum full excitation time (TE), inversion time (TI) of 1,000 ms, flip angle of 8°, 24 cm field of view, acquisition matrix was 192 × 192 × 166 in the x‐, y‐, and z‐ dimensions yielding a voxel size of 1.25 × 1.25 × 1.2 mm3 [Jack et al.,2008]. In‐plane, zero‐filled reconstruction (i.e., sinc interpolation) yielded a 256 × 256 matrix for a reconstructed voxel size of 0.9375 × 0.9375 × 1.2 mm3. The ADNI MRI quality control center at the Mayo Clinic (in Rochester, MN) selected the MP‐RAGE image with higher quality based on standardized criteria [Jack et al.,2008]. Additional phantom‐based geometric corrections were applied to ensure spatial calibration was kept within a specific tolerance level for each scanner involved in the ADNI study [Gunter et al.,2006].
Additional image corrections were also applied, using a processing pipeline at the Mayo Clinic, consisting of: (1) a procedure termed GradWarp for correction of geometric distortion due to gradient nonlinearity [Jovicich et al.,2006], (2) a “B1‐correction,” to adjust for image intensity nonuniformity using B1 calibration scans [Jack et al.,2008], (3) “N3” bias field correction, for reducing intensity inhomogeneity [Sled et al.,1998], and (4) geometrical scaling, according to a phantom scan acquired for each subject [Jack et al.,2008], to adjust for scanner‐ and session‐specific calibration errors. In addition to the original uncorrected image files, images with all of these corrections already applied (GradWarp, B1, phantom scaling, and N3) are available to the general scientific community, as described at http://www.loni.ucla.edu/ADNI. Ongoing studies are examining the influence of N3 parameter settings on measures obtained from ADNI scans [Boyes et al.,2008].
Image Preprocessing
To adjust for global differences in brain positioning and scale across individuals, all scans were linearly registered to the stereotactic space defined by the International Consortium for Brain Mapping (ICBM‐53) [Mazziotta et al.,2001] with a 9‐parameter (9P) transformation (three translations, three rotations, three scales) using the Minctracc algorithm [Collins et al.,1994]. Globally aligned images were resampled in an isotropic space of 220 voxels along each axis (x, y, and z) with a final voxel size of 1 mm3.
Manual Hippocampal Delineation Criteria
Hippocampi were traced using anatomical boundaries and landmarks as detailed in Mega et al. [Mega et al.,2002] and Narr et al. [Narr et al.,2002] with a validated protocol used in several prior studies [Lin et al.,2005; Thompson et al.,2004b]. Beginning rostrally at the posterior uncus, the hippocampus was outlined with the superior border defined by the alveus, demarcating the amygdala superiorly from the underlying hippocampus, excluding the parahippocampal gyrus medially and its white matter inferiorly. Progressing posteriorly, the head of the hippocampus exhibits its characteristic digitations with its superior and medial border defined by the temporal horn of the lateral ventricle, the lateral border by the transverse (choroidal) fissure, and the inferior border by the hippocampal sulcus. When the hippocampal sulcus is not open, a line was drawn from its indentation to the temporal horn. Ammon's horn takes on its typical appearance at the level of the lateral geniculate through the body of the hippocampus. Measurements at this level include the dentate gyrus, cornu ammonis fields four through one, the subiculum, and the alveus and fimbria. The limit between the subiculum and the transentorhinal cortex of the parahippocampal gyrus was defined by a line from the inferior border of the subiculum to the medial edge of the dentate gyrus as it curves into the hippocampal sulcus. The first section that contains a complete view of the cerebral peduncles is defined as the posterior limit of the hippocampal head. The hippocampal body's posterior limit is defined as the first slice in which all four colliculi are visualized. This process takes about half an hour per scan.
Segmentation Overview
For an in‐depth overview of ACM with AdaBoost, including mathematical details and validation experiments, please refer to our previous work [Morra et al.,2008a, Morra et al.,2008c]. Briefly, our algorithm uses a set of expertly hand‐labeled segmentations to learn a classification rule for hippocampal versus nonhippocampal regions using a modified AdaBoost method, based on ∼13,000 features (image intensity, position, image curvatures, image gradients, tissue classification maps of gray/white matter and CSF, and mean, standard deviation, and Haar filters of size 1 × 1 × 1 to 7 × 7 × 7). Here the training set consisted of 7 age‐and sex matched subjects of each of three diagnostic groups (AD, MCI, and normal), yielding a total of 21 hand‐segmented training images. As all brains have been linearly registered to a standard template, the pointwise summation of all the training masks is used to devise a basic shape before capturing the global shape of the hippocampus. We also included curvature, gradient, mean, standard deviation, and Haar filters of the shape prior as features. During each iteration of ACM—our extension to AdaBoost—the Bayesian posterior distribution of the labeling is fed back in as an input, along with its neighborhood features, as a new feature for AdaBoost to use as a weak learner. In validation studies using a leave‐one‐out approach and standard overlap and distance error metrics [Morra et al.,2008c], these automated segmentations agreed well with human raters; any differences are comparable to differences between trained human raters; and our error metrics compare favorably with those previously reported for other automated hippocampal segmentations. For this article, we only changed two parameters, relative to the implementation described in [Morra et al.,2008c]. First, we used 70 iterations of AdaBoost, an AdaBoost cascade depth of three nodes, and four ACM iterations. These changes were mainly made for speed purposes, as training takes less than 12 h with this formulation (we note that although the training phase is very computer intensive, the segmentation of new hippocampi takes less than a minute per brain).
One problem inherent in any automated segmentation algorithm is how to deal with partial voluming effects. Because the resolution of MRI scans is not sufficient to resolve the exact boundary of the hippocampus, some voxels will contain both hippocampus and a neighboring structure (such as the amygdala or CSF). However, we were not able to cope with these effects because we were focusing on assigning each voxel to a specific tissue class (in the hippocampus or not). If our training set contained probabilities (how much of a given voxel is hippocampus), we could in theory learn a model that incorporates these probabilities, but our training set only consisted of binary labels. One could also derive a post hoc method estimating the volume fraction of hippocampal tissue in partial volumed voxels by removing the thresholding step at the end of our algorithm. Our automated classifier outputs a probability at each voxel (which may be considered as a maximum a posteriori or MAP probability in a Bayesian framework) representing the likelihood that a particular voxel belongs to the hippocampus, and this floating‐point value is thresholded. This could be considered as an approximation of the fraction of that voxel containing hippocampal tissue (this obviously only makes sense at the region boundary). If posterior probabilities were retained in the analysis and used for inference, it would require a more in depth study to prove their validity. In other ongoing work [Aganj et al.,2008], we have examined the effects of using a partial volume classification model on cortical thickness segmentation, rather than a binary classification at the voxel level. Even so, in this study, given that we have only binarized data to train with, we did not examine partial voluming effects.
Linking Shape and Disease Factors
After all the hippocampal segmentations had been performed, we correlated hippocampal shape with different disease‐related factors using a map‐based statistical analysis. To accomplish this, 3D parametric surface models were constructed from each segmentation, and these models were geometrically averaged across subjects within each diagnostic group. This results in 3D average surface maps for each diagnostic group and statistical maps relating morphology to different covariates, such as diagnosis, genotype, clinical scores, future decline, etc. We used a surface averaging approach used in many prior studies [Thompson et al.,2004a] but we also note that there are many other systems under active development by our group and others [Shi et al.,2007; Terriberry et al.,2007; Vaillant and Glaunes,2005; Wang et al.,2007] to establish pointwise correspondence for subcortical surfaces. Some use automatically defined intrinsic geometric landmarks on the subcortical surface to enforce higher‐order correspondences across subjects when averaging anatomy across a group.
To create a measure of “radial size” for each subject's hippocampus, first a medial curve was computed threading through the hippocampus, and the distance from each surface point to this curve was calculated, providing a measure that is sensitive to local atrophy. As in prior work, regressions were performed to assign a P‐value to each point on the surface in order to link radial size to different covariates of interest. Finally the P‐maps are presented as color coded average subcortical shapes.
All our permutation tests are based on measuring the total area of the hippocampus with suprathreshold statistics, after setting the threshold at P < 0.01. To correct for multiple comparisons and assign an overall P‐value to each P‐map [Nichols and Holmes2002; Thompson et al.,2003], permutation tests were used to determine how likely the observed level of significant atrophy (proportion of suprathreshold statistics, with the threshold set at P < 0.01) within each P‐map would occur by chance [Thompson et al.,2003,2004a]. The number of permutations N was chosen to be 100,000, to control the standard error SEP of omnibus probability P, which follows a binomial distribution B(N, P) with known standard error [Edgington and Onghena,2007]. When N = 8,000, the approximate margin of error (95% confidence interval) for P is around 5% of P; to further improve upon this, we ran 100,000 permutations, with 0.05 chosen as the significance level. We prefer to use the overall extent of the suprathreshold region as we know that atrophy is relatively distributed over the hippocampus, and a set‐level inference is more appropriate for detecting diffuse effects with moderate effect sizes at many voxels, rather than focal effects with very high effect size (which would be better detected using a test for peak height in a statistical map).
When reporting permutation test results, one‐sided hypothesis testing was used, that is, we only considered statistics in which the AD or MCI group showed greater atrophy than the controls, in line with prior findings. Likewise, the correlations are reported as one‐sided hypotheses, that is, statistics are shown in the map where the correlations are in the expected direction, for example, greater atrophy associated with lower MMSE scores, and with higher CDR scores. As a post hoc verification, we also confirmed that the maps in the other direction were indeed null (i.e., they do indeed have null CDFs when evaluated using the FDR method).
False Discovery Rate
To assess our method's power to establish linkages between morphology and disease, we created cumulative distribution function (CDF) plots of the P‐values in our subcortical maps. These CDF plots are commonly created as an intermediate step, when using the false discovery rate (FDR) method to assign overall significance values to statistical maps [Benjamini and Hochberg1995; Genovese et al.,2002; Storey,2002; Zhu et al.,2007]. As they show the proportion of supra‐threshold voxels in a statistical map, for a range of thresholds, these CDF plots offer a measure of the effect size in a statistical map. They also may be used to demonstrate which methodological choices influence the effect size [Brun et al.,2007; Chiang et al.,2007; Lepore et al.,2007].
A CDF of the P‐values may be used to assess how well a method can capture a known relationship between anatomy and disease, or to discover new relationships. In a plot of the observed P‐values versus those that would be expected under the null hypothesis (of no correlation), the line y = x represents the null distribution, where on average, k% of the map falls below P = k/100, for any k, 0 = ≤ k ≤ = 100. However, large upward inflections of this line typically represent significant relationships, as reflected in the P‐maps. In choosing to plot the empirical CDF of P‐values, we note that this chosen presentation is the flip of the more common FDR PP plot.
RESULTS
Volume Analysis
Because it is widely known that reductions in hippocampal volume are associated with declining cognitive function [Jack et al.,1999], we first examined overall differences in hippocampal volume for each of our three diagnostic groups.
Figure 2 and Table II show that there is a sequential reduction in volume between AD, MCI, and healthy controls, consistent with many prior studies [Convit et al.,1997]. Figure 2 also illustrates that the right hippocampus is slightly larger than the left, reaching significance in the MCI group, which is also in line with previous studies [Jack et al.,1989; Jessen et al.,2006; Laakso et al.,2000a,b; Pennanen et al.,2004; Ridha et al.,2006; Wang et al.,2003,2006]. This shows that the segmentations of the hippocampi from brain MRIs we are working with show the expected profile of volumetric effects with disease progression, and that the segmentation approach is measuring hippocampal volumes accurately enough to differentiate the three diagnostic groups, at least at the group level.
Figure 2.

Volumetric analysis for the three different diagnostic groups. Within each diagnostic group, the left hippocampus is slightly smaller than the right; this was only significant for the MCI group in all subjects (P = 0.0068) and the female MCI group (P = 0.00842). The error bars represent standard errors of the mean. [Color figure can be viewed in the online issue, which is available at www.interscience.wiley.com.]
Table II.
Mean differences in hippocampal volume (as a percentage) are shown for the groups listed in the left column, for all subjects, as well as broken down by gender
| Left all (%) | Right all (%) | Left male (%) | Right male (%) | Left female (%) | Right female (%) | |
|---|---|---|---|---|---|---|
| Normal‐AD | 17.75a | 18.71a | 19.98a | 20.77a | 15.03a | 16.44a |
| Normal‐MCI | 9.30a | 7.78a | 9.80a | 7.64b | 8.28b | 7.58b |
| MCI‐AD | 9.32a | 11.85a | 11.28a | 14.22a | 7.36a | 9.59a |
P < 0.01.
P < 0.05.
Table III shows strong correlations between hippocampal volume and (1) MMSE score and (2) sum of boxes CDR. Correlations are high (0.30–0.38) when all subjects are pooled, considering the low P‐values and the relatively large sample size. Even when the three diagnostic groups are split, MMSE correlations are highest in MCI, and sum of boxes CDR correlations are highest in AD. Also, Table IV shows the same correlations when controlling for diagnosis, age, and sex. Although the partial correlation values are generally closer to 0, as might be expected when controlling for many variables, the pattern of significance is generally the same. This shows that the detected associations between hippocampal atrophy and MMSE (and sum‐of‐boxes CDR) are not mediated by diagnostic grouping, age, sex, and ApoE status, the associations persist even after adjustment for these other factors.
Table III.
This table reports the correlations between hippocampal volumes and clinical covariates
| Left HP volume in AD | Left HP volume in MCI | Left HP volume in CTLs | Left HP volume in all | Right HP volume in AD | Right HP volume in MCI | Right HP volume in CTLs | Right HP volume in all | |
|---|---|---|---|---|---|---|---|---|
| MMSE | 0.050 | 0.146a | 0.119a | 0.296a | 0.111b | 0.170a | 0.094b | 0.318a |
| Sum of Boxes CDR | −0.226a | −0.134a | −0.042 | −0.326a | −0.362a | −0.218a | −0.072 | −0.382a |
P < 0.01.
P < 0.05.
Correlations with global CDR are not reported because all MCI patients had a value of 0.5 and all control patients had a value of 0, so correlation is not defined.
Table IV.
This table reports the correlations between hippocampal volumes and clinical covariates, after controlling for diagnosis, age, and sex (diagnostic control was only possible in the full sample)
| Left HP volume in AD | Left HP volume in MCI | Left HP volume in CTLs | Left HP volume in all | Right HP volume in AD | Right HP volume in MCI | Right HP volume in CTLs | Right HP volume in all | |
|---|---|---|---|---|---|---|---|---|
| MMSE | 0.061 | 0.167a | 0.121 | 0.105b | 0.115 | 0.164a | 0.103 | 0.132a |
| Sum of Boxes CDR | −0.214b | −0.138b | −0.046 | −0.140a | −0.354a | −0.214a | −0.097 | −0.245a |
P < 0.01.
P < 0.05.
Correlations with global CDR are not reported because all MCI patients had a value of 0.5 and all control patients had a value of 0, so correlation is not defined.
Diagnostic and Clinical Score Differences
The next test we performed to validate our segmentations is to make significance maps (P‐maps) for covariates with known linkages to hippocampal morphology. For example, it is known that regional brain atrophy in AD is linked with diagnosis, MMSE, global CDR, and sum of boxes CDR scores [Hua et al.,2008; Thompson et al.,2004a]. As this is one of the largest studies of AD to date (400 subjects), effects of potentially subtle covariates should be detectable.
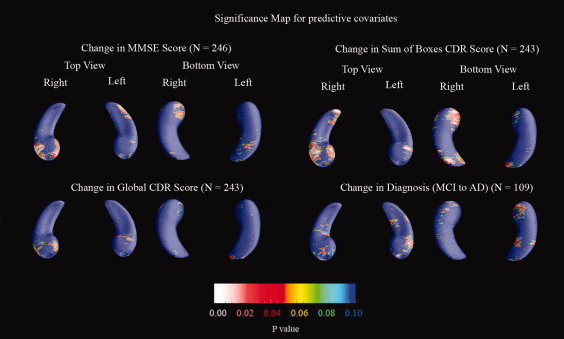
Figure 3 shows the P‐maps for each pairwise diagnostic comparison (AD/MCI/Normal), and correlations between atrophy and MMSE scores, global CDR, and sum of boxes CDR scores, as the covariates. These results would be anticipated based on previous studies of HP volume in AD; the level of atrophy is strongly associated with diagnosis (with greatest effects for the AD vs. normal comparison), MMSE scores, and CDR scores. The overall significance of these mapping results was confirmed by both the permutation tests of Table VII and the FDR analysis of Figure 4. The MMSE and CDR maps resemble each other in part because in our sample MMSE was relatively highly correlated with global CDR scores (Pearson's r = −0.694) and sum‐of‐boxes CDR (r = −0.594); and, partly by definition, global and sum‐of‐boxes CDR scores are highly correlated (r = 0.656).
Figure 3.

Significance maps (P‐value maps) show strong associations between hippocampal shape (local volumetric atrophy) and diagnosis (left columns) and cognitive and clinical scores (right columns), where blue implies 0.1 or greater. All six maps show strong statistical correlations that were confirmed in permutation tests. The right hippocampal head shows greater atrophy in MCI versus normal groups; the right hippocampal tail shows atrophy only in AD‐MCI and AD‐control comparisons. Most hippocampal regions show greater atrophy in AD than MCI. For the diagnostic comparisons, we used the number of subjects in each of the two groups being compared, for the clinical measurement groups, we used all 400 subjects. [Color figure can be viewed in the online issue, which is available at www.interscience.wiley.com.]
Table VII.
This table shows the permutation‐corrected P‐values for all maps shown in this article
| Left | Right | |
|---|---|---|
| Normal vs. MCI | 0.00784 | 0.00884 |
| Normal vs. AD | 0.0001 | 0.00011 |
| MCI vs. AD | 0.00211 | 0.000415 |
| MMSE | 0.0001 | 0.0001 |
| Global CDR | 0.0001 | 0.0001 |
| Sum of boxes CDR | 0.0001 | 0.0001 |
| Global CDR change | 0.603 | 0.420 |
| MMSE change | 0.394 | 0.106 |
| Sum of boxes CDR change | 0.313 | 0.0557 |
| MCI to AD | 0.434 | 0.685 |
| ApoE4 all | 0.188 | 0.111 |
| ApoE4 normal/MCI | 0.834 | 0.373 |
| Systolic pressure | 0.546 | 0.501 |
| Diastolic pressure | 0.931 | 0.491 |
| Homocysteine | 0.612 | 0.446 |
| Education | 0.283 | 0.610 |
| Depression | 0.452 | 0.004 |
Those in italics are deemed significant. Right hippocampal atrophy is associated with the change in sum of boxes CDR score over the following year at trend level, and is very close to the 0.05 significance level.
Figure 4.

Cumulative distribution functions (CDFs) of significance maps for factors previously associated with hippocampal volumes in AD studies. According to the FDR formulae, the rightmost intersection of the y = 20x line and the CDF for a significance map, other than the origin, represents the q‐value, that is, the highest P‐value threshold for which there are at most 5% false positives. When CDFs cross the line y = 20x at a point other than the origin, there is a significant effect, that is, the map can be thresholded in a way that keeps the proportion of false positives under 5%. If other factors are equal (such as sample size), in general, a larger q‐value indicates a more powerful correlation between the covariate and the level of atrophy, in the sense that there is a broader range of statistic thresholds that can be used to limit the rate of false positives to at most 5%. The AD group was powerfully distinguished from controls (blue line) and from MCI (red line), with a q‐value of 0.280, which implies that 28.0% of the P‐map has significant P‐values (less than 0.05), the highest allowable threshold that still controlled the FDR. Here the sum‐of‐boxes CDR (top trace) is the clinical measure correlating most strongly with atrophy. MMSE and global CDR (dotted lines) show relatively powerful linkages. AD was powerfully distinguished from controls (blue line) and from MCI (red line), with over 1/4 of the hippocampal surface showing significant differences at the highest allowable threshold that still controlled the FDR. In these maps, statistics from left and right HP surfaces are pooled. The y‐value at the intersection point between the CDF and the line y = 20x may be thought of as the proportion of the hippocampal surface in which there are significant results, while keeping the proportion of false positives under 5%. [Color figure can be viewed in the online issue, which is available at www.interscience.wiley.com.]
As diagnosis, MMSE scores, and CDR scores correlated with hippocampal atrophy as predicted (Figs. 3, 4, and 5), and because the accuracy of the hippocampal segmentations was satisfactory on independent test data, we went on to explore effects of other more subtle factors that might be associated with atrophy.
Figure 5.

Correlation coefficients (r‐maps) for the three diagnostic comparisons, showing the strength of association between radial hippocampal size and diagnosis, as well as with cognitive and clinical scores. The correlations in the MMSE map are positive (blue colors) because a higher MMSE score is associated with less degeneration (opposite to all the other ones). These maps correlate very closely with the corresponding P‐maps, and so they are not shown for the other covariates. Note that in general, the correlations with radial atrophy are around 0.4, in regions where significant correlations are detected, which is very similar to the level of correlations between overall hippocampal volumes and the same clinical measures (in Table V). [Color figure can be viewed in the online issue, which is available at www.interscience.wiley.com.]
Clinical assessments of disease severity (MMSE, CDR) also show associations with morphology that generally have higher effect sizes than categorization based on diagnosis alone. Even so, these maps must be interpreted cautiously, as MMSE and CDR are used to help determine who is control versus MCI versus AD, so significant correlations may simply reflect the diagnostic classification. As such, maps of MMSE effects, for example, are not necessarily revealing regions in which atrophy is selectively associated with MMSE independent of diagnosis, as the possible range of MMSE scores is almost completely determined by diagnosis. We therefore also computed maps of within‐group correlations, to assess effects of MMSE, and the two CDR measures (sum‐of‐boxes and global) within each of the three diagnostic groups as shown by Figure 6 and Table V. This is a much more challenging effect to detect, as it relies on detecting effects of MMSE within a restricted range.
Figure 6.

These are the P‐maps for clinical covariates broken down by diagnosis, where blue implies P‐values of 0.1 or greater. They show where a correlation between radial atrophy and clinical score can be detected within each of the three diagnostic groups. The significance of each of these maps, assessed by permutation, is shown in Table V. Associations with sum‐of‐boxes CDR (left panels) are very strong for both left and right hippocampi in AD and MCI, but not in controls. The global CDR scores (middle panels) associate with atrophy only in AD, but not in MCI or controls, as all MCI patients have a global CDR value of 0.5 and all controls have a global CDR of 0. Associations with MMSE are weaker than expected (only significant in MCI on the right), perhaps because MMSE was used to help define diagnosis, leading to a very restricted range of MMSE scores in each map. [Color figure can be viewed in the online issue, which is available at www.interscience.wiley.com.]
Table V.
Corrected P‐values for correlations between hippocampal atrophy and various clinical covariates broken down by diagnosis
| Left | Right | |
|---|---|---|
| MMSE AD | 0.0994 | 0.226 |
| MMSE MCI | 0.104 | 0.0209 |
| MMSE controls | 0.334 | 0.605 |
| Global CDR AD | 0.00894 | 0.00377 |
| Global CDR MCI | 1 | 1 |
| Global CDR controls | 1 | 1 |
| Sum of boxes CDR AD | 0.0181 | 0.000230 |
| Sum of boxes CDR MCI | 0.0372 | 0.00923 |
| Sum of boxes CDR control | 0.194 | 0.475 |
Those in italics are deemed significant. The values of 1 (i.e., not significant) for the global CDR measurements arise because all MCI patients have a global CDR value of 0.5 and all controls have a global CDR of 0, so there is no within‐group variation with which to correlate atrophy.
In addition to testing for group differences using univariate statistics, it is also important to adjust for confounding effects of other covariates that might influence the diagnostic and clinical correlations. The best way to do this is to create P‐maps while controlling for various other covariates using the general linear model (multiple regression). Figure 7 shows the three diagnostic P‐maps and the three clinical score P‐maps computed after controlling for effects of age, sex, and ApoE status. The clinical score correlations also controlled for diagnosis. As shown by the permutation test results from Table VI, the effects of the primary covariate of interest, in each case, remained significant after controlling for the other covariates, showing the robustness of the associations.
Figure 7.

Statistical maps (P‐maps) of group differences and clinical correlates of hippocampal atrophy, computed after controlling for ApoE genotype (coded as noted in the methods), sex, and age (for the maps in the left column) and after controlling for ApoE, sex, age, and diagnosis (for the maps in the right column). The primary covariate of interest is indicated above each set of maps. Blue in the map signifies 0.1 or greater. [Color figure can be viewed in the online issue, which is available at www.interscience.wiley.com.]
Table VI.
Permutation testing for the p‐maps of Figure 7, where those in italics are deemed significant
| Left | Right | |
|---|---|---|
| Normal vs. MCI | 0.149 | 0.171 |
| Normal vs. AD | 0.00282 | 0.00669 |
| MCI vs. AD | 0.0309 | 0.0607 |
| MMSE | 0.0483 | 0.0395 |
| Global CDR | 0.258 | 0.247 |
| Sum of boxes CDR | 0.00908 | 0.00148 |
These show the significance of factors hypothesized to be associated with regional hippocampal atrophy. Most of these tests show significant effects and are controlled for the effects of age, sex, ApoE status and (in the case of the last three) for diagnosis. Only the least discriminative test (global CDR has only 5 possible scores), and the most subtle diagnostic comparison (MCI v. normal), were not significant. This may be because of the anatomically restricted area, in the hippocampal head, where atrophy is greater in MCI than in controls at the voxel level.
Predicting Future Cognitive Decline
One goal of ADNI is to find measures in brain images that might predict future clinical decline, either for therapeutic planning, or to adjust for factors that influence morphology in future clinical trials. To study this, we correlated hippocampal morphology at baseline with subsequent change, over the following 1 year, in MMSE, global CDR, and sum of boxes CDR scores. Correlation maps were created to identify any regionally specific hippocampal deformations that might predict future clinical decline. Such associations have already been found for volumetric measures [Devanand et al.,2007] and using maps to predict conversion, stability, or recovery from MCI [Apostolova and Thompson,2007]. In our MCI group, 26 out of 200 subjects converted to AD by 1 year after baseline. Fewer than three subjects had other types of conversions (e.g., control to AD), so we only correlated atrophy with a binary variable denoting conversion from MCI to AD versus remaining diagnosed as MCI.
Figure 8 shows maps revealing some regions in which atrophy appears to correlate with future outcomes, but these maps were not significant overall after multiple comparisons correction via permutation testing (see Table VII). We do not present our FDR analysis of these results, because none crossed the y = 20x line except at the origin. Right hippocampal atrophy at baseline was associated at trend level (P = 0.056) with future changes in the sum of boxes CDR score, but a trend‐level finding of this magnitude is likely to occur by chance when assessing several covariates, and would not therefore survive a Bonferroni correction. Even so, if a more liberal threshold is applied to define the suprathreshold region (P = 0.05 at each voxel), right hippocampal atrophy was associated with future decline in the sum‐of‐boxes CDR score (P = 0.036, corrected). This link requires verification in future samples. No significant correlations were found between baseline atrophy and future conversion from MCI to AD, but this assessment may be underpowered, because only 26 of the 200 MCI subjects had converted 1 year after their baseline scan. However, 1 year may not be enough time to observe drastic effects, and the therapeutic goal is to start AD treatment many years before onset (up to 10 years beforehand). Hopefully in a longer range study, more predictive effects will be observed.
Figure 8.
Significance maps for the correlation between hippocampal shape at baseline and subsequent change in clinical scores or diagnosis over the following year, where blue denotes 0.1 or greater. The sample size is smaller for these maps (noted in parentheses for each map), as not all subjects had follow‐up scans at the time of this study. For the conversion map, only those who were MCI at baseline and had a one‐year follow‐up diagnosis were included. [Color figure can be viewed in the online issue, which is available at www.interscience.wiley.com.]
Effects of ApoE Genotype
In healthy elderly subjects, presence of the ApoE4 allele is correlated with future development of AD [Beffert et al.,1999]. In fact, in our sample, while only 32 (32%) of the controls carried at least one copy of the ApoE4 allele, 107 (54%) of the MCI subjects and 66 (66%) of the AD subjects carried at least one copy of the ApoE4 allele, meaning that the genotype is less common in those who are healthy. ApoE4 is also associated with differences in cortical morphology on MRI in healthy children [Shaw et al.,2007], and with ventricular and hippocampal morphology in elderly subjects [Chou et al.,2008; Pievani et al.,2007, Burggren et al.,2008].
Whether there is any direct association between ApoE4 and hippocampal morphology in aging is not yet clear, so we correlated presence of the ApoE4 allele with the level of hippocampal degeneration, both (1) in the entire sample and (2) in subjects who had not yet developed AD (i.e., MCI and control groups).
As shown in Figure 9, there appear to be regional correlations between ApoE4 and morphology locally in the hippocampal head, but these are not significant after permutation testing (see Table VII), either in the non‐AD subjects or in the entire sample. FDR analysis also showed no correlation. Negative findings have little value in small samples, but our finding of no ApoE4 effect in a sample of 370 subjects suggests that any direct effect of ApoE4 on morphology must be relatively subtle. This lack of an effect could also result from the fact that it has been shown that the effects of ApoE4 diminish with age [Juva et al.,2000]. Because all of our subjects are relatively old, the ApoE4 effects may no longer be present. Also, effects of ApoE4 may be more readily observed in a longitudinal study. Finally, it may be that manual tracing could pick up an ApoE4 effect that automated tracings may miss; even though the automated method is capable of handling 400 scans efficiently, it may be less sensitive than a manual method applied to the same sample if it were feasible to trace all of them.
Figure 9.

Significance maps for ApoE4 as the covariate, with blue being P‐values of 0.1 or higher. We ran two tests, first to determine if the ApoE4 allele was linked with hippocampal atrophy in all subjects (including those with AD), and secondly in just the non‐AD subjects. None of these maps was significant after permutation testing was used for multiple comparisons correction. [Color figure can be viewed in the online issue, which is available at www.interscience.wiley.com.]
It has been hypothesized that ApoE2 may be a protective allele, guarding against the onset of MCI or AD [Roses et al.,1995]. Even so, we found no appreciable correlation between HP morphology and presence of the ApoE2 allele. In our dataset, only 22 individuals carried the ApoE2 genotype, so its rarity means a statistically significant correspondence would be difficult to observe even in a sample this large.
Other Covariates
We also explored some other covariates previously associated with AD. Higher blood pressure [Skoog et al.,1996], elevated homocysteine levels [Morris,2003], poorer educational level [Stern et al.,1994], and measures of clinical depression [Ballmaier et al.,2004,2008] have each been shown to be associated with AD. Therefore, we attempted to detect linkages between these factors and regional hippocampal morphology.
Figure 10 shows that there is little evidence of any association between regional HP morphology and blood pressure measures, years of education, and homocysteine levels; none of these maps was significant overall after correction for multiple spatial comparisons. Table VII shows the overall significance of these maps. The only measure that was significantly associated with atrophy was depression scores; an FDR analysis is shown in Figure 11. Greater atrophy of the right hippocampal head was found in those subjects with higher geriatric depression scores (P = 0.004, corrected), an effect clearly seen in the maps (white colors). The underlying biological explanation for this is not clear, but genotype may be important, because smaller hippocampal volumes in late‐onset depression have been linked to the long variant of the promoter region of the serotonin transporter gene [Taylor et al.,2005]. One postmortem study showed that the presence of a lifetime history of depression was associated with increases in AD‐related neuropathological changes in the hippocampus [Rapp et al.,2006]. Some studies of hippocampal atrophy in elderly depressed subjects have hypothesized that ischemic small‐vessel disease in the hippocampus may be implicated in the pathogenesis of elderly depression [Ballmaier et al.,2008]. Even so, the correlation between hippocampal atrophy and depression may be mediated by concomitant atrophy in other limbic regions, such as the anterior cingulate gyrus, where cortical atrophy has been associated with apathy in AD patients [Apostolova et al.,2007].
Figure 10.

Significance maps for other covariates including systolic and diastolic blood pressure, homocysteine levels, years of education, and depression (based on geriatric depression scores), with blue being 0.1 or more. Each map has some areas of significance; however only depression has a correlation with atrophy that is significant after permutation testing (for the right hippocampus). [Color figure can be viewed in the online issue, which is available at www.interscience.wiley.com.]
Figure 11.
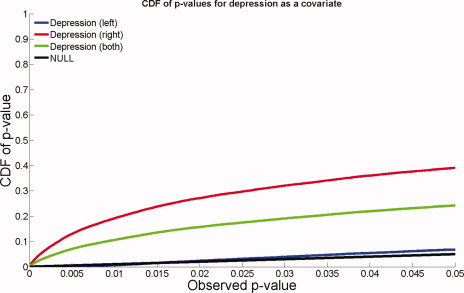
FDR analysis with depression as a covariate. Atrophy of the right hippocampus was correlated with depression scores, but no linkage was detected for the left hippocampus. [Color figure can be viewed in the online issue, which is available at www.interscience.wiley.com.]
Reducing the N
One final avenue that we explored was how many subjects were necessary to detect a statistically significant linkage between diagnosis or clinical scores and morphology. To investigate this, we randomly threw out subjects from our initial sample of 400, yielding groups of size N = 304, N = 200, N = 104, N = 40, and N = 24. These numbers were chosen to preserve the 1:2:1 relationship between normal, MCI, and AD sample sizes, while maintaining the gender balance in all groups. All the final sample sizes were therefore multiples of eight, as sets of one normal, two MCI, and one AD subject of each sex (i.e., eight subjects overall) were successively eliminated, to create smaller samples. For each different N, a random number was used to throw out samples; therefore, smaller samples are not necessarily subsets of the larger ones.
As shown in Figure 12, reducing the sample size, N, generally decreases the detected effect size, as expected. Clinical assessments of disease severity (MMSE, CDR) also show associations with morphology that generally have higher effect sizes than categorization based on diagnosis alone. This is natural as the clinical assessments are continuous rather than categorical measures. Figure 12 also shows how many subjects are necessary to detect a specific effect reliably (i.e., reject the null hypothesis, if FDR is used to control for multiple comparisons). Forty subjects sufficed to discriminate AD from normal groups and to correlate atrophy with CDR clinical scores (global CDR and sum of boxes CDR). 104 subjects were sufficient to correlate atrophy with MMSE, and 200 and 304 subjects, respectively, were required to distinguish MCI from normal and MCI from AD. In general, more extensive regions of statistical association were detected with larger samples.
Figure 12.
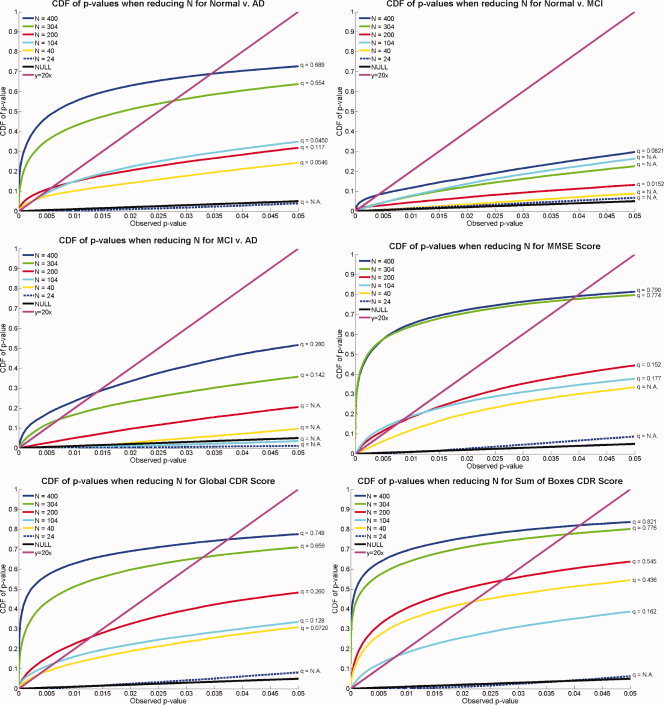
Effects of varying the sample size: CDFs of P‐values measuring the effect sizes for correlations between hippocampal atrophy and different covariates, as the sample size, N, decreases. In general, greater effect sizes are shown by CDFs with the most rapid upswings from the origin. In almost all cases, the results based on smaller sample sizes show lower effect sizes than those computed from larger samples. There is not a monotonically increasing relation between sample size and the height of the CDF computed from the sample, as each sample is the result of random sampling from a population. In general however, as N decreases, the power to detect a given effect is less. The minimal effective sample sizes differ for different effects. [Color figure can be viewed in the online issue, which is available at www.interscience.wiley.com.]
DISCUSSION
This study is representative of several current research efforts that use automated methods to measure hippocampal atrophy in AD, including large deformation diffeomorphic metric mapping [Csernansky et al.,2004; Wang et al.,2007], volumetric analysis [Geuze et al.,2005], and fluid registration [van de Pol et al.,2007]. Clinical measures of disease burden have also been correlated with regional hippocampal atrophy in several surface‐based mapping studies of AD and MCI [Apostolova et al.,2006a; Becker et al.,2006; Frisoni et al.,2006], Lewy body dementia [Sabattoli et al., submitted] and vascular dementia [Scher et al.,2007a], and of conversion between MCI and AD [Apostolova and Thompson2007; Apostolova et al.,2006b].
For each surface model, a medial curve was defined as the line traced out by the centroid of the hippocampal boundary [Styner et al.,2005; Thompson et al.,2004a]. The medial curve was defined separately in each individual, before averaging the surfaces. The operations of averaging surfaces and defining the medial curve from a surface are not commutative, because a medial curve derived from an average surface would not be the same as the average of the medial curves derived from each individual. Because we were interested in measuring radial atrophy in each individual, we computed these measures in each subject with reference to their own medial curve, but plotted the resulting statistics on the average surface for the groups being compared.
One advantage of using the radial distance measure—and computing it in each individual separately—is that it is invariant to overall 3D shifts or translations of the structure. Other methods, such as voxel based morphometry for example, may incorrectly pick up global shifts of the hippocampus as compressions or expansions inside the hippocampus. This is because the nonlinear deformations that register structures across subjects in VBM are spatially regularized (smooth) and may not be precise enough to register the hippocampal boundaries exactly. By contrast, if AD is associated with some shifting of the mean stereotaxic position of the hippocampus, the radial distance measure will not be affected by it, and will only detect localized reductions in volume intrinsic to the hippocampus. This also makes the radial atrophy mapping technique somewhat robust to small rotational or translational errors in registering the images across subjects, as the radial distances are always measured with respect to a central line threading down the center of the structure. The radial distance is a reasonable proxy for volumetric loss, mapping its distribution in 3D, but will not be sensitive to some types of volumetric change. As radial atrophy is measured with respect to the medial curve, the distance measure reflects the thickness of the hippocampus in a given section, which may not reflect an overall volume difference. For example, any anterior‐to‐posterior shortening of the hippocampus would be detected by a volume measure, but the radial distance measure is not sensitive to this type of change—it only measures the radial thickness of the structure relative to a centerline. This may be considered a benefit rather than a limitation, as there are some variations across normal subjects in the anterior–posterior extent of the hippocampus, and these variations will be discounted by the radial mapping approach and will not be a source of confounding variance.
Although an FDR correction for the number of elements in each P‐map is performed, no correction for the number of clinical markers is done. Ideally, we should lower our threshold according to Bonferroni principles. However, none of the permutation tests were close to the 0.05 level, so this is not necessary. In a recent study (regarding brain regions other than the hippocampus), we performed a 5‐fold cross‐validation to assess the predictive power of morphometric measures, for assessing conversion to AD from MCI over a 6 month period, using truly independent subsamples [Zhang et al.,2008].
Several prior studies used 3D surface‐based maps to visualize the profile of hippocampal atrophy in AD and MCI, but they relied almost solely on manual tracing, which is extremely time‐intensive. Becker et al. [Becker et al.,2006] found greater hippocampal atrophy in AD versus MCI (in a total of N = 66 subjects) with greatest differences in the CA1 and subiculum regions. Frisoni et al. [Frisoni et al.,2006] (N = 68), found greater atrophy in AD versus controls, with the main differences in the CA1 field and parts of the subiculum, with CA2 and CA3 regions relatively spared. Finally, Apostolova et al. [Apostolova et al.,2006a] (N = 65) found MCI vs. AD differences in CA1 for both hippocampi, and in CA2 and CA3 only on the right.
Another approach to automatically relate Alzheimer's disease diagnosis and clinical scores with systematic differences in brain structure on MRI is voxel‐based morphometry (VBM). VBM has shown promise in several previous studies, including Chetelat [Chetelat et al.,2005] which tracked gray matter loss in a longitudinal study of 18 MCI patients, Whitwell [Whitwell et al., 2007], who also showed gray matter loss over 3 years in 63 MCI subjects, and Good [Good et al.,2002] who compared VBM to ROI analysis and showed that they compare favorably in detecting structural differences in Alzheimer's disease.
In our maps, the right hippocampal head shows greater atrophy in MCI versus the normal group; the right hippocampal tail shows atrophy only in the AD‐MCI and AD‐control comparisons. The finding of right anterior hippocampal atrophy in MCI is consistent with findings by de Toledo‐Morrell et al. [De Toledo‐Morrell et al.,2000], who observed that the right entorhinal cortex had greatest atrophy in elderly patients. Some investigators have argued that both the EC and hippocampal formation degenerate before the onset of overt dementia, and that EC volume is a better predictor of conversion [Dickerson et al.,2007].
Correlations with symptoms have also been examined using hippocampal maps. Ballmaier et al. [Ballmaier et al.,2008] mapped atrophy of the hippocampal head in depressed versus nondepressed elderly controls. Statistical mapping results, confirmed by permutation testing, showed that regional surface contractions were greater in elderly subjects with late‐ versus early‐onset depression in the anterior aspects of the subiculum, and lateral‐posterior aspects of the CA1 subfield in the left hemisphere. Similar studies of patients with Lewy body dementia showed a more restricted pattern of hippocampal atrophy than AD patients at a comparable level of cognitive impairment [Sabattoli et al.,2008]. Hippocampal maps may therefore complement cortical maps in revealing the selective atrophic patterns that characterize different types of dementia.
We also aimed to identify regions of hippocampal degeneration that predicted either a change in diagnostic classification or a decline in standard clinical measures of functional decline. Although we correlated atrophy with several measures of subsequent decline, only the 1‐year decline in sum‐of‐boxes CDR scores was close to being linked with baseline HP atrophy (P = 0.056; a post hoc test gave P = 0.036, corrected, but used a less stringent re‐thresholding of the data to define suprathreshold statistics). This difficulty in predicting future decline may be due to the shortness of the follow‐up interval; other studies also reported difficulties in predicting cognitive decline based on hippocampal volumes alone, especially when concomitant subcortical brain injuries, such as lacunar infarcts were present [Mungas et al.,2002]. By contrast, Apostolova et al. [Apostolova et al.,2006b] recently used the same surface mapping approach (but based on manual HP segmentation) and predicted subsequent clinical decline in 20 MCI subjects. Over a 2‐year follow‐up period, six patients developed AD, seven remained stable, and seven improved. Smaller hippocampi and specifically CA1 and subicular involvement were associated with future conversion from MCI to AD, whereas MCI patients who improved and no longer met MCI criteria at follow‐up tended to have larger hippocampal volumes and their subiculum and CA1 regions were relatively preserved.
In our study, right hippocampal atrophy was associated with depression severity, consistent with several prior studies of elderly depression. In elderly subjects with late‐ versus early‐onset depression, Ballmaier et al. [Ballmaier et al.,2008] found greater HP atrophy in the anterior aspects of the subiculum, and lateral‐posterior aspects of the CA1 subfield in the left hemisphere. In that study, hippocampal surface contractions correlated with memory measures in late‐onset depressed patients. Our maps and those of Ballmeier et al. [Ballmaier et al.,2008] are consistent with most earlier studies [Bell‐McGinty et al.,2002; Hickie et al.,2005; Lloyd et al.,2004; O'Brien et al.,2004; Steffens et al.,2000], showing smaller hippocampal volumes in elderly depressed patients compared to controls. We detected correlations for only the right HP in this study, consistent with several other reports that have shown differences as being more pronounced for the right than for the left hemisphere [Bell‐McGinty et al.,2002; Steffens et al.,2000].
Next, we examined other hypothesized correlations between hippocampal morphology and educational level, blood pressure, homocysteine levels, and depression severity. Each of these factors has been associated with AD, but they have not yet been directly linked with hippocampal morphology. Long term high blood pressure has been associated with earlier AD onset [Skoog et al.,1996], elevated homocysteine levels have been linked with stroke, and to some extent with AD [Morris,2003], a lower level of education has been shown to be associated with dementia [Stern et al.,1994], and depression commonly accompanies AD [Ballmaier et al.,2004,2008]. We showed that a strong linkage is absent in all of these cases except for depression, which has been supported by other studies [Sheline et al.,1996]. Neither ApoE4 nor ApoE2 was linked with morphology, either in those without AD or in the full patient sample, suggesting that it is not a powerful modulator of hippocampal morphology, despite its role as a risk gene for AD that was confirmed to be over expressed in our MCI and AD groups versus the normal controls. The lack of detectable hippocampal differences between ApoE4 groups is also consistent with other cross‐sectional MRI studies that used manual tracing of the hippocampus [Jak et al.,2007].
Finally, we computed empirically‐based estimates of the minimal sample sizes necessary to detect the well‐known correlations of hippocampal atrophy with diagnosis and with clinical test scores. When conventional volumetric measures were used, Jack et al. [Jack et al.,2003] estimated that in each arm of a therapeutic trial, only 21 subjects would be required to detect a 50% reduction in the rate of decline if hippocampal volume were used as the outcome measure. This compared with 241 subjects if MMSE scores were used and 320 if the AD Assessment Scale Cognitive Subscale (ADAS‐Cog) were used.
Here we found that the more subtle MCI state was difficult to distinguish from either AD or normal aging with fewer than 200–300 subjects overall, but that the four other associations (normal vs. AD, and correlations between atrophy and MMSE scores, global CDR scores, and sum of boxes CDR scores) only required 40 subjects to detect (24 was not sufficient). This finding was unexpected; prior studies, based on manual tracings, required far fewer subjects to differentiate MCI from AD and from controls [Apostolova et al.,2006a]. The manual segmentations previously used may have produced more accurate hippocampal models, but they were time consuming to create (often taking several weeks or months, making large‐scale analyses difficult or prohibitive). In our current study, our automated approach greatly reduced our segmentation time for a large sample (requiring less than 1 min of CPU time on a desktop computer). Whether or not this approach would be optimal for very small studies remains to be proven, as the improvement in automation versus the need to trace a small training set of around 20 images may become limiting in very small samples. Another factor that may have led to our higher sample size requirements for group differentiation is that ADNI collects scans at many acquisition sites. Even so, major efforts have been devoted to protocol design and calibration across scanners and sites.
In future, we plan to map the progression of hippocampal atrophy over time, once the follow‐up (longitudinal) scans are available for the full ADNI sample. Morphometric correlates of disease progression may be easier to examine with longitudinal imaging data. A further avenue of work will apply this method to help distinguish neurodegenerative patterns between AD other types of dementia. In our recent studies of Lewy body dementia [Sabattoli et al., submitted] and vascular dementia [Scher et al.,2007a], we found a more restricted pattern of hippocampal atrophy than AD patients at a comparable level of cognitive impairment.
Acknowledgements
Data used in preparing this article were obtained from the Alzheimer's Disease Neuroimaging Initiative database (http://www.loni.ucla.edu/ADNI). Many ADNI investigators therefore contributed to the design and implementation of ADNI or provided data but did not participate in the analysis or writing of this report. A complete listing of ADNI investigators is available at http://www.loni.ucla.edu/ADNI/Collaboration/ADNI_Citation.shtml. The study is coordinated by the Alzheimer's Disease Cooperative Study at the University of California, San Diego. Author contributions were as follows: JM, ZT, LA, AG, CA, SM, NP, XH, AT, and PT performed the image analyses; CJ, NS, and MW contributed substantially to the image acquisition, study design, quality control, calibration and pre‐processing, databasing, and image analysis. We thank the members of the ADNI Imaging Core for their contributions to the image preprocessing and the ADNI project.
REFERENCES
- Aganj I,Sapiro G,Parikshak N,Madsen SK,Thompson PM ( 2008): Segmentation‐free measurement of cortical thickness from MRI In: Proceedings of the Conference on Information Science and Biomedical Imaging (ISBI). pp 1625–1628. [DOI] [PMC free article] [PubMed] [Google Scholar]
- Apostolova LG,Thompson PM ( 2007): Brain mapping as a tool to study neurodegeneration. Neurotherapeutics 4: 387–400. [DOI] [PMC free article] [PubMed] [Google Scholar]
- Apostolova LG,Dinov ID,Dutton RA,Hayashi KM,Toga AW,Cummings JL,Thompson PM ( 2006a): 3D comparison of hippocampal atrophy in amnestic mild cognitive impairment and Alzheimer's disease. Brain 129(Pt 11): 2867–2873. [DOI] [PubMed] [Google Scholar]
- Apostolova LG,Dutton RA,Dinov ID,Hayashi KM,Toga AW,Cummings JL,Thompson PM ( 2006b): Conversion of mild cognitive impairment to Alzheimer disease predicted by hippocampal atrophy maps. Arch Neurol 63: 693–699. [DOI] [PubMed] [Google Scholar]
- Apostolova LG,Akopyan GG,Partiali N,Steiner CA,Dutton RA,Hayashi KM,Dinov ID,Toga AW,Cummings JL,Thompson PM ( 2007): Structural correlates of apathy in Alzheimer's disease. Dement Geriatr Cogn Disord 24: 91–97. [DOI] [PubMed] [Google Scholar]
- Ballmaier M,Sowell ER,Thompson PM,Kumar A,Narr KL,Lavretsky H,Welcome SE,DeLuca H,Toga AW ( 2004): Mapping brain size and cortical gray matter changes in elderly depression. Biol Psychiatry 55: 382–389. [DOI] [PubMed] [Google Scholar]
- Ballmaier M,Narr KL,Toga AW,Elderkin‐Thompson V,Thompson PM,Hamilton L,Haroon E,Pham D,Heinz A,Kumar A ( 2008): Hippocampal morphology and distinguishing late‐onset from early‐onset elderly depression. Am J Psychiatry 165: 229–237. [DOI] [PMC free article] [PubMed] [Google Scholar]
- Bansal R,Staib LH,Xu D,Zhu H,Peterson BS ( 2007): Statistical analyses of brain surfaces using Gaussian random fields on 2‐D manifolds. IEEE Trans Med Imaging 26: 46–57. [DOI] [PMC free article] [PubMed] [Google Scholar]
- Barnes J,Scahill RI,Boyes RG,Frost C,Lewis EB,Rossor CL,Rossor MN,Fox NC ( 2004): Differentiating AD from aging using semiautomated measurement of hippocampal atrophy rates. Neuroimage 23: 574–581. [DOI] [PubMed] [Google Scholar]
- Becker JT,Davis SW,Hayashi KM,Meltzer CC,Toga AW,Lopez OL,Thompson PM ( 2006): Three‐dimensional patterns of hippocampal atrophy in mild cognitive impairment. Arch Neurol 63: 97–101. [DOI] [PubMed] [Google Scholar]
- Beffert U,Cohn JS,Petit‐Turcotte C,Tremblay M,Aumont N,Ramassamy C,Davignon J,Poirier J ( 1999): Apolipoprotein E and beta‐amyloid levels in the hippocampus and frontal cortex of Alzheimer's disease subjects are disease‐related and apolipoprotein E genotype dependent. Brain Res 843: 87–94. [DOI] [PubMed] [Google Scholar]
- Bell‐McGinty S,Butters MA,Meltzer CC,Greer PJ,Reynolds CF III,Becker JT ( 2002): Brain morphometric abnormalities in geriatric depression: Long‐term neurobiological effects of illness duration. Am J Psychiatry 159: 1424–1427. [DOI] [PubMed] [Google Scholar]
- Benjamini Y,Hochberg Y ( 1995): Controlling the false discovery rate: A practical and powerful approach to multiple testing. J R Stat Soc 57: 298–300. [Google Scholar]
- Boyes RG,Gunter JL,Frost C,Janke AL,Yeatman T,Hill DL,Bernstein MA,Thompson PM,Weiner MW,Schuff N,Alexander GE,Killiany RJ,DeCarli C,Jack CR,Fox NC ( 2008): Intensity non‐uniformity correction using N3 on 3‐T scanners with multichannel phased array coils. Neuroimage 39: 1752–1762. [DOI] [PMC free article] [PubMed] [Google Scholar]
- Braskie MN,Klunder AD,Hayashi KM,Protas H,Kepe V,Miller KJ,Huang SC,Barrio JR,Ercoli L,Toga AW,Bookheimer SY,Small GW,Thompson PM. ( 2008): Dynamic trajectory of cortical plaque and tangle load correlates with cognitive impairment in normal aging and Alzheimer's disease. Neurobiol Aging (in press). [DOI] [PMC free article] [PubMed] [Google Scholar]
- Brun CA,Lepore N,Pennec X,Chou YY,Lopez OL,Aizenstein HJ,Becker JT,Toga A,Thompson P ( 2007): Comparison of Standard and Riemannian Elasticity for Tensor‐Based Morphometry in HIV/AIDS. MICCAI. Brisbane,Australia: Springer. [Google Scholar]
- Burggren AC,Zeineh MM,Ekstrom AE,Braskie MN,Thompson PM,Small GW,Bookheimer SY ( 2008): Reduced cortical thickness in hippocampal subregions among cognitively normal apolipoprotein E e4 carriers. NeuroImage 41: 1177–1183. [DOI] [PMC free article] [PubMed] [Google Scholar]
- Chetelat G,Landeau B,Eustache F,Mezenge F,Viader F,de la Sayette V,Desgranges B,Baron JC ( 2005): Using voxel‐based morphometry to map the structural changes associated with rapid conversion in MCI: A longitudinal MRI study. Neuroimage 27: 934–946. [DOI] [PubMed] [Google Scholar]
- Chiang MC,Dutton RA,Hayashi KM,Lopez OL,Aizenstein HJ,Toga AW,Becker JT,Thompson PM ( 2007): 3D pattern of brain atrophy in HIV/AIDS visualized using tensor‐based morphometry. Neuroimage 34: 44–60. [DOI] [PMC free article] [PubMed] [Google Scholar]
- Chou YY,Lepore N,de Zubicaray GI,Carmichael OT,Becker JT,Toga AW,Thompson PM ( 2008): Automated ventricular mapping with multi‐atlas fluid image alignment reveals genetic effects in Alzheimer's disease. Neuroimage 40: 615–630. [DOI] [PMC free article] [PubMed] [Google Scholar]
- Cockrell JR,Folstein MF ( 1988): Mini‐mental state examination (MMSE). Psychopharmacol Bull 24: 689–692. [PubMed] [Google Scholar]
- Collins DL,Neelin P,Peters TM,Evans AC ( 1994): Automatic 3D intersubject registration of MR volumetric data in standardized Talairach space. J Comput Assist Tomogr 18: 192–205. [PubMed] [Google Scholar]
- Convit A,De Leon MJ,Tarshish C,De Santi S,Tsui W,Rusinek H,George A ( 1997): Specific hippocampal volume reductions in individuals at risk for Alzheimer's disease. Neurobiol Aging 18: 131–138. [DOI] [PubMed] [Google Scholar]
- Crum WR,Scahill RI,Fox NC ( 2001): Automated hippocampal segmentation by regional fluid registration of serial MRI: Validation and application in Alzheimer's disease. Neuroimage 13: 847–855. [DOI] [PubMed] [Google Scholar]
- Csernansky JG,Joshi S,Wang L,Haller JW,Gado M,Miller JP,Grenander U,Miller MI ( 1998): Hippocampal morphometry in schizophrenia by high dimensional brain mapping. Proc Natl Acad Sci USA 95: 11406–11411. [DOI] [PMC free article] [PubMed] [Google Scholar]
- Csernansky JG,Wang L,Joshi SC,Ratnanather JT,Miller MI ( 2004): Computational anatomy and neuropsychiatric disease: Probabilistic assessment of variation and statistical inference of group difference, hemispheric asymmetry, and time‐dependent change. Neuroimage 23 ( Suppl 1): S56–S68. [DOI] [PubMed] [Google Scholar]
- De Toledo‐Morrell L,Goncharova I,Dickerson B,Wilson RS,Bennett DA ( 2000): From healthy aging to early Alzheimer's disease: In vivo detection of entorhinal cortex atrophy. Ann NY Acad Sci 911: 240–253. [DOI] [PubMed] [Google Scholar]
- Devanand DP,Pradhaban G,Liu X,Khandji A,De Santi S,Segal S,Rusinek H,Pelton GH,Honig LS,Mayeux R,Stern Y,Tabert MH,de Leon MJ ( 2007): Hippocampal and entorhinal atrophy in mild cognitive impairment: Prediction of Alzheimer disease. Neurology 68: 828–836. [DOI] [PubMed] [Google Scholar]
- Dickerson BC,Feczko E,Augustinack JC,Pacheco J,Morris JC,Fischl B,Buckner RL ( 2007): Differential effects of aging and Alzheimer's disease on medial temporal lobe cortical thickness and surface area. Neurobiol Aging [Epub ahead of print]. [DOI] [PMC free article] [PubMed] [Google Scholar]
- Du AT,Schuff N,Amend D,Laakso MP,Hsu YY,Jagust WJ,Yaffe K,Kramer JH,Reed B,Norman D,Chui HC,Weiner MW ( 2001): Magnetic resonance imaging of the entorhinal cortex and hippocampus in mild cognitive impairment and Alzheimer's disease. J Neurol Neurosurg Psychiatry 71: 441–447. [DOI] [PMC free article] [PubMed] [Google Scholar]
- Duda D,Hart P,Stork D ( 2001): Pattern Classification: Wiley‐Interscience; New York, NY, p 654. [Google Scholar]
- Edgington ES,Onghena P ( 2007): Randomization Tests. Boca Raton, FL: Chapman & Hall/CRC; p 345. [Google Scholar]
- Fischl B,Salat DH,Busa E,Albert M,Dieterich M,Haselgrove C,van der Kouwe A,Killiany R,Kennedy D,Klaveness S,Montillo A,Makris N,Rosen B,Dale AM ( 2002): Whole brain segmentation: Automated labeling of neuroanatomical structures in the human brain. Neuron 33: 341–355. [DOI] [PubMed] [Google Scholar]
- Folstein MF,Folstein SE,McHugh PR ( 1975): “Mini‐mental state.” A practical method for grading the cognitive state of patients for the clinician. J Psychiatr Res 12: 189–198. [DOI] [PubMed] [Google Scholar]
- Fox NC,Jenkins R,Leary SM,Stevenson VL,Losseff NA,Crum WR,Harvey RJ,Rossor MN,Miller DH,Thompson AJ ( 2000): Progressive cerebral atrophy in MS: A serial study using registered, volumetric MRI. Neurology 54: 807–812. [DOI] [PubMed] [Google Scholar]
- Frisoni GB,Laakso MP,Beltramello A,Geroldi C,Bianchetti A,Soininen H,Trabucchi M ( 1999): Hippocampal and entorhinal cortex atrophy in frontotemporal dementia and Alzheimer's disease. Neurology 52: 91–100. [DOI] [PubMed] [Google Scholar]
- Frisoni GB,Sabattoli F,Lee AD,Dutton RA,Toga AW,Thompson PM ( 2006): In vivo neuropathology of the hippocampal formation in AD: A radial mapping MR‐based study. Neuroimage 32: 104–110. [DOI] [PubMed] [Google Scholar]
- Genovese CR,Lazar NA,Nichols T ( 2002): Thresholding of statistical maps in functional neuroimaging using the false discovery rate. Neuroimage 15: 870–878. [DOI] [PubMed] [Google Scholar]
- Geuze E,Vermetten E,Bremner JD ( 2005): MR‐based in vivo hippocampal volumetrics: 2. Findings in neuropsychiatric disorders. Mol Psychiatry 10: 160–184. [DOI] [PubMed] [Google Scholar]
- Good CD,Johnsrude IS,Ashburner J,Henson RN,Friston KJ,Frackowiak RS ( 2001): A voxel‐based morphometric study of ageing in 465 normal adult human brains. Neuroimage 14(1 Pt 1): 21–36. [DOI] [PubMed] [Google Scholar]
- Good CD,Scahill RI,Fox NC,Ashburner J,Friston KJ,Chan D,Crum WR,Rossor MN,Frackowiak RS ( 2002): Automatic differentiation of anatomical patterns in the human brain: Validation with studies of degenerative dementias. Neuroimage 17: 29–46. [DOI] [PubMed] [Google Scholar]
- Gunter J,Bernstein M,Borowski B,Felmlee J,Blezek D,Mallozzi R ( 2006): Validation testing of the MRI calibration phantom for the Alzheimer's disease neuroimaging initiative study. ISMRM 14th Scientific Meeting and Exhibition. Seattle, Washington.
- Hickie I,Naismith S,Ward PB,Turner K,Scott E,Mitchell P,Wilhelm K,Parker G ( 2005): Reduced hippocampal volumes and memory loss in patients with early‐ and late‐onset depression. Br J Psychiatry 186: 197–202. [DOI] [PubMed] [Google Scholar]
- Hogan RE,Mark KE,Wang L,Joshi S,Miller MI,Bucholz RD ( 2000): Mesial temporal sclerosis and temporal lobe epilepsy: MR imaging deformation‐based segmentation of the hippocampus in five patients. Radiology 216: 291–297. [DOI] [PubMed] [Google Scholar]
- Hua X,Leow AD,Lee S,Klunder AD,Toga AW,Lepore N,Chou YY,Brun C,Chiang MC,Barysheva M,Jack CR Jr,Bernstein MA,Britson PJ,Ward CP,Whitwell JL,Borowski B,Fleisher AS,Fox NC,Boyes RG,Barnes J,Harvey D,Kornak J,Schuff N,Boreta L,Alexander GE,Weiner MW,Thompson PM,Alzheimer's Disease Neuroimaging Initiative ( 2008): 3D characterization of brain atrophy in Alzheimer's disease and mild cognitive impairment using tensor‐based morphometry. Neuroimage 41: 19–34. [DOI] [PMC free article] [PubMed] [Google Scholar]
- Hughes CP,Berg L,Danziger WL,Coben LA,Martin RL ( 1982): A new clinical scale for the staging of dementia. Br J Psychiatry 140: 566–572. [DOI] [PubMed] [Google Scholar]
- Jack CR Jr,Bernstein MA,Fox NC,Thompson P,Alexander G,Harvey D,Borowski B,Britson PJ,Whitwell J,Ward C,Dale AM,Felmlee JP,Gunter JL,Hill DL,Killiany R,Schuff N,Fox‐Bosetti S,Lin C,Studholme C,DeCarli CS,Krueger G,Ward HA,Metzger GJ,Scott KT,Mallozzi R,Blezek D,Levy J,Debbins JP,Fleisher AS,Albert M,Green R,Bartzokis G,Glover G,Mugler J,Weiner MW ( 2008): The Alzheimer's Disease Neuroimaging Initiative (ADNI): MRI methods. J Magn Reson Imaging 27: 685–691. [DOI] [PMC free article] [PubMed] [Google Scholar]
- Jack CR Jr,Twomey CK,Zinsmeister AR,Sharbrough FW,Petersen RC,Cascino GD ( 1989): Anterior temporal lobes and hippocampal formations: Normative volumetric measurements from MR images in young adults. Radiology 172: 549–554. [DOI] [PubMed] [Google Scholar]
- Jack CR Jr,Petersen RC,Xu YC,O'Brien PC,Smith GE,Ivnik RJ,Boeve BF,Waring SC,Tangalos EG,Kokmen E ( 1999): Prediction of AD with MRI‐based hippocampal volume in mild cognitive impairment. Neurology 52: 1397–1403. [DOI] [PMC free article] [PubMed] [Google Scholar]
- Jack CR Jr,Slomkowski M,Gracon S,Hoover TM,Felmlee JP,Stewart K,Xu Y,Shiung M,O'Brien PC,Cha R,Knopman D,Petersen RC ( 2003): MRI as a biomarker of disease progression in a therapeutic trial of milameline for AD. Neurology 60: 253–260. [DOI] [PMC free article] [PubMed] [Google Scholar]
- Jak AJ,Houston WS,Nagel BJ,Corey‐Bloom J,Bondi MW ( 2007): Differential cross‐sectional and longitudinal impact of APOE genotype on hippocampal volumes in nondemented older adults. Dement Geriatr Cogn Disord 23: 382–389. [DOI] [PMC free article] [PubMed] [Google Scholar]
- Jessen F,Feyen L,Freymann K,Tepest R,Maier W,Heun R,Schild HH,Scheef L ( 2006): Volume reduction of the entorhinal cortex in subjective memory impairment. Neurobiol Aging 27: 1751–1756. [DOI] [PubMed] [Google Scholar]
- Jorm AF,Korten AE,Henderson AS ( 1987): The prevalence of dementia: A quantitative integration of the literature. Acta Psychiatr Scand 76: 465–479. [DOI] [PubMed] [Google Scholar]
- Jovicich J,Czanner S,Greve D,Haley E,van der Kouwe A,Gollub R,Kennedy D,Schmitt F,Brown G,Macfall J,Fischl B,Dale A ( 2006): Reliability in multi‐site structural MRI studies: Effects of gradient non‐linearity correction on phantom and human data. Neuroimage 30: 436–443. [DOI] [PubMed] [Google Scholar]
- Juva K,Verkkoniemi A,Viramo P,Polvikoski T,Kainulainen K,Kontula K,Sulkava R ( 2000): APOE epsilon4 does not predict mortality, cognitive decline, or dementia in the oldest old. Neurology 54: 412–415. [DOI] [PubMed] [Google Scholar]
- Kantarci K,Jack CR Jr ( 2003): Neuroimaging in Alzheimer disease: An evidence‐based review. Neuroimaging Clin N Am 13: 197–209. [DOI] [PubMed] [Google Scholar]
- Laakso MP,Frisoni GB,Kononen M,Mikkonen M,Beltramello A,Geroldi C,Bianchetti A,Trabucchi M,Soininen H,Aronen HJ ( 2000a): Hippocampus and entorhinal cortex in frontotemporal dementia and Alzheimer's disease: A morphometric MRI study. Biol Psychiatry 47: 1056–1063. [DOI] [PubMed] [Google Scholar]
- Laakso MP,Lehtovirta M,Partanen K,Riekkinen PJ,Soininen H ( 2000b): Hippocampus in Alzheimer's disease: A 3‐year follow‐up MRI study. Biol Psychiatry 47: 557–561. [DOI] [PubMed] [Google Scholar]
- Leow AD,Klunder AD,Jack CR Jr,Toga AW,Dale AM,Bernstein MA,Britson PJ,Gunter JL,Ward CP,Whitwell JL,Borowski BJ,Fleisher AS,Fox NC,Harvey D,Kornak J,Schuff N,Studholme C,Alexander GE,Weiner MW,Thompson PM; ADNI Preparatory Phase Study ( 2006): Longitudinal stability of MRI for mapping brain change using tensor‐based morphometry. Neuroimage 31: 627–640. [DOI] [PMC free article] [PubMed] [Google Scholar]
- Lepore N,Brun C,Pennec X,Chou YY,Lopez OL,Aizenstein HJ,Becker JT,Toga AW,Thompson PM ( 2007): Mean template for tensor‐based morphometry using deformation tensors. Med Image Comput Comput Assist Interv Int Conf Med Image Comput Comput Assist Interv 10(Pt 2): 826–833. [DOI] [PubMed] [Google Scholar]
- Lerch JP,Pruessner J,Zijdenbos AP,Collins DL,Teipel SJ,Hampel H,Evans AC ( 2008): Automated cortical thickness measurements from MRI can accurately separate Alzheimer's patients from normal elderly controls. Neurobiol Aging 29: 23–30. [DOI] [PubMed] [Google Scholar]
- Lin JJ,Salamon N,Dutton RA,Lee AD,Geaga JA,Hayashi KM,Toga AW,Engel J Jr,Thompson PM ( 2005): Three‐dimensional preoperative maps of hippocampal atrophy predict surgical outcomes in temporal lobe epilepsy. Neurology 65: 1094–1097. [DOI] [PMC free article] [PubMed] [Google Scholar]
- Lloyd AJ,Ferrier IN,Barber R,Gholkar A,Young AH,O'Brien JT ( 2004): Hippocampal volume change in depression: Late‐ and early‐onset illness compared. Br J Psychiatry 184: 488–495. [DOI] [PubMed] [Google Scholar]
- Mazziotta J,Toga A,Evans A,Fox P,Lancaster J,Zilles K,Woods R,Paus T,Simpson G,Pike B,Holmes C,Collins L,Thompson P,MacDonald D,Iacoboni M,Schormann T,Amunts K,Palomero‐Gallagher N,Geyer S,Parsons L,Narr K,Kabani N,Le Goualher G,Boomsma D,Cannon T,Kawashima R,Mazoyer B ( 2001): A probabilistic atlas and reference system for the human brain: International Consortium for Brain Mapping (ICBM). Philos Trans R Soc Lond B Biol Sci 356: 1293–1322. [DOI] [PMC free article] [PubMed] [Google Scholar]
- McKhann G,Drachman D,Folstein M,Katzman R,Price D,Stadlan EM ( 1984): Clinical diagnosis of Alzheimer's disease: Report of the NINCDS‐ADRDA work group under the auspices of Department of Health and Human Services task force on Alzheimer's disease. Neurology 34: 939–944. [DOI] [PubMed] [Google Scholar]
- Mega MS,Small GW,Xu ML,Felix J,Manese M,Tran NP,Dailey JI,Ercoli LM,Bookheimer SY,Toga AW ( 2002): Hippocampal atrophy in persons with age‐associated memory impairment: Volumetry within a common space. Psychosom Med 64: 487–492. [DOI] [PubMed] [Google Scholar]
- Morra J,Tu Z,Apostolova LG,Green A,Avedissian C,Madsen S,Parikshak N,Hua X,Toga A,Jack C,Schuff N,Weiner MW,Thompson P ( 2008a): Mapping Hippocampal Degeneration in 400 Subjects with a Novel Automated Segmentation Approach. International Symposium on Biomedical Imaging. Paris, France: IEEE. [Google Scholar]
- Morra J,Tu Z,Apostolova LG,Green A,Toga A,Thompson P ( 2008b): Automatic Subcortical Segmentation Using a Contextual Model. New York: MICCAI. [DOI] [PubMed] [Google Scholar]
- Morra J,Tu Z,Apostolova LG,Green AE,Avedissian C,Madsen SK,Parikshak N,Hua X,Toga AW,Jack CR,Schuff N,Weiner MW,Thompson PM ( 2008c): Validation of a fully automated 3D hippocampal segmentation method using subjects with Alzheimer's disease, mild cognitive impairment, and elderly controls. NeuroImage [Epub ahead of print]. [DOI] [PMC free article] [PubMed] [Google Scholar]
- Morra J,Tu Z,Apostolova LG,Green AE,Avedissian C,Madsen SK,Parikshak N,Toga AW,Jack CR,Schuff N,Weiner MW,Thompson PM ( 2008d): Automated mapping of hippocampal atrophy in 1‐year repeat MRI data in 490 subjects with Alzheimer's disease, mild cognitive impairment, and elderly controls. NeuroImage [Epub ahead of print]. [DOI] [PMC free article] [PubMed] [Google Scholar]
- Morris JC ( 1993): The clinical dementia rating (CDR): Current version and scoring rules. Neurology 43: 2412–2414. [DOI] [PubMed] [Google Scholar]
- Morris MS ( 2003): Homocysteine and Alzheimer's disease. Lancet Neurol 2: 425–428. [DOI] [PubMed] [Google Scholar]
- Mueller SG,Weiner MW,Thal LJ,Petersen RC,Jack C,Jagust W,Trojanowski JQ,Toga AW,Beckett L ( 2005a): The Alzheimer's disease neuroimaging initiative. Neuroimaging Clin N Am 15: 869–877, xi–xii. [DOI] [PMC free article] [PubMed] [Google Scholar]
- Mueller SG,Weiner MW,Thal LJ,Petersen RC,Jack CR,Jagust W,Trojanowski JQ,Toga AW,Beckett L ( 2005b): Ways toward an early diagnosis in Alzheimer's disease: The Alzheimer's disease neuroimaging initiative (ADNI). Alzheimers Dement 1: 55–66. [DOI] [PMC free article] [PubMed] [Google Scholar]
- Mungas D,Reed BR,Jagust WJ,DeCarli C,Mack WJ,Kramer JH,Weiner MW,Schuff N,Chui HC ( 2002): Volumetric MRI predicts rate of cognitive decline related to AD and cerebrovascular disease. Neurology 59: 867–873. [DOI] [PMC free article] [PubMed] [Google Scholar]
- Narr KL,van Erp TG,Cannon TD,Woods RP,Thompson PM,Jang S,Blanton R,Poutanen VP,Huttunen M,Lonnqvist J,Standerksjöld‐Nordenstam CG,Kaprio J,Mazziotta JC,Toga AW ( 2002): A twin study of genetic contributions to hippocampal morphology in schizophrenia. Neurobiol Dis 11: 83–95. [DOI] [PubMed] [Google Scholar]
- Nichols TE,Holmes AP ( 2002): Nonparametric permutation tests for functional neuroimaging: A primer with examples. Hum Brain Mapp 15: 1–25. [DOI] [PMC free article] [PubMed] [Google Scholar]
- O'Brien JT,Lloyd A,McKeith I,Gholkar A,Ferrier N ( 2004): A longitudinal study of hippocampal volume, cortisol levels, and cognition in older depressed subjects. Am J Psychiatry 161: 2081–2090. [DOI] [PubMed] [Google Scholar]
- Pennanen C,Kivipelto M,Tuomainen S,Hartikainen P,Hanninen T,Laakso MP,Hallikainen M,Vanhanen M,Nissinen A,Helkala EL,Vainio P,Vanninen R,Partanen K,Soininen H ( 2004): Hippocampus and entorhinal cortex in mild cognitive impairment and early AD. Neurobiol Aging 25: 303–310. [DOI] [PubMed] [Google Scholar]
- Petersen RC ( 2000): Aging, mild cognitive impairment, and Alzheimer's disease. Neurol Clin 18: 789–806. [DOI] [PubMed] [Google Scholar]
- Petersen RC,Smith GE,Waring SC,Ivnik RJ,Tangalos EG,Kokmen E ( 1999): Mild cognitive impairment: Clinical characterization and outcome. Arch Neurol 56: 303–308. [DOI] [PubMed] [Google Scholar]
- Petersen RC,Doody R,Kurz A,Mohs RC,Morris JC,Rabins PV,Ritchie K,Rossor M,Thal L,Winblad B ( 2001): Current concepts in mild cognitive impairment. Arch Neurol 58: 1985–1992. [DOI] [PubMed] [Google Scholar]
- Pievani M,Testa C,Sabattoli F,Bonetti M,Hayashi KM,Lee AD,Dutton RA,Thompson P,Frisoni GB ( 2007): Effects of the ApoE genotype and age at onset in Alzheimer's Disease: A cortical pattern matching study. 13th Annual Meeting of the Organization for Human Brain Mapping. Chicago, IL.
- Powell S,Magnotta VA,Johnson H,Jammalamadaka VK,Pierson R,Andreasen NC ( 2008): Registration and machine learning‐based automated segmentation of subcortical and cerebellar brain structures. Neuroimage 39: 238–247. [DOI] [PMC free article] [PubMed] [Google Scholar]
- Rapp MA,Schnaider‐Beeri M,Grossman HT,Sano M,Perl DP,Purohit DP,Gorman JM,Haroutunian V ( 2006): Increased hippocampal plaques and tangles in patients with Alzheimer disease with a lifetime history of major depression. Arch Gen Psychiatry 63: 161–167. [DOI] [PubMed] [Google Scholar]
- Ridha BH,Barnes J,Bartlett JW,Godbolt A,Pepple T,Rossor MN,Fox NC ( 2006): Tracking atrophy progression in familial Alzheimer's disease: A serial MRI study. Lancet Neurol 5: 828–834. [DOI] [PubMed] [Google Scholar]
- Roses AD,Saunders AM,Corder EH,Pericak‐Vance MA,Han SH,Einstein G,Hulette C,Schmechel DE,Holsti M,Huang D et al. ( 1995): Influence of the susceptibility genes apolipoprotein E‐epsilon 4 and apolipoprotein E‐epsilon 2 on the rate of disease expressivity of late‐onset Alzheimer's disease. Arzneimittelforschung 45: 413–417. [PubMed] [Google Scholar]
- Sabattoli F,Boccardi M,Galluzzi S,Treves A,Thompson P,Frisoni GB ( 2008): Hippocampal shape differences in dementia with Lewy bodies. Neuroimage 41: 699–705. [DOI] [PubMed] [Google Scholar]
- Salat DH,Buckner RL,Snyder AZ,Greve DN,Desikan RS,Busa E,Morris JC,Dale AM,Fischl B ( 2004): Thinning of the cerebral cortex in aging. Cereb Cortex 14: 721–730. [DOI] [PubMed] [Google Scholar]
- Schapire RE,Freund Y,Bartlett JW ( 1998): Boosting the margin: A new explanation for the effectiveness of voting methods. Ann Stat 26: 1651–1686. [Google Scholar]
- Scher A,Xu Y,Korf E,White L,Scheltens P,Toga A,Thompson P,Hartley S,Witter M,Valentino D,Launer L ( 2007a): Hippocampal morphometry in Alzheimer's vs. vascular dementia: A population‐based study. Neuroimage (in press). [DOI] [PubMed] [Google Scholar]
- Scher AI,Xu Y,Korf ES,White LR,Scheltens P,Toga AW,Thompson PM,Hartley SW,Witter MP,Valentino DJ,Launer LJ ( 2007b): Hippocampal shape analysis in Alzheimer's disease: A population‐based study. Neuroimage 36: 8–18. [DOI] [PubMed] [Google Scholar]
- Shaw P,Lerch JP,Pruessner JC,Taylor KN,Rose AB,Greenstein D,Clasen L,Evans A,Rapoport JL,Giedd JN ( 2007): Cortical morphology in children and adolescents with different apolipoprotein E gene polymorphisms: An observational study. Lancet Neurol 6: 494–500. [DOI] [PubMed] [Google Scholar]
- Sheline YI,Wang PW,Gado MH,Csernansky JG,Vannier MW ( 1996): Hippocampal atrophy in recurrent major depression. Proc Natl Acad Sci USA 93: 3908–3913. [DOI] [PMC free article] [PubMed] [Google Scholar]
- Shi Y,Thompson P,De Zubicaray GI,Rose SE,Tu Z,Dinov I,Toga A ( 2007): Direct mapping of hippocampal surfaces with intrinsic shape context. Neuroimage 37: 792–807. [DOI] [PMC free article] [PubMed] [Google Scholar]
- Skoog I,Lernfelt B,Landahl S,Palmertz B,Andreasson LA,Nilsson L,Persson G,Oden A,Svanborg A ( 1996): 15‐year longitudinal study of blood pressure and dementia. Lancet 347: 1141–1145. [DOI] [PubMed] [Google Scholar]
- Sled JG,Zijdenbos AP,Evans AC ( 1998): A nonparametric method for automatic correction of intensity nonuniformity in MRI data. IEEE Trans Med Imaging 17: 87–97. [DOI] [PubMed] [Google Scholar]
- Steffens DC,Byrum CE,McQuoid DR,Greenberg DL,Payne ME,Blitchington TF,MacFall JR,Krishnan KR ( 2000): Hippocampal volume in geriatric depression. Biol Psychiatry 48: 301–309. [DOI] [PubMed] [Google Scholar]
- Stern Y,Gurland B,Tatemichi TK,Tang MX,Wilder D,Mayeux R ( 1994): Influence of education and occupation on the incidence of Alzheimer's disease. JAMA 271: 1004–1010. [PubMed] [Google Scholar]
- Storey JD ( 2002): A direct approach to false discovery rates. J R Stat Soc Ser B (Statistical Methodology) 64: 479–498. [Google Scholar]
- Studholme C,Cardenas V,Blumenfeld R,Schuff N,Rosen HJ,Miller B,Weiner M ( 2004): Deformation tensor morphometry of semantic dementia with quantitative validation. Neuroimage 21: 1387–1398. [DOI] [PubMed] [Google Scholar]
- Studholme C,Drapaca C,Iordanova B,Cardenas V ( 2006): Deformation‐based mapping of volume change from serial brain MRI in the presence of local tissue contrast change. IEEE Trans Med Imaging 25: 626–639. [DOI] [PubMed] [Google Scholar]
- Styner M,Brechbuhler C,Szekely G,Gerig G ( 2000): Parametric estimate of intensity inhomogeneities applied to MRI. IEEE Trans Med Imaging 19: 153–165. [DOI] [PubMed] [Google Scholar]
- Styner M,Lieberman JA,McClure RK,Weinberger DR,Jones DW,Gerig G ( 2005): Morphometric analysis of lateral ventricles in schizophrenia and healthy controls regarding genetic and disease‐specific factors. Proc Natl Acad Sci USA 102: 4872–4877. [DOI] [PMC free article] [PubMed] [Google Scholar]
- Taylor WD,Steffens DC,Payne ME,MacFall JR,Marchuk DA,Svenson IK,Krishnan KR ( 2005): Influence of serotonin transporter promoter region polymorphisms on hippocampal volumes in late‐life depression. Arch Gen Psychiatry 62: 537–544. [DOI] [PubMed] [Google Scholar]
- Terriberry TB,Damon JN,Pizer SM,Joshi SC,Gerig G ( 2007): Population‐based fitting of medial shape models with correspondence optimization. Inf Process Med Imaging 20: 700–712. [DOI] [PubMed] [Google Scholar]
- Thompson PM,Apostolova LG ( 2007): Computational anatomical methods as applied to ageing and dementia. Br J Radiol 80: S78–S91. [DOI] [PubMed] [Google Scholar]
- Thompson PM,Hayashi KM,de Zubicaray G,Janke AL,Rose SE,Semple J,Herman D,Hong MS,Dittmer SS,Doddrell DM,Toga AW ( 2003): Dynamics of gray matter loss in Alzheimer's disease. J Neurosci 23: 994–1005. [DOI] [PMC free article] [PubMed] [Google Scholar]
- Thompson PM,Hayashi KM,De Zubicaray GI,Janke AL,Rose SE,Semple J,Hong MS,Herman DH,Gravano D,Doddrell DM,Toga AW ( 2004a) Mapping hippocampal and ventricular change in Alzheimer disease. Neuroimage 22: 1754–1766. [DOI] [PubMed] [Google Scholar]
- Thompson PM,Hayashi KM,Simon SL,Geaga JA,Hong MS,Sui Y,Lee JY,Toga AW,Ling W,London ED ( 2004b): Structural abnormalities in the brains of human subjects who use methamphetamine. J Neurosci 24: 6028–6036. [DOI] [PMC free article] [PubMed] [Google Scholar]
- Vaillant M,Glaunes J ( 2005): Surface matching via currents. Inf Process Med Imaging 19: 381–392. [DOI] [PubMed] [Google Scholar]
- van de Pol LA,Barnes J,Scahill RI,Frost C,Lewis EB,Boyes RG,van Schijndel RA,Scheltens P,Fox NC,Barkhof F ( 2007): Improved reliability of hippocampal atrophy rate measurement in mild cognitive impairment using fluid registration. Neuroimage 34: 1036–1041. [DOI] [PubMed] [Google Scholar]
- Wang L,Swank JS,Glick IE,Gado MH,Miller MI,Morris JC,Csernansky JG ( 2003): Changes in hippocampal volume and shape across time distinguish dementia of the Alzheimer type from healthy aging. Neuroimage 20: 667–682. [DOI] [PubMed] [Google Scholar]
- Wang L,Zang Y,He Y,Liang M,Zhang X,Tian L,Wu T,Jiang T,Li K ( 2006): Changes in hippocampal connectivity in the early stages of Alzheimer's disease: Evidence from resting state fMRI. Neuroimage 31: 496–504. [DOI] [PubMed] [Google Scholar]
- Wang L,Beg F,Ratnanather T,Ceritoglu C,Younes L,Morris JC,Csernansky JG,Miller MI ( 2007): Large deformation diffeomorphism and momentum based hippocampal shape discrimination in dementia of the Alzheimer type. IEEE Trans Med Imaging 26: 462–470. [DOI] [PMC free article] [PubMed] [Google Scholar]
- Wechsler D. ( 1987): Wechsler Memory Scale. New York: Psychological Corp/Harcourt Brace Jovanovich. [Google Scholar]
- Whitwell JL,Shiung MM,Przybelski SA,Weigand SD,Knopman DS,Boeve BF,Petersen RC,Jack CR Jr ( 2008): MRI patterns of atrophy associated with progression to AD in amnestic mild cognitive impairment. Neurology 70: 512–520. [DOI] [PMC free article] [PubMed] [Google Scholar]
- Xu Y,Valentino DJ,Scher AI,Dinov I,White LR,Thompson PM,Launer LJ,Toga AW ( 2008): Age effects on hippocampal structural changes in old men: The HAAS. Neuroimage 40: 1003–1015. [DOI] [PMC free article] [PubMed] [Google Scholar]
- Yesavage JA,Brink TL,Rose TL,Lum O,Huang V,Adey M,Leirer VO ( 1982): Development and validation of a geriatric depression screening scale: A preliminary report. J Psychiatr Res 17: 37–49. [DOI] [PubMed] [Google Scholar]
- Yushkevich PA,Piven J,Hazlett HC,Smith RG,Ho S,Gee JC,Gerig G ( 2006): User‐guided 3D active contour segmentation of anatomical structures: Significantly improved efficiency and reliability. Neuroimage 31: 1116–1128. [DOI] [PubMed] [Google Scholar]
- Zhang H,Wu T,Bae M,Reiman EM,Alexander GE,Jack CR Jr,Thompson PM,Chen K ( 2008): Use of the support vector machine and sensitivity of an AD‐related region‐of‐interest gray matter classifier in identifying amnestic MCI subjects who convert to AD: Preliminary findings from the AD neuroimaging initiative. Presented at the International Conference on Alzheimer's Disease, Chicago, July 26–31.
- Zhu H,Ibrahim JG,Tang N,Rowe DB,Hao X,Bansal R,Peterson BS ( 2007): A statistical analysis of brain morphology using wild bootstrapping. IEEE Trans Med Imaging 26: 954–966. [DOI] [PMC free article] [PubMed] [Google Scholar]