

Abstract
Prolonged selective breeding of Hsd:ICR mice for high levels of voluntary wheel running has favored an unusual phenotype (mini-muscle [MM]), apparently caused by a single Mendelian recessive allele, in which hindlimb muscle mass is reduced by almost 50%. We recently described the creation and phenotypic characterization of a population suitable for mapping the genomic location of the MM gene. Specifically, we crossed females from a high-runner line fixed for the MM allele with male C57BL/6J. F1 males were then backcrossed to the MM parent females. Backcross (BC) mice exhibited a 50:50 ratio of normal to MM phenotypes. Here, we report on linkage mapping of MM in this BC population to a 2.6335-Mb interval on MMU11. This region harbors ∼100 expressed or predicted genes, many of which have known roles in muscle development and/or function. Identification of the genetic variation that underlies MM could potentially be very important in understanding both normal muscle function and disregulation of muscle physiology leading to disease.
Prolonged selective breeding of Hsd:ICR mice for high levels of voluntary wheel running has favored an unusual phenotype (mini-muscle [MM]), apparently caused by a single Mendelian recessive allele, in which hindlimb muscle mass is reduced by almost 50%. This phenotype was originally observed in 2 of 4 replicate selected lines (termed HR for high runner) and in 1 of 4 control (nonselected) lines (Garland et al. 2002). Analyses of data from the first 22 generations of the selection experiment indicated that the mutant allele was present at a frequency of approximately 7% in the base population (outbred Hsd:ICR mice). Five of the 8 total lines apparently lost the allele by random genetic drift. In one control line, the phenotype, representing homozygotes, was observed at a frequency of 0–10% for the first 22 generations (Garland et al. 2002) and was then apparently lost (T Garland Jr. unpublished observations). The 2 selected lines that have exhibited the phenotype showed an increase in frequency consistent with positive selection (Garland et al. 2002). In one (lab designated line 6), the phenotype remains polymorphic as of generation 50. In the other (lab designated line 3), the mutation apparently had gone to fixation by generation 36 (Syme et al. 2005).
The most characteristic phenotype of MM allele homozygotes is a 50% reduction in mass of the triceps surae muscle complex (Garland et al. 2002) as well as in mass of mixed hindlimb muscle exclusive of the triceps surae (Houle-Leroy et al. 2003). Beyond this, the MM allele has many pleiotropic effects in homozygotes, including a doubling of mass-specific aerobic capacity as compared with wild-type muscle (Houle-Leroy et al. 2003), altered fiber type composition in the gastrocnemius (Guderley et al. 2008), altered muscle contractile performance (Syme et al. 2005), an increase in size of their ventricles, liver, and spleen (Garland et al. 2002; Swallow et al. 2005), and longer and thinner hindlimb bones (Kelly et al. 2006). Many of these effects seem conducive to the support of endurance running (Garland 2003; Guderley et al. 2006; Rezende et al. 2006). To date, clearly deleterious consequences of the MM allele have not been reported.
Although the physiological consequences of MM are becoming well understood, the nature of the underlying mutation has not been characterized. Identification of the MM gene, and how variation within that gene leads to the MM phenotype, would be important for understanding both normal and abnormal muscle development in mammalian species. We recently described the creation and phenotypic characterization of a population suitable for mapping the genomic location of the MM gene (Hannon et al. 2008). We crossed females from the HR line that is fixed for the MM allele with male C57BL/6J. F1 males were then backcrossed to the MM parent females. The HR(B6HRF1) backcross (BC) mice (N = 404) were dissected, and a 50:50 ratio of normal to MM phenotype was observed. In this paper, we report on linkage mapping of MM in this BC population to a 2.6335-Mb interval on MMU11. This region harbors ∼100 expressed or predicted genes, many of which have known roles in muscle development and/or function.
Methods
Development of BC Mapping Population
As described elsewhere (Hannon et al. 2008), 20 C57BL/6J males (The Jackson Laboratory, Bar Harbor, ME) were harem mated with each of 3 females from HR line 3, which is apparently fixed for the MM mutant allele (Syme et al. 2005). Sixty male F1 mice were weaned at 21 days of age. At approximately 8 weeks of age, they were randomly backcrossed (one dam with one sire) to the HR line 3 dams, with the exception that mother–son and aunt–nephew matings were disallowed. Once dams were visually pregnant, F1 males were removed. The HR(B6HRF1) BC pups were weaned at 21 days, then all line 3 dams and F1 males were dissected following Garland et al. (2002) to determine MM phenotype status (see below).
When BC pups reached approximately 7 weeks of age, they were given 6 days of wheel access (as in the routine selective breeding protocol described by Swallow et al., 1998) and then dissected to determine MM phenotype. For mice in all 4 groups (C57BL/6J males, HR line 3 females, F1 offspring, and BC offspring), plots of mean triceps surae muscle mass against body mass allowed unambiguous identification of MM individuals (Figure 1).
Figure 1.

Relation between triceps surae mass (mean of left and right) and body mass for HR(B6HRF1) BC mice. The MM phenotype, characterized by a nearly 50% reduction in muscle mass, was found in ∼50% of BC mice, supporting a single recessive locus model.
Chromosomal Localization and Fine Mapping of MM
General Methods
Microsatellite marker analysis was performed in 2 overall steps. An initial genome-wide scan was performed with sparse genome coverage using 54 BC mice segregating for MM, to identify the general chromosomal region harboring the MM gene. This was followed by fine mapping with dense marker coverage within the MM region using all BC mice. Microsatellite markers were genotyped as previously described (Allan et al. 2005). Linkage maps were constructed using MAP MANAGER QTX (http://www.mapmanager.org/mmQTX.html). For all linkage estimations, genotypes for MM were inferred based on phenotypic evidence as described above. BC mice with MM were designated mini/mini, whereas mice with no evidence of MM were designated mini/B6.
Sparse Mapping
Because HR has not been previously genotyped for microsatellite markers, and is not fully inbred, we initially tested several markers on each autosome for informativeness in the BC. Two or 3 microsatellite markers (total of 48) across all 19 autosomes were selected for the scan (data not shown). These were genotyped across a subset of 54 BC mice having a 50:50 ratio of MM and normal phenotypes selected across several BC families. A Chi-square test was used to test for significant (P < 0.05) linkage between a microsatellite marker and the mutant gene, by examining deviations from the expectation that 50% of the samples should have a mini/mini marker genotype and 50% should have a mini/B6 genotype.
Fine Mapping
Initially, markers D11Mit108, D11Mit260, D11Mit141, and D11Mit212, all found to be informative in the initial marker testing, were genotyped across the full BC population of 404 mice, and a linkage map was generated for these 4 markers and MM. For further fine mapping, additional markers were tested in the region between 37.0 and 43.8 cM (Table 1). From this test, an additional 3 markers (D11Mit4, D11Mit31, and D11Mit90) were selected and genotyped in the full BC and a new linkage map was generated based on 7 microsatellite markers and MM.
Table 1.
All markers used in microsatellite mapping of MM
| Marker | Chromosome | Linkage position (cM) | Physical position (Mb) | Phase of mapping |
| D1mit318 | 1 | 18.5 | 33.84 | Sparse mapping |
| D1mit33 | 1 | 81.6 | 160.34 | Sparse mapping |
| D1mit128 | 1 | 36.9 | 72.57 | Sparse mapping |
| D2mit297 | 2 | 29.0 | 42.46 | Sparse mapping |
| D2mit171 | 2 | 98.0 | 34.34 | Sparse mapping |
| D3mit203 | 3 | 11.2 | 26.84 | Sparse mapping |
| D3mit147 | 3 | 79.4 | 148.41 | Sparse mapping |
| D4mit171 | 4 | 6.3 | 22.41 | Sparse mapping |
| D4mit139 | 4 | 28.6 | 55.26 | Sparse mapping |
| D4mit71 | 4 | 61.9 | 133.34 | Sparse mapping |
| D5mit126 | 5 | 20.0 | 35.80 | Sparse mapping |
| D5mit240 | 5 | 59.0 | 109.52 | Sparse mapping |
| D6mit119 | 6 | 25.5 | 50.81 | Sparse mapping |
| D6mit31 | 6 | 38.5 | 92.67 | Sparse mapping |
| D6mit217 | 6 | 60.5 | 125.27 | Sparse mapping |
| D7mit227 | 7 | 16.0 | 37.37 | Sparse mapping |
| D7mit321 | 7 | 48.5 | 105.05 | Sparse mapping |
| D8mit64 | 8 | 16.0 | 33.90 | Sparse mapping |
| D8mit215 | 8 | 59.0 | 118.38 | Sparse mapping |
| D9mit205 | 9 | 18.0 | 37.11 | Sparse mapping |
| D9mit165 | 9 | 38.0 | 68.53 | Sparse mapping |
| D9mit212 | 9 | 61.0 | 108.54 | Sparse mapping |
| D10mit126 | 10 | 21.0 | 26.73 | Sparse mapping |
| D10mit70 | 10 | 59.0 | 103.54 | Sparse mapping |
| D11mit108 | 11 | 18.0 | 35.86 | Sparse mapping and initial fine mapping |
| D11mit141 | 11 | 27.0 | 52.96 | Initial fine mapping |
| D11mit260 | 11 | 34.4 | 61.61 | Initial fine mapping |
| D11Mit115 | 11 | 37.0 | 67.45 | Tertiary fine mapping |
| 3D | 11 | — | 67.97 | Tertiary fine mapping |
| D11Mit1000a | 11 | — | 68.32 | Secondary fine mapping |
| D11Mit4 | 11 | 37.0 | 68.42 | Secondary fine mapping |
| D11mit60 | 11 | 40.0 | 69.55 | Tertiary fine mapping |
| D11mit30 | 11 | 39.8 | 69.61 | Tertiary fine mapping |
| D11mit29 | 11 | 40.0 | 69.61 | Tertiary fine mapping |
| D11mit31 | 11 | 40.0 | — | Tertiary fine mapping |
| 1F | 11 | — | 70.09 | Tertiary fine mapping |
| 1H | 11 | — | 70.09 | Tertiary fine mapping |
| 1A | 11 | — | 70.10 | Tertiary fine mapping |
| 1B | 11 | — | 70.10 | Tertiary fine mapping |
| D11Mit90 | 11 | 42.0 | 70.31 | Secondary fine mapping |
| D11mit212 | 11 | 50.0 | 88.67 | Sparse mapping and initial fine mapping |
| D12mit185 | 12 | 11.0 | 27.75 | Sparse mapping |
| D12mit153 | 12 | 15.0 | 35.92 | Sparse mapping |
| D12mit156 | 12 | 34.0 | 80.56 | Sparse mapping |
| D12mit158 | 12 | 38.0 | 83.72 | Sparse mapping |
| D13mit158 | 13 | 5.0 | 49.33 | Sparse mapping |
| D13mit198 | 13 | 7.7 | 35.06 | Sparse mapping |
| D13mit139 | 13 | 32.0 | 51.86 | Sparse mapping |
| D13mit202 | 13 | 47.0 | 91.61 | Sparse mapping |
| D14mit141 | 14 | 15.0 | 47.38 | Sparse mapping |
| D14mit82 | 14 | 19.5 | 53.41 | Sparse mapping |
| D14mit196 | 14 | 47.0 | — | Sparse mapping |
| D15mit12 | 15 | 4.7 | 31.61 | Sparse mapping |
| D15mit107 | 15 | 49.0 | 84.22 | Sparse mapping |
| D16mit132 | 16 | 3.7 | — | Sparse mapping |
| D16mit71 | 16 | 70.7 | 97.13 | Sparse mapping |
| D17mit175 | 17 | 17.7 | — | Sparse mapping |
| D17mit72 | 17 | 47.4 | 79.39 | Sparse mapping |
| D18mit123 | 18 | 31.0 | 56.13 | Sparse mapping |
| D18mit4 | 18 | 57.0 | 84.30 | Sparse mapping |
| D19mit128 | 19 | 10.9 | 17.33 | Sparse mapping |
| D19mit67 | 19 | 43.0 | 44.47 | Sparse mapping |
| D19mit71 | 19 | 54.0 | 59.67 | Sparse mapping |
D11Mit1000 is named D17Mit144 in the Ensembl database.
Subsequently, additional informative markers were genotyped but only in specific BC mice harboring a recombination near the estimated linkage position of MM. New markers were genotyped in the regions between D11Mit260 (34.4 cM, 61.61 Mb) and D11Mit4 (37.0 cM, 68.42 Mb) and between D11Mit31 (40.0 cM) and D11Mit90 (42.0 cM, 70.31 Mb). When no previously published markers were available, primers were designed flanking putative microsatellites identified through BLAST searches in Ensembl and informative markers were genotyped. This process was continued until nearly all information on location of recombinations in the BC was exhausted. A total of 17 newly designed markers were tested, of which 15 amplified well and 5 were informative (Table 1).
Candidate Gene Sequencing
DNA from C57BL/6J (n = 1), HR Line 3 mice with MM (n = 3), HR Line 6 mice with MM (n = 3), and HR Line 6 mice without MM (n = 3) was used to generate polymerase chain reaction (PCR) products for sequencing of candidate genes within the fine-mapped MM interval. For sox15, overlapping PCR products were amplified encompassing the entire gene plus some flanking sequence (Ensembl coordinates: 69,468,319–69,470,660). For Chrnb1, 11 overlapping PCR products were amplified to encompass 4959 bp of the gene including all 11 exons and part of the 5′ and 3′ untranslated region (UTR) regulatory sequences (Ensembl coordinates 69,609,023–69,609,447; 69,608,428–69,608,582; 69,607,330–69,607,783; 69,606,871–69,607,171; 69,606,147–69,606,445; 69,600,313–69,600,624; 69,599,120–69,599,461; 69,598,235–69,598,730; 69,597,890–69,598,334; 69,597,558–69,598,061; 69,597,174–69,597,674). For rpl26, overlapping PCR products were amplified representing the entire gene (Ensembl coordinates: 68,715,068–68,718,035). All PCR products incorporated 5′ and 3′ M13 tails and were sequenced from both directions through a service provider (Agencourt Bioscience, Beverly, MA).
Results
Sparse Mapping
Two microsatellite markers on MMU11 (D11Mit108, 18 cM, 36 Mb and D11Mit212, 50 cM, 89 Mb) were found to be linked with MM (P<0.01; Table 2) based on genotyping of 54 BC mice. Given that the estimated strength of linkage between MM and each of these markers was very similar (Table 2), the position of MM was presumed to be near the midpoint of the markers at ∼35 cM. No markers on other chromosomes showed significant linkage to MM.
Table 2.
Chi-square values for 2 markers on Chromosome 11 in the genome-wide screen of 54 BC mice
| MM mice |
Normal mice |
||||||
| Marker | Position (cM) | Physical location (Mb) | Mini/mini | Mini/B6 | Mini/mini | Mini/B6 | Chi square |
| D11Mit108 | 18 | 35.86 | 24 | 6 | 4 | 20 | 9.48 |
| D11Mit212 | 50 | 88.67 | 23 | 6 | 4 | 21 | 10.7 |
Fine Mapping
Results of initial linkage mapping using MM and 4 microsatellite markers genotyped across the full BC population are summarized in Table 3. The estimated positions are given as ranges. MM mapped between markers D11Mit260 (34.4 cM, 61.6 Mb) and D11Mit212 (50 cM, 88.7 Mb). Location of MM was estimated to be 4.45 cM distal to D11Mit260 and 9.83 cM proximal to D11Mit212.
Table 3.
Initial fine mapping linkage map between MM and 4 microsatellite markers
| Marker | Linkage distance (cM) | MGD position (cM) | Physical location (Mb) |
| D11Mit108 | 18.0 | 35.86 | |
| 5.49 | |||
| D11Mit141 | 27.0 | 52.96 | |
| 6.21 | |||
| D11Mit260 | 34.4 | 61.61 | |
| 4.45 | |||
| Mini-Muscle | — | — | |
| 9.83 | |||
| D11Mit212 | 50.0 | 88.67 |
MGD, mouse genome database.
After genotyping of 3 additional markers (D11Mit4, D11Mit31, and D11Mit90), only one (D11Mit90, 42 cM, 70.32 Mb) revealed new recombinations for linkage mapping. Results of the new mapping including this additional marker are summarized in Table 4 and Figure 2, showing that the region harboring MM had now been effectively reduced to the interval of 61.6–70.3 Mb. The very tight linkage (0.5 cM) between MM and D11Mit90 provided evidence that MM was likely near the distal edge of this interval.
Table 4.
Linkage map after secondary phase of fine mapping
| Marker | Linkage distance (cM) | MGD position (cM) | Physical location (Mb) |
| D11Mit108 | 18.0 | 35.86 | |
| 5.49 | |||
| D11Mit141 | 27.0 | 52.96 | |
| 6.21 | |||
| D11Mit260 | 34.4 | 61.61 | |
| 4.53 | |||
| Mini-Muscle | — | — | |
| 0.51 | |||
| D11Mit90 | 42.0 | 70.31 | |
| 9.39 | |||
| D11Mit212 | 50.0 | 88.67 |
MGD, mouse genome database.
Figure 2.
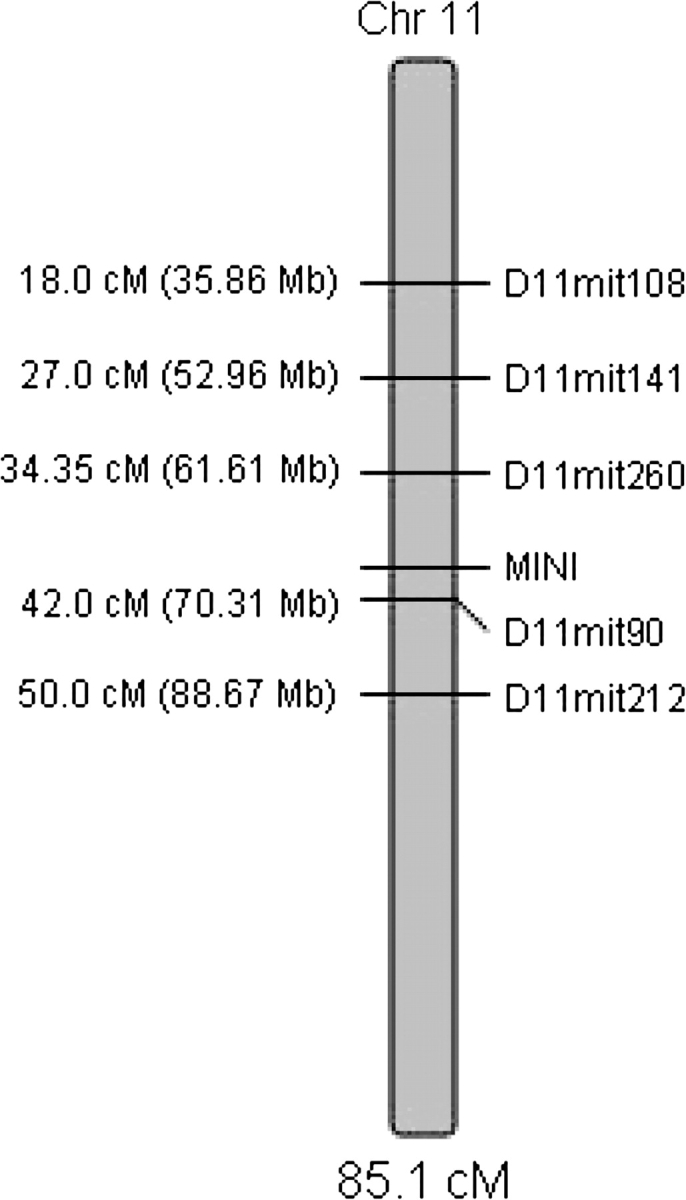
Initial linkage map of the MM region after genotyping of 6 markers on MMU11 in the full HR(B6HRF1) BC population.
For further fine mapping of the MM mutation, only mice with recombinations between MM and D11Mit260 on the proximal end (n = 18) or D11Mit90 on the distal end (n = 2) were genotyped. Given that no new estimations of linkage would be feasible, only physical locations were used at this point to guide selection and/or design of additional microsatellite markers. New genotyping within this region revealed additional recombinations, helping to further refine the localization of MM (Table 5), with new boundaries of D11Mit115 (67.453 Mb) and the newly designed marker 1F (70.0865). Having exhausted recombinations in this BC population, MM was localized to this 2.6335-Mb region, which harbors ∼100 genes (Table 6; NCBI Build 37.1 [February, 2008]).
Table 5.
Genotypic matrix for further fine mapping of MM using 20 informative BC mice
| Mouse ID |
D11Mit260 |
D11Mit115 |
MM |
1F |
D11Mit90 |
|
| 61.609 Mb | 67.453 Mb | — | 70.0865 Mb | 70.313 Mb | ||
| 4302 | H | R | R | — | R | |
| 4482 | H | R | R | — | R | |
| 4471 | H | R | R | — | R | |
| 4472 | H | R | R | — | R | |
| 4081 | H | R | R | — | R | |
| 4239 | — | R | R | — | R | |
| 4196 | H | R | R | — | R | |
| 4238 | R | H | H | — | H | |
| 4427 | R | H | H | — | H | |
| 4276 | R | H | H | — | H | |
| 4269 | R | H | H | — | H | |
| 4292 | R | H | H | — | H | |
| 4279 | R | H | H | — | H | |
| 4152 | R | H | H | — | H | |
| 4404 | R | H | H | — | H | |
| 4268 | R | H | H | — | H | |
| 4197 | R | R | H | — | H | |
| 4086 | H | H | R | — | R | |
| 4199 | R | — | R | H | H | |
| 4344 | H | — | H | H | R |
H, mini/B6 genotype; R, mini/mini genotype. Relevant recombinations are in bold.
Table 6.
Expressed and predicted genes within the 2.6335 Mb MMU11 region harboring MM
| Symbol | Start base pair | Stop base pair | Description |
| Gas7 | 67,416,607 | 67,498,461 | Growth arrest specific 7 |
| Rcvrn | 67,500,799 | 67,516,835 | Recoverin |
| Glp2r | 67,519,932 | 67,584,655 | Glucagons-like peptide 2 receptor |
| LOC544792 | 67,588,110 | 67,603,400 | Similar to germ cell associated 1 (predicted) |
| Dhrs7c | 67,611,790 | 67,629,507 | Dehydrogenase/reductase (family) member 7C |
| LOC100041899 | 67,651,191 | 67,657,281 | Hypothetical protein LOC100041899 |
| Usp43 | 67,668,025 | 67,735,655 | Ubiquitin-specific peptidase 43 |
| Wdr16 | 67,738,308 | 67,779,144 | WD repeat domain 16 |
| Stx8 | 67,779,985 | 68,020,650 | Syntaxin 8 |
| Ntn1 | 68,022,866 | 68,200,328 | Netrin 1 |
| Pik3r5 | 68,245,627 | 68,311,348 | Phosphoinositide-3-kinase, regulatory subunit 5, p101 |
| BB220380 | 68,316,521 | 68366200 | Expressed sequence BB220380 |
| BC024997 | 68,369,688 | 68,371,747 | cDNA sequence BC024997 |
| Ccdc42 | 68,407,557 | 68,411,456 | Coiled-coil domain containing 42 |
| Myh10 | 68,505,417 | 68,630,126 | Myosin, heavy polypeptide 10, nonmuscle |
| Ndel1 | 68,634,936 | 68,666,564 | Nuclear distribution gene E-like homolog 1 (A. nidulans) |
| 9930039A11Rik | 68,702,055 | 68,708,517 | RIKEN cDNA 9930039A11 gene |
| Rpl26 | 68,715,068 | 68,718,036 | Ribosomal protein L26 |
| Odf4 | 68,735,337 | 68,740,551 | Outer dense fiber of sperm tails 4 |
| Arhgef15 | 68,756,656 | 68,770,360 | Rho guanine nucleotide exchange factor 15 |
| Slc25a35 | 68,781,633 | 68,786,017 | Solute carrier family 25, member 35 |
| 2400006H24Rik | 68,785,989 | 68,787322 | RIKEN cDNA 2400006H24 gene |
| Pfas | 68,798,671 | 68,821,962 | Phosphoribosylformylglycinamidine synthase (amidotransferase) |
| 1500010J02Rik | 68,829,615 | 68,849,972 | RIKEN cDNA 1500010J02 gene |
| Aurkb | 68,859,145 | 68,865,164 | Aurora kinase B |
| 2310047M10Rik | 68,873,277 | 68,875,078 | RIKEN cDNA 2310047M10 gene |
| Tmem107 | 68,884,311 | 68,886,794 | Transmembrane protein 107 |
| Vamp2 | 68,902,030 | 68,905,883 | Vesicle-associated membrane protein 2 |
| Per1 | 68,912,451 | 68,923,462 | Period homolog 1 (Drosophila) |
| Hes7 | 68,933,955 | 68,936,761 | Hairy and enhancer of split 7 (Drosophila) |
| Aloxe3 | 68,939,879 | 68,962,616 | Arachidonate lipoxygenase 3 |
| Alox12b | 68,970,574 | 68,983,293 | Arachidonate 12-lipoxygenase, 12R type |
| Alox8 | 68,997,387 | 69,011,341 | Arachidonate 8-lipoxygenase |
| Gucy2e | 69,036,537 | 69,050,147 | Guanylate cyclase 2e |
| Cntrob | 69,112,998 | 69,137,277 | Centrobin, centrosomal BRCA2-interacting protein |
| Trappc1 | 69,137,482 | 69,139,295 | Trafficking protein particle complex 1 |
| Kcnab3 | 69,139,760 | 69,146,543 | Potassium voltage–gated channel, shaker-related subfamily, beta member 3 |
| A030009H04Rik | 69,154,319 | 69,156,143 | RIKEN cDNA A030009H04 gene |
| Chd3 | 69,156,775 | 69,182,928 | Chromodomain helicase DNA-binding protein 3 |
| Cyb5d1 | 69,207,114 | 69,208,848 | Cytochrome b5 domain containing 1 |
| Lsmd1 | 69,209,293 | 69,210,173 | LSM domain containing 1 |
| Tmem88 | 69,210,021 | 69,211,736 | Transmembrane protein 88 |
| Jmjd3 | 69,212,010 | 69,227,177 | Jumonji domain containing 3 |
| Dnahc2 | 69,234,311 | 69,362,610 | Dynein, axonemal, heavy chain 2 |
| Efnb3 | 69,367,627 | 69,373,680 | Ephrin B3 |
| Wdr79 | 69,375,256 | 69,392,826 | WD repeat domain 79 |
| LOC100043030 | 69,387,322 | 69,387,686 | Similar to ribosomal protein S27 (metallopanstimulin 1) |
| Trp53 | 69,393,483 | 69,405,373 | Transformation-related protein 53 |
| Atp1b2 | 69,413,252 | 69,419,462 | ATPase, Na+/K+ transporting, beta 2 polypeptide |
| Shbg | 69,428,318 | 69,431,370 | Sex hormone–binding globulin |
| Sat2 | 69,435,611 | 69,437,371 | Spermidine/spermine N1-acetyl transferase 2 |
| LOC382532 | 69,444,405 | 69,444,814 | Similar to ribosomal protein S15a |
| Fxr2 | 69,446,473 | 69,466,799 | Fragile X mental retardation, autosomal homolog 2 |
| Sox15 | 69,468,875 | 69,470,123 | SRY-box–containing gene 15 |
| Mpdu1 | 69,470,206 | 69,476,144 | Mannose-P-dolichol utilization defect 1 |
| Cd68 | 69,477,873 | 69,479,564 | CD68 antigen |
| Eif4a1 | 69,480,441 | 69,485,817 | Eukaryotic translation initiation factor 4A1 |
| Senp3 | 69,486,620 | 69,495,348 | SUMO/sentrin-specific peptidase 3 |
| Tnfsf13 | 69,496,079 | 69,499,056 | Tumor necrosis factor (ligand) superfamily, member 13 |
| Tnfsf12-tnfsf13 | 69,496,079 | 69,509,499 | Tumor necrosis factor (ligand) superfamily, member 12-member 13 |
| Tnfsf12 | 69,499,850 | 69,509,256 | Tumor necrosis factor (ligand) superfamily, member 12 |
| LOC100041994 | 69,543,497 | 69,545,211 | Hypothetical protein LOC100041994 |
| Polr2a | 69,547,912 | 69,571,725 | Polymerase (RNA) II (DNA directed) polypeptide A |
| Amac1 | 69,573,386 | 69,575,346 | Acyl-malonyl–condensing enzyme 1 |
| Zbtb4 | 69,588,908 | 69,593,175 | Zinc finger and BTB domain containing 4 |
| Chrnb1 | 69,597,539 | 69,609,445 | Cholinergic receptor, nicotinic, beta polypeptide 1 (muscle) |
| Fgf11 | 69,611,704 | 69,615,127 | Fibroblast growth factor 11 |
| Tmem102 | 69,617,105 | 69,619,126 | Transmembrane protein 102 |
| 4933402P03Rik | 69,630,068 | 69,631,942 | RIKEN cDNA 4933402P03 gene |
| 1700095G12Rik | 69,634,373 | 69,635,667 | RIKEN cDNA 1700095G12 gene |
| Nlgn2 | 69,636,625 | 69,648,351 | Neuroligin 2 |
| 1810027O10Rik | 69,652,027 | 69,653,060 | RIKEN cDNA 1810027O10 gene |
| Plscr3 | 69,660,178 | 69,665,560 | Phospholipid scramblase 3 |
| Tnk1 | 69,664,601 | 69,672,219 | Tyrosine kinase, nonreceptor, 1 |
| LOC432576 | 69,690,186 | 69,691,607 | Hypothetical LOC432576 |
| Kctd11 | 69,691,179 | 69,694,908 | Potassium channel tetramerisation domain containing 11 |
| Centb1 | 69,695,069 | 69,709,041 | Centaurin, beta 1 |
| 2810408A11Rik | 69,710,860 | 69,714,488 | RIKEN cDNA 2810408A11 gene |
| 0610025P10Rik | 69,715,393 | 69,727,322 | RIKEN cDNA 0610025P10 gene |
| Gps2 | 69,727,694 | 69,730,093 | G-protein pathway suppressor 2 |
| Eif5a | 69,730,224 | 69,734,843 | Eukaryotic translation initiation factor 5A |
| Ybx2 | 69,749,401 | 69,755,101 | Y-box protein 2 |
| Slc2a4 | 69,755,788 | 69,761,692 | Solute carrier family 2 (facilitated glucose transporter), member 4 |
| LOC668442 | 69,764,300 | 69,764,986 | Similar to Cofilin-1 (Cofilin, nonmuscle isoform) |
| Cldn7 | 69,779,003 | 69,781,380 | Claudin 7 |
| Rai12 | 69,781,726 | 69,794,012 | Retinoic acid induced 12 |
| Dullard | 6,9794,670 | 69,804,103 | Dullard homolog (Xenopus laevis) |
| Gabarap | 69,804,872 | 69,808,448 | Gamma-aminobutyric acid receptor–associated protein |
| Phf23 | 69,809,279 | 69,813,418 | PHD finger protein 23 |
| Dvl2 | 69,814,128 | 69,823,611 | Disheveled 2, dsh homolog (Drosophila) |
| Acadvl | 69,823,694 | 69,828,909 | Acyl-Coenzyme A dehydrogenase, very long chain |
| Dlg4 | 69,832,366 | 69,858,270 | Discs, large homolog 4 (Drosophila) |
| Asgr1 | 69,867,871 | 69,871,396 | Asialoglycoprotein receptor 1 |
| Asgr2 | 69,906,146 | 69,919,689 | Asialoglycoprotein receptor 2 |
| Mgl2 | 69,943,859 | 69,951,044 | Macrophage galactose N-acetyl-galactosamine–specific lectin 2 |
| Mgl1 | 69,980,276 | 69,984,336 | Macrophage galactose N-acetyl-galactosamine–specific lectin 1 |
| Slc16a11 | 70,027,582 | 70,029,915 | Solute carrier family 16 (monocarboxylic acid transporters), member 11 |
| Slc16a13 | 70,030,294 | 70,034,496 | Solute carrier family 16 (monocarboxylic acid transporters), member 13 |
| Bcl6b | 70,037,630 | 70,043,223 | B-cell CLL/lymphoma 6, member B |
| 0610010K14Rik | 70,048,710 | 70,051,416 | RIKEN cDNA 0610010K14 gene |
| D11Bwg0434e | 70,051,628 | 70,053,348 | DNA segment, Chr 11, Brigham and Women's Genetics 0434 expressed |
| Alox12 | 70,054,957 | 70,068,843 | Arachidonate 12-lipoxygenase |
Data retrieved from NCBI Build 37.1 (February, 2008).
Candidate Gene Sequencing
Three genes within the 2.6335-Mb region harboring MM were selected for sequencing based on having well-characterized roles in muscle development. For sox15, no genetic variation was observed across the entire gene sequence between any of the samples. For chrnb1, 2 single nucleotide polymorphisms and a 3-bp deletion (GGA/-) were observed between C57BL/6J and HR mice within the 3′ UTR (data not shown). However, none of the sequence variants found within chrnb1 correlated with the MM phenotype within HR mice. For rpl26, many polymorphisms were found between C57BL/6J and HR mice (data not shown), but again, none of this genetic variation segregated in a manner that provided evidence for being causal for MM.
Discussion
Mapping and subsequent identification of spontaneous mutations with major phenotypic effect in mice have played a significant role in furthering our understanding of many physiological processes. These include growth (e.g., growth hormone–releasing hormone receptor; Godfrey et al. 1993), obesity (e.g., leptin; Zhang et al. 1994), and reproduction (e.g., gonadotropin-releasing hormone; Mason et al. 1986). Spontaneous mutations in genes regulating muscle development have also been identified. For example, the “compact” mutation causing hypermuscularity in mice (Varga et al. 1997) was subsequently identified as a deletion in myostatin (mstn) (Szabó et al. 1998), a finding that was driven by the discovery that muscles of myostatin knockout mice weigh 2–3 times more than those of wild-type animals (McPherron et al. 1997). A second example is the “high-growth” mutation, which was first observed because it caused a 30–50% increase in postweaning growth rate of mice (Bradford and Famula 1984). The underlying mutation was later identified as a ∼500-kb deletion of a region containing the gene cytokine signaling 2 (Socs2), a member of a family of regulators of cytokine signal transduction (Horvat and Medrano 2001).
In this study, we have mapped the recessive MM mutation, which causes most hindlimb muscles to have markedly reduced mass, to a 2.6335-Mb interval on MMU11. Effects of this MM mutation were originally observed in 2 of 4 replicate lines during the course of long-term selective breeding for high levels of voluntary wheel running and in 1 of 4 control (nonselected) lines (Garland et al. 2002). Analyses of data from the first 22 generations of the selection experiment indicated that the mutant allele was present at a frequency of approximately 7% in the base population (outbred Hsd:ICR mice). It is intriguing that both the compact and high-growth mutations were also originally discovered during the course of long-term selection experiments, for increased carcass protein content (Varga et al. 1997) and rapid weight gain (Bradford and Famula 1984), respectively. It is not known if the compact mutation was segregating in the base population prior to selection. For high growth, the mutation arose spontaneously after more than 20 generations of selection. The appearance of major mutations affecting a trait under selection has been documented many other times, as discussed by Varga et al. (1997). The strong selection intensity placed on quantitative traits during artificial selection experiments is well suited to take advantage of preexisting genetic variation in the base population or newly created genetic variation during the selection experiment, arising due to spontaneous mutations with major phenotypic effect.
Although our mapping efforts have succeeded in localizing MM to a reasonably small genomic interval, the goal of identifying the genetic variation responsible for the MM phenotype remains a formidable challenge. Mouse chromosome 11 is gene rich, with an average of 14 genes per Mb compared with the genome-wide average of 6.5. However, the 2.6335-Mb MM interval on MMU11 is extremely dense with genes, harboring 102 expressed and predicted genes (NCBI Build 37.1; February, 2008). Furthermore, many of the genes within this region represent viable candidates based on known physiological roles in muscle development. For example, SRY-box containing gene 15 (sox15) plays a role determining the early myogenic cell lineages during mouse skeletal muscle development (Lee et al. 2004). Mutations within cholinergic receptor, nicotinic, beta polypeptide 1 (chrnb1) have been shown to cause congenital myasthenic syndromes in humans (Quiram et al. 1999), as have mutations within the epsilon subunit (chrne), which falls just ∼500 kb distal to the MM region. Ribosomal protein L26 (rpl26) is very strongly upregulated (∼35-fold increase) in satellite cells during muscle regeneration (Kardon G, personal communication). Although we found no causal sequence variation within these 3 genes, additional polymorphisms could exist in regions outside of those in our sequencing design.
In addition to these 3 candidate genes, many of the other ∼100 genes in the MM region are expressed in muscle, and the Acadvl, Myh10, Slc2a4, and Trp53 genes all have effects on muscle when genetically modified (Mouse Genome Informatics database; February, 2008). Many of the genes in this region still have unknown function and may be involved in muscle development or regulation. Further, there are several microRNA genes (miR-324-3P, miR-497, miR-195) in the MM region that target genes with phenoconnectivity to muscle physiology. Finally, the genetic variation underlying MM could be acting via trans-regulatory effects on other genes with physiological roles in muscle development, including excellent candidates that are just ∼500 kb proximal to the MM interval (e.g., myosin, heavy polypeptide 3, skeletal muscle, embryonic; myh3). Disruption of myh3 results in reduced muscle mass similar to what is observed in MM (Acakpo-Satchivi et al. 1997; Allen et al. 2001) and a missense mutation in this gene results in autosomal dominant myopathy in humans (Martinsson et al. 2000). A polymorphism within the MM region could have regulatory effects on this closely adjacent gene or on unlinked genes that regulate muscle.
In summary, a recessive MM mutation causing reduced hindlimb muscle mass in mice has been mapped to a 2.6335-Mb interval on MMU11 containing ∼100 genes, many of which have known roles in muscle development. Identification of the genetic variation that underlies MM could potentially be very important in understanding both normal muscle function and disregulation of muscle physiology leading to disease. However, finding the DNA polymorphisms that cause MM will be very challenging given the gene density and complexity of the mapped region.
Funding
United States National Science Foundation (IOB-0543429 to T.G.); the National Institutes of Health (DK076050 to D.P.).
Acknowledgments
We are grateful to Kunjie Hua and Ryan Gordon for laboratory assistance and to Peter Sorensen for help with data management. We appreciate useful feedback from Bruce Aronow regarding the miRNAs discussed in the paper.
References
- Acakpo-Satchivi LJ, Edelmann W, Sartorius C, Lu BD, Wahr PA, Watkins SC, Metzger JM, Leinwand L, Kucherlapati R. Growth and muscle defects in mice lacking adult myosin heavy chain genes. J Cell Biol. 1997;139:1219–1229. doi: 10.1083/jcb.139.5.1219. [DOI] [PMC free article] [PubMed] [Google Scholar]
- Allen DL, Harrison BC, Sartorius C, Byrnes WC, Leinwand LA. Mutation of the IIB myosin heavy chain gene results in muscle fiber loss and compensatory hypertrophy. Am J Physiol Cell Physiol. 2001;280:C637–C645. doi: 10.1152/ajpcell.2001.280.3.C637. [DOI] [PubMed] [Google Scholar]
- Allan MF, Eisen EJ, Pomp D. Genomic mapping of direct and correlated responses to long-term selection for rapid growth rate in mice. Genetics. 2005;170:1863–1877. doi: 10.1534/genetics.105.041319. [DOI] [PMC free article] [PubMed] [Google Scholar]
- Bradford GE, Famula TR. Evidence for a major gene for rapid postweaning growth in mice. Genet Res. 1984;44:293–308. doi: 10.1017/s0016672300026537. [DOI] [PubMed] [Google Scholar]
- Garland T., Jr . Selection experiments: an under-utilized tool in biomechanics and organismal biology. In: Bels VL, Gasc JP, Casinos A, editors. Vertebrate biomechanics and evolution. Oxford: BIOS Scientific Publishers; 2003. pp. 23–56. [Google Scholar]
- Garland T, Jr, Morgan MT, Swallow JG, Rhodes JS, Girard I, Belter JG, Carter PA. Evolution of a small-muscle polymorphism in lines of house mice selected for high activity levels. Evolution. 2002;56:1267–1275. doi: 10.1111/j.0014-3820.2002.tb01437.x. [DOI] [PubMed] [Google Scholar]
- Godfrey P, Rahal JO, Beamer WG, Copeland NG, Jenkins NA, Mayo KE. GHRH receptor of little mice contains a missense mutation in the extracellular domain that disrupts receptor function. Nat Genet. 1993;4:227–232. doi: 10.1038/ng0793-227. [DOI] [PubMed] [Google Scholar]
- Guderley H, Houle-Leroy P, Diffee GM, Camp DM, Garland T., Jr Morphometry, ultrastructure, myosin isoforms, and metabolic capacities of the “mini muscles” favored by selection for high activity in house mice. Comp Biochem Physiol Part B. 2006;144:271–278. doi: 10.1016/j.cbpb.2006.02.009. [DOI] [PubMed] [Google Scholar]
- Guderley H, Joanisse DR, Mokas S, Bilodeau GM, Garland T., Jr Altered fiber types in gastrocnemius muscle of high wheel-running selected mice with mini muscle phenotypes. Comp Biochem Physiol B. 2008;149:490–500. doi: 10.1016/j.cbpb.2007.11.012. [DOI] [PubMed] [Google Scholar]
- Hannon RM, Kelly SA, Middleton KM, Kolb EM, Pomp D, Garland T., Jr Phenotypic effects of the “mini-muscle” allele in a large HR x C57BL/6J mouse backcross. J Heredity. 2008 doi: 10.1093/jhered/esn011. doi: 10.1093/jhered/esn011. [DOI] [PubMed] [Google Scholar]
- Horvat S, Medrano JF. Lack of Socs2 expression causes the high-growth phenotype in mice. Genomics. 2001;72:209–212. doi: 10.1006/geno.2000.6441. [DOI] [PubMed] [Google Scholar]
- Houle-Leroy P, Guderley H, Swallow JG, Garland T., Jr Artificial selection for high activity favors mighty mini-muscles in house mice. Am J Physiol Regul Integr Comp Physiol. 2003;284:R433–R443. doi: 10.1152/ajpregu.00179.2002. [DOI] [PubMed] [Google Scholar]
- Kelly SA, Czech PP, Wight JT, Blank KM, Garland T., Jr Experimental evolution and phenotypic plasticity of hindlimb bones in high-activity house mice. J Morphol. 2006;267:360–374. doi: 10.1002/jmor.10407. [DOI] [PubMed] [Google Scholar]
- Lee HJ, Göring W, Ochs M, Mühlfeld C, Steding G, Paprotta I, Engel W, Adham IM. Sox15 is required for skeletal muscle regeneration. Mol Cell Biol. 2004;24:8428–8436. doi: 10.1128/MCB.24.19.8428-8436.2004. [DOI] [PMC free article] [PubMed] [Google Scholar]
- Martinsson T, Oldfors A, Darin N, Berg K, Tajsharghi H, Kyllerman M, Wahlstrom J. Autosomal dominant myopathy: missense mutation (Glu-706 –> Lys) in the myosin heavy chain IIa gene. Proc Natl Acad Sci USA. 2000;97:14614–14619. doi: 10.1073/pnas.250289597. [DOI] [PMC free article] [PubMed] [Google Scholar]
- Mason AJ, Hayflick JS, Zoeller RT, Young WS, 3rd, Phillips HS, Nikolics K, Seeburg PH. A deletion truncating the gonadotropin-releasing hormone gene is responsible for hypogonadism in the hpg mouse. Science. 1986;234:1366–1371. doi: 10.1126/science.3024317. [DOI] [PubMed] [Google Scholar]
- McPherron AC, Lawler AM, Lee SJ. Regulation of skeletal muscle mass in mice by a new TGF-beta superfamily member. Nature. 1997;387:83–90. doi: 10.1038/387083a0. [DOI] [PubMed] [Google Scholar]
- Quiram PA, Ohno K, Milone M, Patterson MC, Pruitt NJ, Brengman JM, Sine SM, Engel AG. Mutation causing congenital myasthenia reveals acetylcholine receptor beta/delta subunit interaction essential for assembly. J Clin Invest. 1999;104:1403–1410. doi: 10.1172/JCI8179. [DOI] [PMC free article] [PubMed] [Google Scholar]
- Rezende EL, Gomes FR, Malisch JL, Chappell MA, Garland T., Jr Maximal oxygen consumption in relation to subordinate traits in lines of house mice selectively breed for high voluntary wheel running. J Appl Physiol. 2006;101:477–485. doi: 10.1152/japplphysiol.00042.2006. [DOI] [PubMed] [Google Scholar]
- Swallow JG, Carter PA, Garland T., Jr Artificial selection for increased wheel-running behavior in house mice. Behav Genet. 1998;28:227–237. doi: 10.1023/a:1021479331779. [DOI] [PubMed] [Google Scholar]
- Swallow JG, Rhodes JS, Garland T., Jr Phenotypic and evolutionary plasticity of organ masses in response to voluntary exercise in house mice. Integr Comp Biol. 2005;45:426–437. doi: 10.1093/icb/45.3.426. [DOI] [PubMed] [Google Scholar]
- Syme DA, Evashuk K, Grintuch B, Rezende EL, Garland T., Jr Contractile abilities of normal and “mini” triceps surae muscles from mice (Mus domesticus) selectively breed for high voluntary wheel running. J Appl Physiol. 2005;99:1308–1316. doi: 10.1152/japplphysiol.00369.2005. [DOI] [PubMed] [Google Scholar]
- Szabó G, Dallmann G, Müller G, Patthy L, Soller M, Varga L. A deletion in the myostatin gene causes the compact (Cmpt) hypermuscular mutation in mice. Mamm Genome. 1998;9:671–672. doi: 10.1007/s003359900843. [DOI] [PubMed] [Google Scholar]
- Varga L, Szabó G, Darvasi A, Müller G, Sass M, Soller M. Inheritance and mapping of Compact (Cmpt), a new mutation causing hypermuscularity in mice. Genetics. 1997;147:755–764. doi: 10.1093/genetics/147.2.755. [DOI] [PMC free article] [PubMed] [Google Scholar]
- Zhang Y, Proenca R, Maffei M, Barone M, Leopold L, Friedman JM. Positional cloning of the mouse obese gene and its human homologue. Nature. 1994;372:425–432. doi: 10.1038/372425a0. [DOI] [PubMed] [Google Scholar]