

Abstract
Although skin is usually exposed during human exposures to ionizing radiation, there have been no thorough examinations of the transcriptional response of skin fibroblasts and keratinocytes to radiation. The transcriptional response of quiescent primary fibroblasts and keratinocytes exposed to from 10 cGy to 5 Gy and collected 4 h after treatment was examined. RNA was isolated and examined by microarray analysis for changes in the levels of gene expression. Exposure to ionizing radiation altered the expression of 279 genes across both cell types. Changes in RNA expression could be arranged into three main categories: (1) changes in keratinocytes but not in fibroblasts, (2) changes in fibroblasts but not in keratinocytes, and (3) changes in both. All of these changes were primarily of p53 target genes. Similar radiation-induced changes were induced in immortalized fibroblasts or keratinocytes. In separate experiments, protein was collected and analyzed by Western blotting for expression of proteins observed in microarray experiments to be overexpressed at the mRNA level. Both Q-PCR and Western blot analysis experiments validated these transcription changes. Our results are consistent with changes in the expression of p53 target genes as indicating the magnitude of cell responses to ionizing radiation.
INTRODUCTION
The skin is the largest organ in the human body. Since a primary function of the skin is to serve as a barrier to the organism’s environment, it surrounds the entire body. Thus, when humans are exposed to external ionizing radiation, skin is always exposed. Most human exposures result from medical procedures, routine work-related exposures, or radiation accidents. After high-dose (>5 Gy) exposures, which are most likely to occur during accidental radiation exposures (1, 2), severe cutaneous damage may cause skin reactions such as erythema beginning at 2–4 weeks, dry or moist desquamation, ulceration and infection depending on the initial exposure dose (3, 4). These responses likely result from failure of keratinocyte stem cells to repopulate the epidermis and break down in the microvasculature in the skin’s dermis.
Usually skin is exposed to smaller single radiation doses during medical procedures. Recently stereotactic body radiosurgery procedures have become increasingly common, often delivering 20 Gy to the target in a single treatment. Depending on the site of the tumor, the skin may receive a very high single-dose exposure. Skin is usually exposed to small radiation doses during most diagnostic radiological procedures; the skin of patients undergoing fluoroscopic imaging may receive up to 4–7 Gy at a dose rate of 10 cGy min−1. Diagnostic procedures rarely result in observable skin reactions (5, 6). However, chronic skin responses have limited the single-fraction dose and total overall dose that could be delivered during radiation therapy. During standard static gantry radiotherapy, small areas of skin may absorb as much as 30% of each therapeutic dose fraction, or about 60 cGy per 2-Gy fraction. Larger areas of skin are exposed to smaller doses (about 10% of the therapeutic dose or 20 cGy of a 2-Gy fraction) using TomoTherapy instruments (B. J. Salter, personal communication). Thus diagnostic and therapeutic radiation procedures are designed to be in a dose range below that which would be expected to produce histological changes in the patient’s skin. Since these radiological procedures are designed to limit cytological changes in the skin, one way to evaluate the response of skin to ionizing radiation exposure would be to examine ionizing radiation-induced changes in gene expression.
Several groups have used microarray technology to assess transcriptional changes that correlate with stimulation by ionizing radiation. Studies have been performed in several model organisms like the radiation tolerant bacteria Deinococcus radiodurans (7), Drosophila (8) and murine systems (9–11). The majority of studies, with human-derived samples were performed using RNA from professional cell lines and not primary tissue cells. Some of the most frequent themes have been assessment of p53-(12–19) and NF-κB- (16, 20) responsive genes since DNA damage and inflammation are frequent consequences of radiation exposure. It should be noted that experiments in cell systems without functional p53 also demonstrate a broad range of transcriptional responses to ionizing radiation (16, 21, 22). However, across several studies, the genes involved fall into cell cycle, apoptosis, cytokine, DNA repair and stress response pathways. Some of the response pathways may reflect the particular cell types used or the use of established cell lines instead of primary tissue/cells. RNA expression in irradiated human fibroblasts (23, 24) and keratinocytes (25–27) has been examined previously. However, none of these studies included a side-by-side examination of radiation-induced gene expression in low-passage-number primary human fibroblasts and keratinocytes from the same patients. Thus we wanted to examine RNA expression changes in primary skin cells exposed to a broad dose range (10 cGy–5 Gy) of ionizing radiation.
In this study, we isolated primary fibroblasts and keratinoctyes and examined gene expression induced in low-passage primary skin cells 4 h after exposure to (10 cGy–5 Gy) of low-LET ionizing radiation. We found that there was a significant difference in the basal RNAs expressed in the two cell types. We identified 279 genes across both cell types whose expression appears to be altered after exposure to ionizing radiation. When we compared all the irradiated samples to the nonirradiated samples, we found that exposure to ionizing radiation increased the expression of 98 unique RNA species, 25 of which exhibited a greater than 1.5-fold change. These changes were primarily of p53 target genes. Using the experimental samples at particular radiation doses, we identified 59 genes at doses ≥1 Gy that demonstrated radiation responsiveness. In addition, we found that specific RNA expression changes could be arranged into three main categories: (1) greater changes in keratinocytes but smaller changes in fibroblasts (69 genes), (2) greater changes in fibroblasts but smaller changes in keratinocytes (95 genes), and (3) changes in both (nine genes). In addition, a similar set of radiation-induced changes was induced in immortalized fibroblasts or keratinocytes. For the most part, both Q-PCR on three separate donors and Western blot analysis validated these transcription changes. Our results are consistent with changes in the expression of at least some p53 target genes as indicating the magnitude of cell response to ionizing radiation.
MATERIALS AND METHODS
Tissue Collection, Preparation of Primary Skin Cells and Cell Treatment
Discarded human neonatal foreskins were collected from the LDS Hospital in accordance with the University of Utah’s Institutional Review Board Policies (IRB no. 9476). The tissue was collected at room temperature in 1× Ham’s F12 medium (Gibco) supplemented with antibiotic-antimycotic solution (Gibco-BRL 15240-039). The skin was dissected into approximately 5-mm2 sections and fibroblasts or keratinocytes were isolated as described elsewhere (28). In brief, skin sections were incubated overnight at 4°C in 1 ml of 5 mg Dispase II (Roche catalog no. 165859)/ml phosphate-buffered saline (PBS) in 35-mm petri dishes. The epidermis was peeled from the dermis and incubated in 0.05% trypsin (Invitrogen catalog no. 25300-054) in PBS for 5 min at 37°C to dissociate keratinocytes. Dissociated keratinocytes were recovered by centrifugation and placed in 25-cm2 T-25 flasks in serum-free keratinocyte medium (SFKM, Invitrogen) containing about 70 μM calcium (Invitrogen, personal communication) supplemented with antibiotics until they had reached 50–60% confluence (considered passage 0). At 50–60% confluence, keratinocytes were recovered from flasks with 0.25% trypsin, diluted 1:3 and subcultured (each subculture considered an additional passage) into new flasks. The skin’s dermis was cut into small pieces and placed into 1–2 ml of 200 U/ml collagenase for 60 min at 37°C. The collagenase solution was diluted 1:10 with PBS and the fibroblasts were pelleted, resuspended in F12 medium containing 10% fetal bovine serum, and placed into 25-cm2 T-flasks (considered passage 0). At 60–70% confluence, fibroblasts were recovered with 0.05% trypsin and diluted 1:10 into another T-25 flask (each subculture was considered one additional passage). In the following experiments, cultured skin cells were used experimentally by passage number 5. The primary cells were grown to confluence and maintained quiescent for 1 week prior to irradiation and RNA collection.
Human fibroblasts (HCA2) and keratinocytes (N-Tert1) immortalized with the human telomerase reverse transcriptase (h-TERT) were obtained from Dr. Judith Campisi, Life Sciences Division, Lawrence Berkeley National Laboratory, and Dr. James Rheinwald, Department of Dermatology, Brigham and Women’s Hospital and Harvard Skin Disease Research Center (29), respectively, and treated in a manner similar to the primary skin cells. Flasks were fed every 48 h and were used in experiments 16 h after being fed. Each repeat experiment used fibroblasts and keratinocytes from separate individuals. Both cell types were allowed to grow to confluence and remain in confluence for at least 2 days before they were irradiated with γ rays using a J. L. Shepherd Mark I 137Cs Irradiator at a dose rate of 4.7 cGy/min with internal shielding or 4.7 Gy/min without shielding. Cells were replaced at 37°C immediately after irradiation and collected at various times, as indicated in the text. Cells were washed with physiological saline and collected by scrapping the cells into RLT buffer (Qiagen, Valencia, CA) for RNA collection or into RIPA buffer (Pierce) for protein collection. Fluorescence microscopy of cultured cells was performed as described previously (25, 28).
Immunohistochemical Analysis of Neonatal Skin
Neonatal skin was collected, cut into 0.5-cm-diameter pieces, and fixed for 24 h in 10% neutral buffered formalin at ambient temperature. The tissue sections were taken to the University of Utah Pathology (ARUP) Laboratory where they were embedded in paraffin using standard procedures, and 4-μm-thick cross-sections were cut and collected onto slides. Sections were deparaffinized in xylene and hydrated in a graded series of ethanol before applying the primary antibody (Ki67). Pretreatment of the sections by heat-induced epitope retrieval was performed in an electric pressure cooker (Biomedical Care Decloaking Chamber, BioGenex Laboratories, San Ramon, CA) for 30 min in citrate buffer (pH 6.0). Staining was performed on an automated Ventana NexES immunohistochemical stainer (Ventana Medical Systems, Tucson, AZ) by applying a biotinylated secondary antibody followed by streptavidin-horseradish conjugate and the chromogen diaminobenzidine (Basic DAB kit, Ventana Medical Systems, Tucson, AZ). Slides were stained with hematoxylin and eosin. Immunoreactive (Ki67-stained) keratinocyte nuclei, primarily in the basal layer of the epidermis, were dark brown, and nonimmunoreactive nuclei were stained blue with hematoxylin. Immunoreactive or non-immunoreactive nuclei in the dermis (fibroblasts) or epidermis (keratinocytes) were counted in at least five separate high-power fields comprising at least 4,000 total nuclei counted.
Microarray Expression Analysis
The microarray experiments were performed using Agilent 44K (human whole genome) oligonucleotide microarrays (Agilent, Santa Clara, CA) and processed on site in the Microarray Resource located within the Huntsman Cancer Institute. For these experiments, we used total RNA from one patient sample as well as total RNA from the immortalized cell lines.
After irradiation, the cell cultures were placed back into an incubator and RNA was collect after 4 h. RNA concentration was determined with a Nanodrop spectrophotometer, and sufficient total RNA was recovered using the Qiagen RNeasy minikit protocol for the analysis (for the primary fibroblasts, we averaged ~7 μg per 25-cm2 flask; for the immortalized fibroblasts, we averaged ~16 μg per 25-cm2 flask; for the primary keratinocytes, we averaged ~50 μg per 25-cm2 flask; and for the immortalized keratinocytes, we averaged nearly 60 μg per 25-cm2 flask). Quality of the RNA was monitored using an Experion automated electrophoresis station (Bio-Rad, Hercules, CA) with standard sensitivity RNA chips. Agilent labeling kits were used to amplify and generate Cy-dye-labeled cRNA for hybridization to Agilent oligonucleotide arrays.
Transcript levels were assessed on each channel and quantified by Agilent Feature Extraction software. This software preprocesses the data as follows. Local background is subtracted, irregular spots are flagged, and global linear regression (lowess) normalization is performed, and this ratio is log transformed. We import the data into TIGR MEV 3.1 software for further analysis. Generally, we use a supervised strategy to identify the genes with the greatest significant differences between cells stimulated with radiation compared to unstimulated cells using the Significance Analysis for Microarrays (SAM) (30), Pavlidis Template Matching (PTM) (31), Rank Products Analysis (RP) (32), Gene Set Enrichment Analysis (GSEA) (33), and Expression Analysis Systematic Explorer (EASE) (34) methodologies. The data used in these analyses have been deposited in the Gene Expression Omnibus (GEO accession number: GSE14466).
Quantitative PCR Analysis
Quantitative PCR (QPCR) was performed to validate the microarray data plus two additional primary skin-derived samples. All amplicons were designed to be less than 150 bp in length, with primers that would anneal at about 58°C, and span an intron of the gene of interest in its genomic context. Primers used included: CDKN1A forward 5′-CCTCATCCCGTGTTCTCCTTT-3′, and CDKN1A reverse 5′-GTACCACCCAGCGGACAAGT-3′; NINJ1 forward 5′-TCATCTCCATCTCCCTTGTGCT-3′, and NINJ1 reverse 5′-AGTCCAGCTTGGCGTGCTT-3′; SESN1 forward 5′-TACCTCAATGCTTAGACGGGCA-3′, and SESN1 reverse 5′-TCAGGAGTGCAAACAACAGTTT-3′; HPRT1 forward 5′-TGA-CACTGGCAAAACAATGCA-3′, and HPRT1 reverse 5′-GGTCCTTTTCACCAGCAAGCT-3′. HPRT1 was used as the internal control to measure relative changes in expression.
Copy number standards were generated by cloning the amplicon of all PCR products except CDKN1A into the pSC-A PCR system (Agilent/Stratagene). CDKN1A standards were generated from an expression vector containing the coding sequence that we have used previously (35). Since the amount of RNA was limiting for some samples, mRNA was amplified using MessageAmp II amplification kits (Ambion/Applied Biosystems, Austin, TX). From the cRNA, 500 ng of RNA was used for first-strand cDNA synthesis using Superscript III (Invitrogen, Carlsbad, CA) and random nonamer primers (150 ng/reaction). The cDNA was diluted 1:5 and then used in SYBR Green I (Cambrex) quantitative PCR assays [using Biolase DNA polymerase, dNTPs, magnesium chloride, and NH4 reaction buffer (Bioline, Tauton, MA)].
Cell Protein Collection, Gel Electrophoresis and Analysis by Western Blotting
After treatment, cell cultures were replaced into the incubator for the times indicated in the text. Cell protein was collected by scraping cells into a RIPA buffer (Pierce) supplemented with a 1:100 dilution of a protease inhibitor cocktail (Sigma catalog no. P1860), a serine phosphatase inhibitor cocktail (Sigma catalog no. P-2850), and a tyrosine phosphatase inhibitor cocktail (P-5726). Protein content was determined using a Bradford colorimetric reaction (Bio-Rad). For primary fibroblasts, we averaged 172 μg protein per T-25 flask, and for primary keratinocytes, we averaged 296 μg protein per T-25 flask. Protein samples (approximately 10 μg/lane) were electrophoresed through NuPage (Invitrogen) Bis-Tris, 4–12% polyacrylamide gradient gels (Invitrogen) in MES/Tris-SDS running buffer at 150 V and electrotransferred onto a PVDF membrane at 240 mA at 4°C. Gels were stained with Sypro Ruby total protein stain (Molecular Probes catalog no. S12000), imaged with a FX Imager (Bio-Rad) and the images quantified using Quantity One software (Bio-Rad).
Alternatively, protein was electrotransferred to the PVDF membranes and detected using primary antibodies (see below) dissolved in Tris-buffered saline (TBS) containing 0.1% Tween 20 and 5% NFDM. Primary antibodies were identified using a horseradish peroxidase (HRP)-labeled secondary antibody and exposure to Amersham Hyperfilm ECL photographic film using Amersham ECL chemiluminescence reagents according to the manufacturer’s recommendations. Exposed films were scanned with a Bio-Rad Model GS-700 Imaging Densitometer and quantified using Quantity One software. Density units for each gel band were corrected for variations in loading using the actin or tubulin protein as an internal loading standard.
Antibodies
The mouse monoclonal antibody, clone DO-1 (catalog no. OP43) against the p53 protein was purchased from Calbiochem. A mouse monoclonal antibody against α-tubulin (catalog no. 32-2500) was purchased from Zymed. Mouse monoclonal antibodies against CDKN1A (catalog no. OP64) and MDM2 (catalog no. OP146) were purchased from Oncogene/Calbiochem. A goat polyclonal antibody against Sestrin (catalog no. sc-9506) and a goat polyclonal antibody against human actin (catalog no. sc1616) were purchased from Santa Cruz Biotechnology. A mouse monoclonal antibody against Ninjurin 1 (catalog no. 610776) was purchased from BD Transduction Laboratories. A mouse monoclonal antibody against involucrin (catalog no. MS-126-P) was purchased from NeoMarkers. A mouse monoclonal antibody against Ki-67 (catalog no. M7240) was purchased from DAKO USA. A mouse monoclonal antibody against DNA topoisomerase II α was provided by Dr. Joe Holden of the University of Utah Department of Pathology (36).
RESULTS
Characterization of Cultured Skin Cells
In this study, we wanted to examine the impact of ionizing radiation exposure on gene expression in cultured skin cells. Since few fibroblasts or keratinocytes are cycling in the intact skin, we assumed that confluence would best mimic the in vivo growth conditions of both fibroblasts and keratinocytes. To test this assumption, we examined the expression levels of proliferation-specific proteins in confluent skin cells using fluorescence microscopy and in intact neonatal human skin by immunohistochemistry (Table 1 and Supplementary Information). When methanol-fixed, confluent monolayers of fibroblasts were stained for the expression of the Ki67 (a proliferation-related protein) or topoisomerase II alpha (a protein expressed primarily in the G2 phase of the cell cycle) epitopes, less than 1% of the cells were stained by either antibody. This level of staining is similar to the level (i.e., less than 1%) observed in the dermis of intact, neonatal human skin (Table 1). Thus we assume that confluent fibroblasts mimic the growth state of fibroblasts in the skin’s dermis in vivo. In contrast, when confluent keratinocytes were stained for the expression of Ki67 or topoisomerase II alpha proteins, approximately 75 and 12%, respectively, of the cells were stained. When we examined neonatal skin by immunohistochemistry (Fig. 1), the levels of expression of these two proteins in intact skin epidermis were found to be approximately 6 and 2%, respectively. Thus more keratinocytes appear to be capable of cycling in confluent monolayer cultures than in the in vivo skin epidermis.
TABLE 1.
Expression of Proliferation Markers in Skin Tissues and in Cultured Skin Cells
| Relative expression levela |
|||||
|---|---|---|---|---|---|
| Group | Ki67b | Topo II αb | TP53c | TP53S15pd | CDKN1Ad |
| Dermis | <0.01 | <0.01 | 0.04 | 0.20 | ND |
| Epidermis | 0.06 | 0.02 | 1.00 | 1.00 | ND |
| Fibroblasts | <0.01 | <0.01 | 0.02 | 0.10 | 0.17 |
| Keratinocytes | 0.75 | 0.12 | 1.00 | 1.00 | 1.00 |
All in vitro results are from cultured skin cell cultures combined from at least three separate individuals.
Fixed and paraffin-embedded, intact neonatal skin or cultured, confluent, primary skin fibroblasts or keratinocytes were analyzed for the expression of the Ki67 or the TopoII alpha epitope by immunohistochemistry (fixed tissues) or immunofluorescence (fixed cells). Results are expressed as the fractions of cells that were immunostained. Greater than 25% of dermal endothelial cells stained for expression of the Ki-67 epitope.
Untreated skin epidermis or dermis, confluent fibroblasts or keratinocytes were analyzed by Western blotting for the expression levels of the p53 protein using the clone DO1 monoclonal antibody. The level of expression relative to epidermis in the skin or relative to keratinocytes in cultured cells (i.e., p53 ratio) was determined by scanning exposed photographic films.
The relative expression levels of p53 phosphorylated at serine 15 or CDKN1A, normalized to actin and then to the level in epidermis or keratinocytes set at 1.0, was determined in epidermis or dermis of ex vivo skin or in keratinocytes or fibroblasts 60 min after exposure to 2 Gy. In all cases, the average of three separate repeat determinations is used.
FIG. 1.

Variation in p53 protein expression during keratinocyte differentiation. Panel A: Primary keratinocytes were plated at approximately 10% confluence and collected by trypsinization after they had reached 10, 25, 50, 75 and 90% confluence. Plotted is the fraction of p53 (p53 signal measured by Western blot analysis at various levels of confluence over the p53 signal measured in 90–100% confluent cells; set at 1.0). Panel B: Expression of actin (internal standard), TP53 and involucrin (a differentiated keratinocytes protein) in confluent keratinocytes as a function of time (as indicated) in 0.07 mM or 1.2 mM calcium. Panel C: Graphic comparison of changes in the TP53 (filled squares; plotted as a fraction of the level expressed at day 1) or involucrin (open squares; plotted as the increased expression relative to the level on day 1), both normalized for actin expression, with increasing days of culture in 1.2 mM calcium. In Panel B, the total involucrin signal both in the main involucrin band and in the “smear” of crosslinked involucrin protein was included in the calculation of the increase in involucrin.
To further examine the state of confluent keratinocytes, we measured the expression of the differentiation protein involucrin by Western blot analysis. When grown in low-calcium (about 70 μM) SFKM medium, the cellular content of p53 protein increased approximately 10-fold as the keratinocytes approach 100% confluence (Fig. 1A). If keratinocytes reached confluence and were fed every 2 days with low-calcium medium, the level of p53 remained relatively high and the level of involucrin, differentiated keratinocyte protein characteristic of suprabasal keratinocytes in the skin’s epidermis (37, 38), remained relatively low (Fig. 1B). When keratinocytes were shifted to SFKM containing 1.2 mM calcium, p53 content declined rapidly and the level of involucrin increased rapidly (Fig. 1C). While monolayers of confluent keratinocytes in both 70 μM and 1.2 mM calcium exhibited a similar cobblestone appearance, only keratinocytes cultured in 1.2 mM calcium expressed high levels of involucrin and became significantly flattened. Since p53 is expressed primarily in the basal layers of the epidermis (39–41) while very little involucrin is expressed in the basal layer, we conclude that keratinocytes maintained in low-calcium confluent culture are more characteristic of keratinocytes in the basal layer of the neonatal skin’s epidermis.
Gene Expression Analysis
We examined the differences in expression between the primary keratinocytes and primary fibroblasts as well as differences between the immortalized keratinocytes and immortalized fibroblasts. In both comparisons, we observed >8000 array elements indicating differential expression among the cell types. This number is large compared with the total number of array elements, and therefore it is difficult to normalize these arrays for further analysis. However, these differences in expression suggest clear phenotypic distinctions of the cell types. In all other microarray experiments, the expression profile of an experimental sample exposed to radiation was normalized to the nonirradiated sample of its corresponding cell type. We next exposed primary or immortal skin cells to increasing radiation doses (i.e., 10 cGy, 1 and 5 Gy) and collected total RNA 4 h after exposure to assess gene expression by microarray analysis. We can identify hundreds of genes (EASE analysis confirmed that genes involved in extracellular matrix production have reduced expression while cell cycle genes are potentiated) with differential expression between the primary and immortalized cells, but when comparing the responses to ionizing radiation between these cells and cell lines, the radiation responses are not detectably different. Significance analysis was not able to identify genes with compelling differences in radiation response.
Using the entire data set, and without regard for the differences in radiation dose, we used one-way Significance Analysis of Microarrays (SAM) and selected the top ~100 genes that displayed an ionizing radiation response in the human skin cell samples. The SAM analysis identified 106 features, representing 98 unique genes that displayed altered gene transcription resulting from radiation exposure and displayed median false discovery rate (FDR) of ~4% (Fig. 2, supplementary tables). Some of these genes demonstrated only modest changes in expression, and less than 25% of these genes showed, on average, greater than 1.5-fold changes in expression between the ionizing radiation-treated and control cells. EASE annotation analysis using the Gene Ontology and KEGG data sets suggested that genes involved in DNA damage responses and apoptosis were the most enriched gene sets.
FIG. 2.
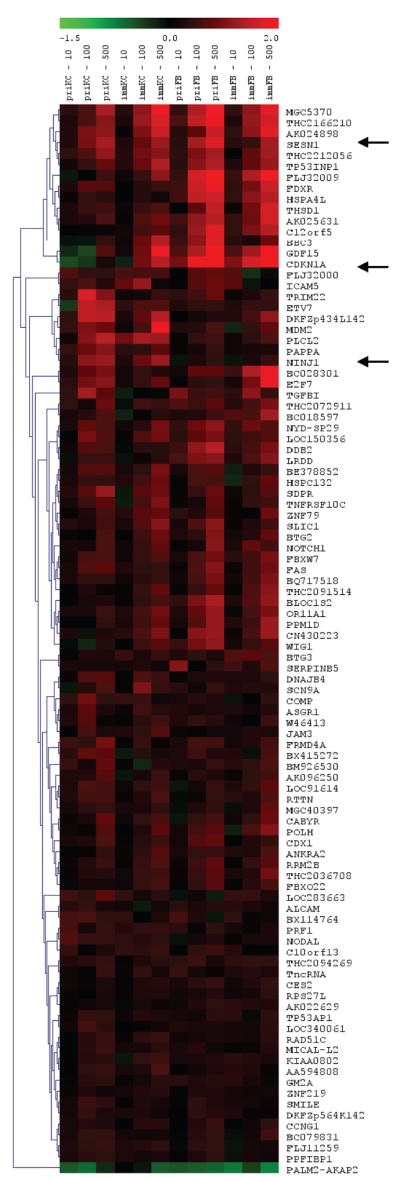
Hierarchical clustering of the 98 genes that were identified by one-way SAM demonstrating a radiation-induced effect on transcription. The samples are identified at the top, under the heat map scale for gene expression changes, for primary keratinocytes (priKC), immortalized keratinocytes (immKC), primary fibroblasts (priFB), and immortalized fibroblasts (immFB). The dose of ionizing radiation is indicated at the top in cGy (10, 100, 500). Genes are identified along the right by their official gene symbols. Three genes, SESN1, CDKN1A and NINJ1, are indicated with arrows because they were the focus of additional analyses.
Since the microarray data displayed only modest alterations in expression, rank ordering data can be an effective way to evaluate gene expression changes when the signal is modest compared to the noise. For each dose of ionizing radiation, we used Rank Products (RP) analysis but did not find genes that displayed differential gene expression compared to the control cells at 10 cGy. However, with the 1-Gy samples, we observed 13 genes that displayed increased expression after irradiation and included the annotated genes SESN1, CDKN1A, GDF15, FDXR and HSPA4L as well as seven poorly annotated genes (Fig. 3A, supplementary tables). A similar analysis using the 5-Gy samples identified 58 genes, with 39 overlapping with those identified previously by SAM (>65% overlap), but additional genes identified included GADD45A and PCNA, genes that have frequently been associated with p53 and ionizing radiation responsiveness (42, 43) (Fig. 3B, supplementary tables). All of the genes identified in the 1-Gy samples but one also were found to be induced in the 5-Gy samples.
FIG. 3.

Expression profiles for genes identified by Ranked Product (RP) analysis. Panel A: Expression profiles of genes found to be induced at 1 Gy. Panel B: Expression profiles of genes found to be induced at 5 Gy. Listings of the specific genes can be found in the supplementary tables. Cell types and doses are annotated as in Fig. 2.
While these analyses indicate that we were able to identify few robust changes, several aspects of this analysis must be noted. (1) Many, if not most, of the genes that show differential expression are consistent with p53 regulation (i.e. MDM2, CDKN1A, SESN1, BBC3, TP53INP1, WIG1, CCNG1, NINJ1, BTG2, FBXW7, GDF15, FDXR, GADD45A, PCNA and RRM2B). (2) These experiments were from a single time that was designed to examine relatively early changes in expression that may become more robust at another time. (3) These analyses did not use the entire radiation dose response or account for the cell types. Therefore, when we examined the expression profiles of these genes among both keratinocytes and fibroblasts, we looked for genes that demonstrated profiles that may correspond with the radiation dose by Pavlidis Template Matching (PTM) (31) and subsequent Gene Set Enrichment Analysis (GSEA) (33). Using PTM to identify genes that demonstrated cell-type specific responses to the ionizing radiation, we identified the p53-regulated genes SESN1, CDKN1A, and NINJ1 as templates for additional analysis.
The expression profile of SESN1 appears to correlate highly with radiation dose in both keratinocytes and fibroblasts. The SESN1 profile was used as a seed profile to find genes that show a similar response using PTM. We selected genes by allowing for absolute R values greater than 0.85 and with a P < 0.0001 and found that only eight additional genes were similar to the SESN1 profile (Fig. 4A, supplementary tables). Since this gene set was small, we used a complementary approach; we reevaluated the entire gene set using GSEA. Again, this method rank orders the expression profiles in an attempt to improve signal when low signal to noise is suspected. With this approach we used Pearson correlation of gene expression to the ionizing radiation dose to identify gene sets enriched in this data set that have been identified in curated gene sets in the Molecular Signatures Databases, including chemical and genetic manipulation data sets, BioCarta data sets, KEGG data sets and the molecular functions data set from the Gene Ontology database. With gene set size filters of a minimum 15 genes or a maximum of 500 genes, we evaluated 1526 gene sets in the database, and we found statistical enrichment of two data sets associated with p53 transcriptional regulation (FDR q value = 0.156; Fig. 5A, supplementary tables) (44) and p53 function in the context of DNA-damaging agents (FDR q value = 0.146; Fig. 5B, supplementary tables) (45). GSEA identified 28 genes as significantly enriched in these gene sets with 20 overlapping with genes identified in the analyses described previously (>70% overlap). The eight additional p53-regulated genes were PMAIP1, ENC1, P53AIP1, BAX, XPC, FOS, IER3 and DUSP14.
FIG. 4.

Expression profiles for genes that demonstrate similar or inverse profiles (absolute R > 0.85, P < 0.0001) by template matching to (panel A) SESN1, (panel B) CDKN1A and (panel C) NINJ1. These genes were chosen because they show cell type selective radiation responsiveness. SESN1 showed responsiveness in both fibroblasts and keratinocytes, while the CDKN1A response was more pronounced in fibroblasts and the NINJ1 response was more pronounced in keratinocytes. SESN1, CDKN1A and NINJ1 profiles are depicted with black lines, and the additional genes are depicted with gray lines. Listings of the specific genes can be found in the supplementary tables. Cell types and doses are annotated as in Fig. 2.
FIG. 5.

Expression profiles of the genes identified by GSEA analysis where the correlation of the expression profile to the ionizing radiation dose was used to identify enriched gene sets. Panel A: P53_ALL gene set match; panel B: BLEO_ HUMAN_LYMPH_-HIGH_4HRS_UP gene set match. Listings of the specific genes can be found in the supplementary tables. Cell types and doses are annotated as in Fig. 2.
CDKN1A has consistently been linked with p53 function and was identified in the original SAM analysis of ionizing radiation samples at a dose of 5 Gy (30). However, CDKN1A was not identified as displaying a SESN1-like profile among these skin cell experiments. CDKN1A, displayed a much more pronounced radiation dose response in the fibroblasts and the immortalized keratinocytes (to a lesser degree) but showed little response in the primary keratinocytes. Therefore, we performed PTM using CDKN1A as the seed profile. With similar cut-offs, we found 94 additional genes with high similarity to the CDKN1A profile (absolute R > 0.85 and P < 0.0001) (Fig. 3B, supplementary tables).
Since the expression profile of CDKN1A indicated that there may be radiation response distinctions between primary fibroblasts and keratinocytes, we identified NINJ1 as a candidate for a more profound response in the keratinocytes. Again, we used the NINJ1 profile for PTM analysis and found 68 additional genes that fit the criterion we indicated above (R > 0.85 and P < 0.0001) (Fig. 3C, supplementary tables). NINJ1 had been identified previously as a radiation responsive gene in the skin, but at a considerably higher dose (46).
Since there was considerable overlap among some of the gene sets identified in the analysis described above, Venn diagrams were used to explore the interrelationships of the genes found. When we examined the overlap of the SAM, PTM and RP analyses (Fig. 6A), we identified 14 core elements; seven were poorly annotated, but six were characterized as p53-modulated genes: SESN1, CDKN1A, NINJ1, FBXW7, C12orf5 (also known as TIGAR) and BBC3. However, as indicated above, the PTM analyses using SESN1, CDKN1A and NINJ1 as templates did not display much overlap, and thus the interrelationships of these genes with the genes identified using SAM were explicitly analyzed for overlap. Because these genes were chosen for distinct profiles, it was not surprising that there was minimal overlap (Fig. 6B). Overall, 279 genes were identified in these analyses, including the eight p53-regulated genes that GSEA indicated were enriched that were not identified in the other analyses.
FIG. 6.

Venn diagrams demonstrating the inter-relatedness gene sets in the various analytical methods. Panel A: Overlap of SAM, RP and PTM analyses with the numbers indicating the number of genes in each component. Panel B: Overlap of the component parts of the PTM analyses with the SAM analysis.
To validate the expression profiles observed with the microarrays and evaluate the consistency of the response, fibroblasts and keratinocytes from three donors were grown and the relative expression of SESN1, CDKN1A and NINJ1 was evaluated by quantitative PCR using HPRT1 as an internal expression control gene (Fig. 7A–C, respectively). The QPCR demonstrated greater changes in gene expression than were observed in the microarray samples. The CDKN1A, NINJ1 and SESN1 keratinocyte profiles correlate well with the microarray expression data; however, the SESN1 fibroblast profile did not demonstrate the magnitude of ionizing radiation-dependent expression to the SESN1 keratinocyte profile that would have been expected from the microarray data. Still, SESN1 expression in the fibroblasts did show an increase at the highest dose evaluated (Fig. 7A). These samples demonstrated reasonably consistent expression profiles across the donor samples, especially for SESN1 and NINJ1. The fibroblast data for CDKN1A indicated that not all samples respond similarly, with two of the donor samples displaying increased CDKN1A expression that was very similar across the dose range used, while one donor displayed a minimal response to the radiation.
FIG. 7.

Quantitative PCR to evaluate the dose-dependent responses of (panel A) SESN1, (panel B) CDKN1A and (panel C) NINJ1 in primary fibroblasts (▼;) and keratinocytes (▲) from three distinct tissue donors. The QPCR of CDKN1A and NINJ1 validated the microarray expression data for fibroblasts and keratinocytes, respectively, demonstrating dose-dependent radiation responses. SESN1 continued to demonstrate a dose-dependent response in keratinocytes but fibroblasts did not demonstrate the expected response. Data are presented as means ± SE.
Protein Expression Analysis
We then validated RNA expression results by examining cell protein changes by immunochemical analysis. Protein was collected from untreated fibroblasts and keratinocytes. The concentration of protein in each cell extract was estimated using the Bradford reaction, and approximately 10 μg of cell protein was electrophoresed through each gel lane. Gels were stained with Sypro Ruby fluorescence protein stain and imaged with a Bio-Rad imager. We assumed that equal Sypro Ruby stain could be used to equalize the amount of protein from each cell type. Western blot analysis was also performed on a similar set of gels to determine the relative levels of expression of p53 and p53-target proteins in keratinocytes and fibroblasts. Per equivalent protein, the level of expression of total protein (estimated by Sypro Ruby staining), alpha tubulin, TP53, CDKN1A, MDM2, SESN1 and NINJ1 in primary keratinocytes relative to primary fibroblasts was 1.24, 0.3, 19.6, 0.4, 2.3, 50.0 and 5.3, respectively.
Primary fibroblasts or keratinocytes were exposed to 5 Gy of γ radiation, replaced at 37°C, and collected at various times after treatment, as indicated, for Western blot analysis. Changes in the level of p53 protein per cell were used to indicate whether cells actually responded to radiation. The cellular level of p53 increased in both cell types after irradiation, with the maximum level of p53 observed at 2 h (an increase of 7.7 or 2.8 in fibroblasts or keratinocytes, respectively). The level of p53 returned to untreated levels by 4 h in keratinocytes, while it remained high for up to 8 h in irradiated fibroblasts.
In addition to p53 protein levels, we evaluated the protein expression levels of the representative genes evaluated by QPCR above (Fig. 8). SESN1 protein levels remained about the same for up to 8 h after fibroblasts were exposed to 5 Gy; there was a significant increase in SESN1 in irradiated keratinocytes. These results are more similar to the QPCR results, where there was a significant increase in SESN1 in irradiated keratinocytes and practically none in the fibroblasts. In contrast, with the microarray results, there was an increase in SESN1 in both fibroblasts and keratinocytes, the increase being greater in the fibroblasts. A radiation-induced increase in the CDKN1A protein was observed in both keratinocytes and fibroblasts. The increase was more robust in keratinocytes than in fibroblasts. In contrast, both the microarray and QPCR analyses indicated that there is a significantly greater increase in the CDKN1A RNA in fibroblasts than in keratinocytes. In contrast to both the microarray and QPCR results where NINJ1 RNA increased postirradiation more robustly in keratinocytes, Western blot analysis indicated that there was a more or less equivalent increase in the level of the NINJ1 protein in both keratinocytes and fibroblasts.
FIG. 8.

Radiation-induced changes in expression of p53 target proteins. Cells were exposed to 5 Gy or left untreated, returned to 37°C, and collected at various times after treatment, as indicated. Approximately 10 μg of protein from each cell group was separated through polyacrylamide gels and analyzed by Western blotting for the expression of various proteins (as indicated). The amount of protein signal at various incubation times divided by the amount of protein signal in the untreated cells was calculated and is provided for each time.
DISCUSSION
Humans are frequently exposed to ionizing radiations from medical procedures, occupational exposures or accidental exposures. High-dose whole-body exposures greater than 2.5–5 Gy, as might be expected from accidental exposures, produce well-characterized whole-body responses that are predictive of exposure dose (47). Recognizable morphological and cytochemical changes are also observed in human skin exposed to doses in this range (6, 48). At the lower radiation doses (i.e., less than 50 cGy) used in most medical radiological procedures, normal tissue, including the skin, is spared as much as possible. This results in few if any visible or cytochemical changes in exposed skin. Thus at these lower radiation doses there are no readily available markers that predict either the exposure dose or the likely response of the exposed individual. The question we wanted to ask in this work was whether cells of normal tissue recognize and respond to radiation exposures below 50 cGy, and if so, whether any of the resulting response elements are robust enough across this low-dose range to be useful predictors of low-dose exposures.
To answer these questions, we evaluated the early radiation response of the two most common skin cell types, primary fibroblasts, which represent the dermis, and keratinocytes, which represent the epidermis. For certain genes, it is noteworthy that two distinct cell types had a similar dose response (Figs. 3 and 4A). We assumed that the radiation response of confluent primary skin cells would reflect the response of their counterparts in intact skin. Another benefit of using confluent cells is that confluent cell cultures should minimize the impact of gene or protein changes that are dependent on cell cycle signaling, which occurs exclusively in proliferating cell cultures (49). Transcriptional responses to ionizing radiation over a broad dose range frequently produce alterations in genes or gene products consistent with cell cycle phase arrest and repair in skin cells (16, 24, 50, 51). Confluent cultures of fibroblasts exhibited an extremely low level of proliferation that is characteristic of fibroblasts in the intact skin’s dermis (Table 1). In contrast, keratinocytes grown to confluence in our low-calcium medium retain a higher content of p53 (Fig. 1), a higher proliferation rate (Table 1), and a higher content of the differentiation protein involucrin (Fig. 1) than keratinocytes in the skin’s epidermis or keratinocytes cultured in 1 mM calcium medium (52, 53). Thus the keratinocyte cultures used in our experiments were more similar to keratinocytes in the basal layer of the skin than the more differentiated keratinocytes in the outer layers of human skin.
Confluent fibroblasts in culture appear to mimic fibroblasts in the intact skin dermis adequately. Designing a cultured keratinocyte model that adequately mimics keratinocytes in vivo is more difficult since keratinocytes are in multiple proliferative and differentiation states in the epidermis. Basal layer keratinocytes are a dividing transit cell compartment and divide to replace themselves as well as the terminally differentiating, noncyling keratinocytes in the suprabasal layers of the epidermis. Thus keratinocytes in the epidermis have a slowly cycling component (i.e., the basal cells) and a noncycling and differentiated component (i.e., the squamous and spinous cells) (37). Since we found that subconfluent keratinocytes proliferate three to four times faster in low (about 0.07 mM) extracellular calcium than in 1.2 mM calcium, healthy monolayers of primary keratinocytes were produced in low calcium. Ninetythree percent of cycling keratinocytes were found to be stained with the Ki67 antibody, and 62% of these cells were stained with the topoisomerase II alpha antibody. While keratinocytes maintained in confluence in low extracellular calcium retained the capacity to proliferate (75%, as shown by their Ki67 stainability; Table 1), they have a small cycling component (about 10% cycling as shown by their staining for topoisomerase II alpha expression; Table 1). These observations indicated to us that confluent keratinocytes maintained in low extracellular calcium mimic the basal keratinocytes in the intact skin epidermis that cycle slowly and retain the capacity to proliferate (Fig. 1, Supplementary Results). In contrast, confluent keratinocytes switched into high extracellular calcium begin to flatten significantly within 12 h, exhibit a reduction in expression of cell cycle proteins such as p53 [Fig. 1B and C; ref. (53)] and exhibit an increase in the expression of differentiated keratinocyte proteins such as involucrin [Fig. 1B and C; refs. (54, 55)]. In a preliminary experiment, we found that confluent keratinocytes left in high extracellular calcium for 7 days or epidermis exhibited thousands of up-regulated genes, including the keratins 1 and 10, involucrin, loricrin and transglutaminase 1, 3 and 5, as well as thousands of down-regulated genes relative to proliferating keratinocytes. Thus confluent keratinocytes in high extracellular calcium are characteristically different from keratinocytes in low calcium and have properties that are much more similar to those of the differentiating or highly differentiated keratinocytes in the suprabasal layers of the epidermis. Since exposing human skin to ionizing radiation is more likely to induce basal cell carcinoma (56), we decided to examine cultured keratinocytes (i.e., confluent keratinocytes in low extracellular calcium), which are most similar to basal keratinocytes.
It is questionable whether 2D-cultured keratinocytes can completely mimic keratinocytes in the 3D environment of the in vivo epidermis. Ultimately a more informative approach is to examine keratinocytes in a 3D environment. In the 3D environment, keratinocytes interact not only with each other but with other cell types both in the epidermis and in the dermis. One 3D model system that might serve this purpose is synthetic skin, or a skin equivalent, produced by combining primary human skin fibroblasts and keratincoytes. Skin equivalent systems are available commercially (e.g., www.matek.com). A 3D system that is most likely to mimic the response of keratinocytes to ionizing radiation would be intact human skin. Since it is unethical to irradiate healthy individuals to examine ionizing radiation responses, alternative models would be ex vivo human skin irradiated in vitro (57) or skin recovered from patients irradiated during radiation therapy (58, 59). Results in whole skin recovered from irradiated patients should be considered the “gold standard” for radiation-induced changes in human skin gene expression changes. In a group of studies of this nature, it was found that exposure to ionizing radiation up-regulated transcription of genes involved in the Akt/phosphoino-sitide-3-kinase pathway, the growth factor/insulin pathway, the inflammation pathway, the stress/apoptosis pathway, and the transforming growth factor β/cyclin/ ubiquitin pathway.
When RNA was recovered from these confluent cell cultures, the RNA expression profile quantified using Agilent microarrays was significantly different in fibroblasts and keratinocytes. However, the majority of the radiation-responsive genes displayed low levels of transcriptional alterations; only 113 genes were reproducibly expressed with a twofold difference. There were no significant differences in radiation response in the RNA expression profiles of primary cells and their telomerase (hTERT)-immortalized counterparts. Thus it is likely that comparisons between radiation-induced changes in RNA expression in immortalized skin cells may provide results similar to those produced in primary skin cells.
Confluent primary fibroblasts or keratinocytes were exposed to a wide range of doses of ionizing radiation (10 cGy to 5 Gy) and collected 4 h after treatment, and their RNA profiles were analyzed by microarray analysis. The microarray analysis demonstrated that radiation induced only modest changes in gene expression over the dose range used (Fig. 2). The levels of gene expression we observed were similar to those observed by others (23); however, we observed only minimal overlap of the genes that demonstrated the most significant expression changes in response to ionizing radiation. Our analyses data did not identify a large total number of genes that were responsive to ionizing radiation, perhaps due to the short time after exposure or the level of quiescence in our cell cultures. Still, using multiple analysis methods, we identified an enrichment of genes that are involved in cell cycle control, response to DNA damage, DNA repair, apoptosis and ubiquitin/proteasome pathways; however, the most telling categorization of the genes was clearly p53 responsiveness, because p53 regulates genes involved in all of these cellular pathways. The SAM, RP and GSEA methods all identified groups of significantly enriched genes that demonstrated p53 responsiveness. PTM, based on the p53 target genes CDKN1A, SESN1 and NINJ1, identified additional genes that demonstrated cell type-specific responses.
Detection of gene expression changes began to be observed at 1 Gy, exposure to 5 Gy resulted in many alterations in gene expression, but we were unable to observe significant gene expression changes at 10 cGy. Detection of gene expression differences at these low doses was demonstrated by subsequent analysis by RT-PCR. The PCR results indicate that while significant responses may be difficult to detect in either cell type by microarray analysis, keratinocytes do detect a radiation dose as low as 10 cGy and respond to it by modification of RNA expression. Radiation-induced responses in fibroblasts required larger radiation doses.
While some of the genes identified in our microarray analysis and then quantified by PCR analysis did exhibit a dose dependence for low radiation doses (Figs. 4 and 7), we must conclude that a microarray analysis of RNA extracted from primary fibroblasts or keratinocytes, and by extension from normal tissue, that had been exposed to 10 cGy would not demonstrate a change in gene expression that would be significant enough to be reliable as a predictor of low-dose exposure. However, our gene expression results were measured only at 4 h, the earliest response expected for irradiated cells. It may be that these changes observed at 4 h may lessen with increasing time after irradiation and that other changes in gene expression may occur later after exposure to ionizing radiation. Robust late changes in gene expression that occur at low doses and persist may be a better predictor of response. Alternatively, post-translational protein modifications have been observed in selective signal transduction pathways (60). Furthermore, others have identified the time course of additional proteomic responses in the skin to ionizing radiation using a murine system (61). Again, many of the protein alterations as a response to ionizing radiation were post-translational modifications that were identified by 2D differential gel electrophoresis and mass spectrometry.
Our results are consistent with p53 being the prime modulator of gene expression responses in keratinocytes and fibroblasts. The changes in the expression of p53 target genes are indicative of the magnitude of the response of cells to ionizing radiation. However, the distinct cell types displayed minimal overlap in the genes demonstrating a transcriptional response to ionizing radiation. In other words, even though p53 target genes dominated the transcriptional response, the epithelial-derived keratinocytes and the mesenchymal-derived fibroblasts demonstrate selectivity in the particular p53 transcriptional responses.
Supplementary Material
Acknowledgments
This work was funded by grant number DE-FG02-05ER64085 from the Department of Energy Low Dose program (RLW) and PID9609061 (DKG) from the Huntsman Cancer Institute. We also acknowledge the use of core facilities supported by P30 CA042014 awarded to Huntsman Cancer Institute. We acknowledge immunohistochemistry done by the ARUP pathology laboratory. The authors would like to thank Dr. J. Holden for the kind gift of the antibody to the topoisomerase II alpha protein.
Footnotes
SUPPLEMENTARY INFORMATION
Supplementary Figure. Expression of the Ki67 epitope in neonatal human skin. http://dx.doi.org/10.1667/RR1677.1.S1
SupplementaryTables.http://dx.doi.org/10.1667/RR1677.1.S2
References
- 1.Hirama T, Tanosaki S, Kandatsu S, Kuroiwa N, Kamada T, Tsuji H, Yamada S, Katoh H, Yamamoto N, Akashi M. Initial medical management of patients severely irradiated in the Tokai-mura criticality accident. Br J Radiol. 2003;76:246–253. doi: 10.1259/bjr/82373369. [DOI] [PubMed] [Google Scholar]
- 2.Steinert M, Weiss M, Gottlober P, Belyi D, Gergel O, Bebeshko V, Nadejina N, Galstian I, Wagemaker G, Peter RU. Delayed effects of accidental cutaneous radiation exposure: fifteen years of follow-up after the Chernobyl accident. J Am Acad Dermatol. 2003;49:417–423. doi: 10.1067/s0190-9622(03)02088-7. [DOI] [PubMed] [Google Scholar]
- 3.Field SB, Morgan RL, Morrison R. The response of human skin to irradiation with x-rays or fast neutrons. Int J Radiat Oncol Biol Phys. 1976;1:481–486. doi: 10.1016/0360-3016(76)90014-6. [DOI] [PubMed] [Google Scholar]
- 4.Hopewell JW. The skin: its structure and response to ionizing radiation. Int J Radiat Biol. 1990;57:751–773. doi: 10.1080/09553009014550911. [DOI] [PubMed] [Google Scholar]
- 5.Shope TB. Radiation-induced skin injuries from fluoroscopy. Radiographics. 1996;16:1195–1199. doi: 10.1148/radiographics.16.5.8888398. [DOI] [PubMed] [Google Scholar]
- 6.Vlietstra RE, Wagner LK, Koenig T, Mettler F. Radiation burns as a severe complication of fluoroscopically guided cardiological interventions. J Interv Cardiol. 2004;17:131–142. doi: 10.1111/j.1540-8183.2004.09885.x. [DOI] [PubMed] [Google Scholar]
- 7.Liu Y, Zhou J, Omelchenko MV, Beliaev AS, Venkateswaran A, Stair J, Wu L, Thompson DK, Xu D, Daly MJ. Transcriptome dynamics of Deinococcus radio-durans recovering from ionizing radiation. Proc Natl Acad Sci USA. 2003;100:4191–4196. doi: 10.1073/pnas.0630387100. [DOI] [PMC free article] [PubMed] [Google Scholar]
- 8.Brodsky MH, Weinert BT, Tsang G, Rong YS, McGinnis NM, Golic KG, Rio DC, Rubin GM. Drosophila melanogaster MNK/Chk2 and p53 regulate multiple DNA repair and apoptotic pathways following DNA damage. Mol Cell Biol. 2004;24:1219–1231. doi: 10.1128/MCB.24.3.1219-1231.2004. [DOI] [PMC free article] [PubMed] [Google Scholar]
- 9.Iwakawa M, Noda S, Ohta T, Oohira C, Tanaka H, Tsuji A, Ishikawa A, Imai T. Strain dependent differences in a histological study of CD44 and collagen fibers with an expression analysis of inflammatory response-related genes in irradiated murine lung. J Radiat Res (Tokyo) 2004;45:423–433. doi: 10.1269/jrr.45.423. [DOI] [PubMed] [Google Scholar]
- 10.Sugihara T, Magae J, Wadhwa R, Kaul SC, Kawakami Y, Matsumoto T, Tanaka K. Dose and dose-rate effects of low-dose ionizing radiation on activation of Trp53 in immortalized murine cells. Radiat Res. 2004;162:296–307. doi: 10.1667/rr3223. [DOI] [PubMed] [Google Scholar]
- 11.Voehringer DW, Hirschberg DL, Xiao J, Lu Q, Roederer M, Lock CB, Herzenberg LA, Steinman L, Herzenberg LA. Gene microarray identification of redox and mitochondrial elements that control resistance or sensitivity to apoptosis. Proc Natl Acad Sci USA. 2000;97:2680–2685. doi: 10.1073/pnas.97.6.2680. [DOI] [PMC free article] [PubMed] [Google Scholar]
- 12.Amundson SA, Bittner M, Chen Y, Trent J, Meltzer P, Fornace AJ., Jr Fluorescent cDNA microarray hybridization reveals complexity and heterogeneity of cellular genotoxic stress responses. Oncogene. 1999;18:3666–3672. doi: 10.1038/sj.onc.1202676. [DOI] [PubMed] [Google Scholar]
- 13.Amundson SA, Bittner M, Meltzer P, Trent J, Fornace AJ., Jr Induction of gene expression as a monitor of exposure to ionizing radiation. Radiat Res. 2001;156:657–661. doi: 10.1667/0033-7587(2001)156[0657:iogeaa]2.0.co;2. [DOI] [PubMed] [Google Scholar]
- 14.Amundson SA, Lee RA, Koch-Paiz CA, Bittner ML, Meltzer P, Trent JM, Fornace AJ., Jr Differential responses of stress genes to low dose-rate gamma irradiation. Mol Cancer Res. 2003;1:445–452. [PubMed] [Google Scholar]
- 15.Burns TF, El-Deiry WS. Microarray analysis of p53 target gene expression patterns in the spleen and thymus in response to ionizing radiation. Cancer Biol Ther. 2003;2:431–443. doi: 10.4161/cbt.2.4.478. [DOI] [PubMed] [Google Scholar]
- 16.Chen X, Shen B, Xia L, Khaletzkiy A, Chu D, Wong JY, Li JJ. Activation of nuclear factor kappaB in radioresistance of TP53-inactive human keratinocytes. Cancer Res. 2002;62:1213–1221. [PubMed] [Google Scholar]
- 17.Snyder AR, Morgan WF. Gene expression profiling after irradiation: clues to understanding acute and persistent responses? Cancer Metastasis Rev. 2004;23:259–268. doi: 10.1023/B:CANC.0000031765.17886.fa. [DOI] [PubMed] [Google Scholar]
- 18.Sreekumar A, Nyati MK, Varambally S, Barrette TR, Ghosh D, Lawrence TS, Chinnaiyan AM. Profiling of cancer cells using protein microarrays: discovery of novel radiation-regulated proteins. Cancer Res. 2001;61:7585–7593. [PubMed] [Google Scholar]
- 19.Xia L, Paik A, Li JJ. p53 activation in chronic radiation-treated breast cancer cells: regulation of MDM2/p14ARF. Cancer Res. 2004;64:221–228. doi: 10.1158/0008-5472.can-03-0969. [DOI] [PubMed] [Google Scholar]
- 20.Park WY, Hwang CI, Im CN, Kang MJ, Woo JH, Kim JH, Kim YS, Kim JH, Kim H, Seo JS. Identification of radiation-specific responses from gene expression profile. Oncogene. 2002;21:8521–8528. doi: 10.1038/sj.onc.1205977. [DOI] [PubMed] [Google Scholar]
- 21.Mori M, Benotmane MA, Vanhove D, van Hummelen P, Hooghe-Peters EL, Desaintes C. Effect of ionizing radiation on gene expression in CD4+ T lymphocytes and in Jurkat cells: unraveling novel pathways in radiation response. Cell Mol Life Sci. 2004;61:1955–1964. doi: 10.1007/s00018-004-4147-3. [DOI] [PMC free article] [PubMed] [Google Scholar]
- 22.Suzuki K, Mori I, Nakayama Y, Miyakoda M, Kodama S, Watanabe M. Radiation-induced senescence-like growth arrest requires TP53 function but not telomere shortening. Radiat Res. 2001;155:248–253. doi: 10.1667/0033-7587(2001)155[0248:rislga]2.0.co;2. [DOI] [PubMed] [Google Scholar]
- 23.Ding LH, Shingyoji M, Chen F, Hwang JJ, Burma S, Lee C, Cheng JF, Chen DJ. Gene expression profiles of normal human fibroblasts after exposure to ionizing radiation: a comparative study of low and high doses. Radiat Res. 2005;164:17–26. doi: 10.1667/rr3354. [DOI] [PubMed] [Google Scholar]
- 24.Kis E, Szatmari T, Keszei M, Farkas R, Esik O, Lumniczky K, Falus A, Safrany G. Microarray analysis of radiation response genes in primary human fibroblasts. Int J Radiat Oncol Biol Phys. 2006;66:1506–1514. doi: 10.1016/j.ijrobp.2006.08.004. [DOI] [PubMed] [Google Scholar]
- 25.Franco N, Lamartine J, Frouin V, Le Minter P, Petat C, Leplat JJ, Libert F, Gidrol X, Martin MT. Low-dose exposure to gamma rays induces specific gene regulations in normal human keratinocytes. Radiat Res. 2005;163:623–635. doi: 10.1667/rr3391. [DOI] [PubMed] [Google Scholar]
- 26.Koike M, Shiomi T, Koike A. Identification of skin injury-related genes induced by ionizing radiation in human keratinocytes using cDNA microarray. J Radiat Res (Tokyo) 2005;46:173–184. doi: 10.1269/jrr.46.173. [DOI] [PubMed] [Google Scholar]
- 27.Lamartine J, Franco N, Le Minter P, Soularue P, Alibert O, Leplat JJ, Gidrol X, Waksman G, Martin MT. Activation of an energy providing response in human keratinocytes after gamma irradiation. J Cell Biochem. 2005;95:620–631. doi: 10.1002/jcb.20394. [DOI] [PubMed] [Google Scholar]
- 28.Warters RL, Adamson PJ, Pond CD, Leachman SA. Melanoma cells express elevated levels of phosphorylated histone H2AX foci. J Invest Dermatol. 2005;124:807–817. doi: 10.1111/j.0022-202X.2005.23674.x. [DOI] [PubMed] [Google Scholar]
- 29.Dickson MA, Hahn WC, Ino Y, Ronfard V, Wu JY, Weinberg RA, Louis DN, Li FP, Rheinwald JG. Human keratinocytes that express hTERT and also bypass a p16(INK4a)-enforced mechanism that limits life span become immortal yet retain normal growth and differentiation characteristics. Mol Cell Biol. 2000;20:1436–1447. doi: 10.1128/mcb.20.4.1436-1447.2000. [DOI] [PMC free article] [PubMed] [Google Scholar]
- 30.Tusher VG, Tibshirani R, Chu G. Significance analysis of microarrays applied to the ionizing radiation response. Proc Natl Acad Sci USA. 2001;98:5116–5121. doi: 10.1073/pnas.091062498. [DOI] [PMC free article] [PubMed] [Google Scholar]
- 31.Pavlidis P, Noble WS. Analysis of strain and regional variation in gene expression in mouse brain. Genome Biol. 2001;2:RESEARCH0042 . doi: 10.1186/gb-2001-2-10-research0042. [DOI] [PMC free article] [PubMed] [Google Scholar]
- 32.Breitling R, Armengaud P, Amtmann A, Herzyk P. Rank products: a simple, yet powerful, new method to detect differentially regulated genes in replicated microarray experiments. FEBS Lett. 2004;573:83–92. doi: 10.1016/j.febslet.2004.07.055. [DOI] [PubMed] [Google Scholar]
- 33.Subramanian A, Tamayo P, Mootha VK, Mukherjee S, Ebert BL, Gillette MA, Paulovich A, Pomeroy SL, Golub TR, Mesirov JP. Gene set enrichment analysis: a knowledge-based approach for interpreting genome-wide expression profiles. Proc Natl Acad Sci USA. 2005;102:15545–15550. doi: 10.1073/pnas.0506580102. [DOI] [PMC free article] [PubMed] [Google Scholar]
- 34.Hosack DA, Dennis G, Jr, Sherman BT, Lane HC, Lempicki RA. Identifying biological themes within lists of genes with EASE. Genome Biol. 2003;4:R70 . doi: 10.1186/gb-2003-4-10-r70. [DOI] [PMC free article] [PubMed] [Google Scholar]
- 35.Moos PJ, Edes K, Mullally JE, Fitzpatrick FA. Curcumin impairs tumor suppressor p53 function in colon cancer cells. Carcinogenesis. 2004;25:1611–1617. doi: 10.1093/carcin/bgh163. [DOI] [PubMed] [Google Scholar]
- 36.Yang DT, Holden JA, Florell SR. CD117, CK20, TTF-1, and DNA topoisomerase II-alpha antigen expression in small cell tumors. J Cutan Pathol. 2004;31:254–261. doi: 10.1111/j.0303-6987.2003.00175.x. [DOI] [PubMed] [Google Scholar]
- 37.Candi E, Schmidt R, Melino G. The cornified envelope: a model of cell death in the skin. Nat Rev Mol Cell Biol. 2005;6:328–340. doi: 10.1038/nrm1619. [DOI] [PubMed] [Google Scholar]
- 38.Eckert RL, Crish JF, Efimova T, Dashti SR, Deucher A, Bone F, Adhikary G, Huang G, Gopalakrishnan R, Balasubramanian S. Regulation of involucrin gene expression. J Invest Dermatol. 2004;123:13–22. doi: 10.1111/j.0022-202X.2004.22723.x. [DOI] [PubMed] [Google Scholar]
- 39.Gunduz K, Demireli P, Vatansever S, Inanir I. Examination of bcl-2 and p53 expressions and apoptotic index by TUNEL method in psoriasis. J Cutan Pathol. 2006;33:788–792. doi: 10.1111/j.1600-0560.2006.00564.x. [DOI] [PubMed] [Google Scholar]
- 40.Turesson I, Bernefors R, Book M, Flogegard M, Hermansson I, Johansson KA, Lindh A, Sigurdardottir S, Thunberg U, Nyman J. Normal tissue response to low doses of radiotherapy assessed by molecular markers—a study of skin in patients treated for prostate cancer. Acta Oncol. 2001;40:941–951. doi: 10.1080/02841860152708224. [DOI] [PubMed] [Google Scholar]
- 41.Ponten F, Lindman H, Bostrom A, Berne B, Bergh J. Induction of p53 expression in skin by radiotherapy and UV radiation: a randomized study. J Natl Cancer Inst. 2001;93:128–133. doi: 10.1093/jnci/93.2.128. [DOI] [PubMed] [Google Scholar]
- 42.Smith ML, Chen IT, Zhan Q, Bae I, Chen CY, Gilmer TM, Kastan MB, O’Connor PM, Fornace AJ., Jr Interaction of the p53-regulated protein Gadd45 with proliferating cell nuclear antigen. Science. 1994;266:1376–1380. doi: 10.1126/science.7973727. [DOI] [PubMed] [Google Scholar]
- 43.Hollander MC, Sheikh MS, Bulavin DV, Lundgren K, Augeri-Henmueller L, Shehee R, Molinaro TA, Kim KE, Tolosa E, Fornace AJ., Jr Genomic instability in Gadd45a-deficient mice. Nat Genet. 1999;23:176–184. doi: 10.1038/13802. [DOI] [PubMed] [Google Scholar]
- 44.Inga A, Storici F, Darden TA, Resnick MA. Differential transactivation by the p53 transcription factor is highly dependent on p53 level and promoter target sequence. Mol Cell Biol. 2002;22:8612–8625. doi: 10.1128/MCB.22.24.8612-8625.2002. [DOI] [PMC free article] [PubMed] [Google Scholar]
- 45.Islaih M, Li B, Kadura IA, Reid-Hubbard JL, Deahl JT, Altizer JL, Watson DE, Newton RK. Comparison of gene expression changes induced in mouse and human cells treated with direct-acting mutagens. Environ Mol Mutagen. 2004;44:401–419. doi: 10.1002/em.20065. [DOI] [PubMed] [Google Scholar]
- 46.Koike M, Ninomiya Y, Koike A. Characterization of Ninjurin and TSC22 induction after X-irradiation of normal human skin cells. J Dermatol. 2008;35:6–17. doi: 10.1111/j.1346-8138.2007.00403.x. [DOI] [PubMed] [Google Scholar]
- 47.Hall EJ. Radiobiology for the Radiologist. 5. Lippincott Williams & Wilkins; Philadelphia: 2000. [Google Scholar]
- 48.Mahesh M. Fluoroscopy: patient radiation exposure issues. Radiographics. 2001;21:1033–1045. doi: 10.1148/radiographics.21.4.g01jl271033. [DOI] [PubMed] [Google Scholar]
- 49.Amundson SA, Do KT, Vinikoor LC, Lee RA, Koch-Paiz CA, Ahn J, Reimers M, Chen Y, Scudiero DA, Fornace AJ., Jr Integrating global gene expression and radiation survival parameters across the 60 cell lines of the National Cancer Institute Anticancer Drug Screen. Cancer Res. 2008;68:415–424. doi: 10.1158/0008-5472.CAN-07-2120. [DOI] [PubMed] [Google Scholar]
- 50.Zhou T, Chou JW, Simpson DA, Zhou Y, Mullen TE, Medeiros M, Bushel PR, Paules RS, Yang X, Kaufmann WK. Profiles of global gene expression in ionizing-radiation-damaged human diploid fibroblasts reveal synchroni- zation behind the G1 checkpoint. in a G0-like state of quiescence. Environ Health Perspect. 2006;114:553–559. doi: 10.1289/ehp.8026. [DOI] [PMC free article] [PubMed] [Google Scholar]
- 51.Rodningen OK, Overgaard J, Alsner J, Hastie T, Borresen-Dale AL. Microarray analysis of the transcriptional response to single or multiple doses of ionizing radiation in human subcutaneous fibroblasts. Radiother Oncol. 2005;77:231–240. doi: 10.1016/j.radonc.2005.09.020. [DOI] [PubMed] [Google Scholar]
- 52.Seo EY, Namkung JH, Lee KM, Lee WH, Im M, Kee SH, Park GT, Yang JM, Seo YJ, Lee JH. Analysis of calcium-inducible genes in keratinocytes using suppression subtractive hybridization and cDNA microarray. Genomics. 2005;86:528–538. doi: 10.1016/j.ygeno.2005.06.013. [DOI] [PubMed] [Google Scholar]
- 53.Oh DH, Yeh K. Differentiating human keratinocytes are deficient in p53 but retain global nucleotide excision repair following ultraviolet radiation. DNA Repair (Amst) 2005;4:1149–1159. doi: 10.1016/j.dnarep.2005.06.004. [DOI] [PubMed] [Google Scholar]
- 54.Su MJ, Bikle DD, Mancianti ML, Pillai S. 1,25-Dihydroxyvitamin D3 potentiates the keratinocyte response to calcium. J Biol Chem. 1994;269:14723–14729. [PubMed] [Google Scholar]
- 55.Micallef L, Belaubre F, Pinon A, Jayat-Vignoles C, Delage C, Charveron M, Simon A. Effects of extracellular calcium on the growth-differentiation switch in immortalized keratinocyte HaCaT cells compared with normal human keratinocytes. Exp Dermatol. 2009;18:143–151. doi: 10.1111/j.1600-0625.2008.00775.x. [DOI] [PubMed] [Google Scholar]
- 56.Leisenring W, Friedman DL, Flowers ME, Schwartz JL, Deeg HJ. Nonmelanoma skin and mucosal cancers after hematopoietic cell transplantation. J Clin Oncol. 2006;24:1119–1126. doi: 10.1200/JCO.2005.02.7052. [DOI] [PubMed] [Google Scholar]
- 57.Pond CD, Leachman SA, Warters RL. Accumulation, activation and interindividual variation of the epidermal TP53 protein in response to ionizing radiation in organ cultured human skin. Radiat Res. 2004;161:739–745. doi: 10.1667/rr3156. [DOI] [PubMed] [Google Scholar]
- 58.Goldberg Z, Rocke DM, Schwietert C, Berglund SR, Santana A, Jones A, Lehmann J, Stern R, Lu R, Hartmann Siantar C. Human in vivo dose-response to controlled, low-dose low linear energy transfer ionizing radiation exposure. Clin Cancer Res. 2006;12:3723–3729. doi: 10.1158/1078-0432.CCR-05-2625. [DOI] [PubMed] [Google Scholar]
- 59.Berglund SR, Rocke DM, Dai J, Schwietert CW, Santana A, Stern RL, Lehmann J, Hartmann Siantar CL, Goldberg Z. Transient genome-wide transcriptional response to low-dose ionizing radiation in vivo in humans. Int J Radiat Oncol Biol Phys. 2008;70:229–234. doi: 10.1016/j.ijrobp.2007.09.026. [DOI] [PMC free article] [PubMed] [Google Scholar]
- 60.Suzuki K, Kodama S, Watanabe M. Extremely low-dose ionizing radiation causes activation of mitogen-activated protein kinase pathway and enhances proliferation of normal human diploid cells. Cancer Res. 2001;61:5396–5401. [PubMed] [Google Scholar]
- 61.Guipaud O, Holler V, Buard V, Tarlet G, Royer N, Vinh J, Benderitter M. Time-course analysis of mouse serum proteome changes following exposure of the skin to ionizing radiation. Proteomics. 2007;7:3992–4002. doi: 10.1002/pmic.200601032. [DOI] [PubMed] [Google Scholar]
Associated Data
This section collects any data citations, data availability statements, or supplementary materials included in this article.