

Abstract
We present three-pulse vibrational echo measurements of azide ion bound to the active site Zn of human carbonic anhydrase II (HCA II) and of two separate active-site mutants Thr199 → Ala (T199A) and Leu198 → Phe (L198F). Because structural motions of the protein active site influence the frequency of bound ligands, the differences in the time scales of the frequency-frequency correlation functions (FFCFs) obtained from global fits to each set of data allow us to make inferences about the time scales of the active site dynamics of HCA II. Surprisingly, the deletion of a potential electrostatic interaction in T199A results in very little change in the FFCF, but the insertion of the bulky phenylalanine ring in L198F causes much faster dynamics. We conclude that the fast, sub-picosecond time scale in the correlation function is attributable to hydrogen bond dynamics, and the slow, apparently static contribution is due to the conformational flexibility of Zn-bound azide in the active site.
INTRODUCTION
The role of protein dynamics on femtosecond to picosecond time scales in enzyme-catalyzed reactions is a hotly debated topic of much current interest in enzymology. Both theoretical1-14 and experimental15-22 studies of the kinetics and kinetic isotope effects on enzyme-catalyzed reactions have debated the importance of motions at femtosecond to picosecond time scales. Because of the difficulty associated with characterizing protein structural fluctuations at the active site, relatively little is known about the motions of enzymes at this time scale and the molecular interactions that determine the amplitudes and frequencies of these motions. In fact, understanding the relationship between the dynamics that can be observed using femtosecond spectroscopy and the molecular motions in the active site is a major barrier to resolving the conflict over the role of protein dynamics in enzyme-catalyzed reactions.
Several groups have reported studies of protein dynamics using time-resolved infrared echo and 2D IR spectroscopies to measure the frequency-frequency time correlation function (FFCF) for a protein-bound chromophore.23-37 Qualitatively, the measured correlation functions in most of these studies result in a similar three component pattern: a subpicosecond component, sometimes in the motionally narrowed limit, an intermediate time scale component, typically from a few picoseconds to a few tens of picoseconds, and a static component, reflecting that portion of the frequency distribution resulting from all the protein motions that occur on time scales longer than the measurement window of the experiment. One exception to this pattern is our recent report37 in which the FFCF completely decays within the first few picoseconds with no static component for a complex of the enzyme formate dehydrogenase, NAD+, and a transition-state-analog. This unusual result was interpreted as arising from the close similarity between the complex studied and the transition-state structure of the catalyzed reaction. Because the transition-state structure is expected to be a deep potential minimum in the bound degrees of freedom, it follows that it will be rigid and sample a narrow conformational distribution.
In studies of protein dynamics using nonlinear infrared spectroscopy, developing a molecular interpretation of the experimentally measured correlation function poses a substantial experimental challenge. If a crystal structure for the chromophore-bound protein is known, then protein-ligand interactions can often be inferred from the structure. This approach provides the basic framework within which most studies have been interpreted. This method relies on interactions that can readily be deduced based on the structure alone. When examining the dynamics of the system using non-linear vibrational spectroscopy, even if the important interactions can be identified, it remains difficult to assign specific components of the decay of the correlation function to particular molecular interactions or motions of the protein. One solution to this kind of problem is to make site-directed mutations of the protein that delete specific interactions and to determine the consequences of those changes for the structure, dynamics, and function of the protein. In the context of protein dynamics, selective mutations of active-site residues that have specific interactions with the protein-bound chromophore could perturb the dynamics as measured by the correlation function of the vibrational frequency fluctuations. A study of several mutants should be able to identify those residues that play the most significant roles in determining the measured dynamics, thus providing a molecular picture of the protein motions and how they are probed by the protein-bound chromophore. Human carbonic anhydrase II was chosen for the present study because it is a small, well-studied enzyme. Because we do not anticipate that the dynamics we observe in this enzyme are directly related to function, the mutants we have studied focus on the residues that are believed to interact most strongly with the zinc-bound azide in an effort to give a molecular interpretation to the measured correlation function.
Carbonic anhydrases are a group of zinc enzymes that catalyze the hydration of CO2 to bicarbonate and are involved in a variety of physiological processes. Human carbonic anhydrase II (HCA II) is found in red blood cell and is the most efficient of this group.38,39 Human carbonic anhydrase III (HCA III), however, is the least efficient isozyme and has a maximal turnover rate that is 1000-fold smaller than HCA II even though there is a 60% amino-acid identity and a high degree of sequence and structural homology between the two isozymes (root mean squared difference of 0.92Å in backbone atoms).40-42
Figure 1 shows the crystal structure of azide-bound HCA II indicating the important residues that interact with the zinc-bound inhibitor (PDB code 1RAY).43 In addition to ligation to the zinc, which blue shifts the center frequency of the antisymmetric stretch of azide by ∼50 cm-1, the most notable enzyme-inhibitor interaction is the hydrogen bond from the terminal nitrogen of the azide to the amide proton of the backbone of Thr199. In the free enzyme, the side chain of the catalytically important residue Thr199, invariant in all mammalian carbonic anhydrases, is a hydrogen bond acceptor for the zinc-bound hydroxide involved in the hydration reaction, and a hydrogen bond donor to the carboxylate of Glu106.44 Replacing Thr199 with Ala causes a 100-fold decrease in the activity of HCA II44 and a 4-fold decrease in the activity of HCA III.45 Furthermore, Chen et al. have suggested that the interaction between Thr199 and the residue at position 198 (Leu in HCA II and Phe in HCA III) is partly responsible for the large differences in activity between HCA II and HCA III.45 In fact, the most significant change in conformation from wt-HCAII to the T199A mutant is in the side chain of Leu198 (PDB # 1RAY and 1CAL, respectively).
Figure 1.
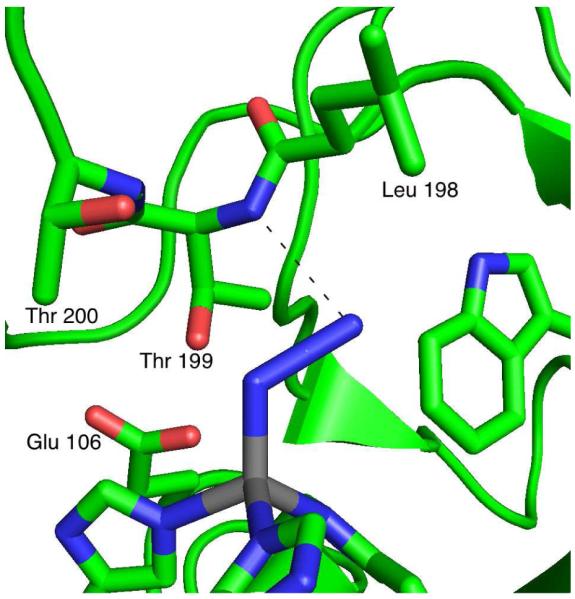
Active site structure of azide-bound human carbonic anhydrase II (HCA II) (PDB #1RAY).43 Azide binds to the active-site zinc in grey. The dashed line indicates the hydrogen bond between azide and the amide proton of Thr199.
The present work reports a study of the active site interactions that determine the frequency fluctuations of zinc-bound azide at the active site of HCA II. To examine these interactions we studied two active-site mutants: Thr199→Ala (T199A) and Leu198→Phe (L198F). The first of these mutations explores the interaction between the Thr side chain and the zinc-bound azide. Previous studies have suggested that the electrostatic interaction with the Thr hydroxyl group makes an important contribution to the frequency fluctuations of azide bound to bovine carbonic anhydrase II.36,46 The second mutant explores the influence of the residue at position 198. Although it does not play a direct role in catalysis, this residue influences the reaction through its interaction with Thr199. By comparing the frequency fluctuations of the enzyme-bound azide in the wild type and mutant enzymes we are able to identify the residues that interact strongly with a zinc-bound ligand.
EXPERIMENT
Infrared echo spectroscopy measures the statistics of the time-dependent frequency fluctuations of an ensemble of oscillators. When an oscillator is bound in the active site of a protein, structural dynamics of the active-site environment will perturb the frequency of the oscillator. Vibrational echo spectroscopy characterizes the frequency fluctuations caused by the motions of the protein’s active site. The two-point frequency-frequency time correlation function (FFCF) quantifies the measured dynamics.
The experimental apparatus is similar to that used in previous experiments.37,47,48 A commercial 1 KHz Ti:sapphire laser produces 1 mJ, 100-fs duration pulses centered at 800 nm. An optical parametric amplifier and difference frequency generator convert the 800 nm light into the mid IR. For our measurements, the center frequency of the pulses (full width at half maximum of 180 cm-1 and approximately 80 fs pulse duration) is at 2065 cm-1, between the antisymmetric stretch frequencies of bound and unbound azide.
Beamsplitters separate the infrared beam into three pulses of approximately equal intensity. Computer-controlled translation stages determine the path length of each beam and thereby the time delays between the pulses. The pulses approach the sample in a box phase-matching geometry. A 90° off-axis, parabolic mirror focuses the pulses to a diameter of ∼ 90 μm at the sample. An iris isolates the resulting signal electric field in the -k1 + k2 + k3 direction. The signal focuses into an InSb detector. A gated integrator and a lock-in amplifier referenced to an optical chopper with a chopping frequency of 500 Hz in the path of the second beam isolate the component of the detector response corresponding to the third-order echo signal. We minimize higher order contributions to the signal by decreasing the excitation energy of the incident pulses at the sample using neutral density filters. The power dependence of the signal verifies that only the third-order response contributes to our data.
There are two time delays in an integrated photon echo measurement. The delay between the first two pulses is the evolution time denoted τ. The delay between the second and third pulses is the waiting time denoted T. We collect the integrated intensity of the echo signal as a function of τ for fixed values of T. These give the characteristic echo response in which the maximum of the signal is shifted from τ = 0 fs by an amount known as the peak shift that can be related to the amplitude of the FFCF evaluated at the waiting time T. The FFCF is determined by globally fitting a set of echo responses measured at various waiting times to the model correlation function given by Equation 1, using the nonlinear response function formalism developed by Mukamel49 and prescribed in detail by Sung and Silbey.50 In this model correlation function, the Δ’s reflect the amplitudes of frequency fluctuations (root-mean squared deviation) at various time scales and the τ’s are the time scales. The Δ0 term represents the frequency fluctuations at all time scales longer than the experimental measurement time, approximately 10 ps. We use as few terms in the correlation function as necessary to get an acceptable fit to the data. In addition, we calculate the infrared absorption spectrum using the model correlation function with the parameters from the fit to confirm agreement with the experimental spectrum.
| (Eq. 1) |
ENZYME PREPARATION
The bacterial expression vector containing the wild type HCA II coding region was a generous gift of D. N. Silverman at the University of Florida. We performed site-directed mutagenesis of the cDNA of HCA II using the Qiagen QuikChange II kit. The mutant oligonucleotides for HCA II-T199A (T199A) and HCA II-L198F (L198F) were purchased from Integrated DNA Technologies. The site mutations in the resulting plasmids were confirmed by sequencing the coding region for HCA II at the University of Iowa DNA Facility.
The plasmids were transformed into the expression host Escherichia coli, strain BL21(DE3) for wt-HCA II and strain BL21(DE3)pLysS for both mutants. The transformed E. coli expression systems were grown by incubating at 37°C LB media in the presence of 100 mg/L of ampicillin. When the A600nm reached an optical density of 0.8, the expression of the desired enzyme was induced with isopropylthiogalactoside (IPTG) and allowed to incubate for an additional 4 hours. Cells were harvested by centrifugation and frozen at -20°C overnight. After the cells were broken open using lysozyme, centrifugation was used to remove the cell debris from the lysate that contained the wild-type or mutant HCA II.
The enzymes were purified by affinity chromatography with p-(aminomethyl) benzene sulfonamide (pAMBS) agarose beads obtains from Sigma. Excess salts were removed via dialysis, and the enzymes were lyophilized. The specific activity was measured via the hydrolysis of 4-nitrophenyl acetate assay.51
The enzyme-azide samples were prepared in D2O in a 100mM Tris buffer at pD 7.0. Sodium azide was added so that the final concentrations were 4 mM enzyme, 2 mM azide, and 100 mM Tris at pD 7.0. The absorption peak attributed to the antisymmetric stretch of azide shifts from 2043 cm-1 in D2O to 2094 cm-1 at the active site of the enzyme.
RESULTS
Figure 2 shows the FTIR spectra of azide bound at the active sites of the wild-type and mutant enzymes. The symbols are the experimental data for HCA II, T199A, and L198F. The solid lines are calculated spectra using the results of the global fit to the vibrational echo data. The data have been background subtracted to remove the large solvent absorption rising on the high frequency side of the azide transition and normalized for ease of comparison. The spectra for HCA II and the T199A mutant are similar with peak positions and full-widths at half maximum (FWHM) of 2094 cm-1 and 20 cm-1 for HCA II and 2093 cm-1 and 19 cm-1 for T199A. In contrast, the spectrum for L198F peaks at 2088 cm-1 and has a FWHM of 22 cm-1.
Figure 2.
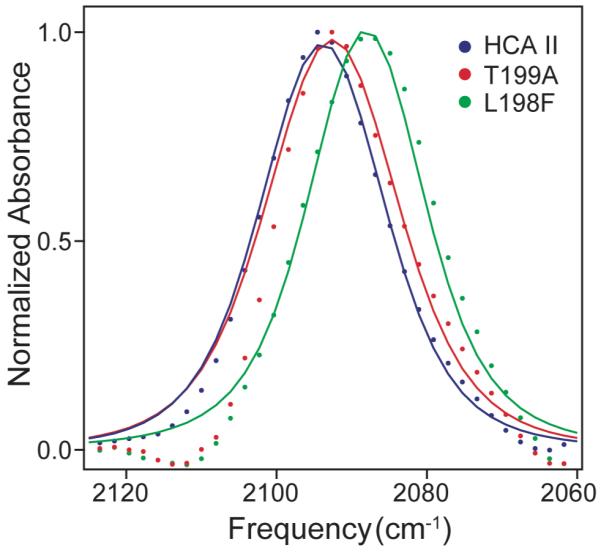
Infrared absorption spectra of azide bound to wild-type human Carbonic anhydrase II (HCA II) in blue, the Thr199→Ala mutant of HCA II (T199A) in red, and the Leu198→Phe mutant of HCA II (L198F) in green. The points are experimental data and the solid lines are calculated spectra using the fit parameters obtained from the global fit to the vibrational echo data for each enzyme.
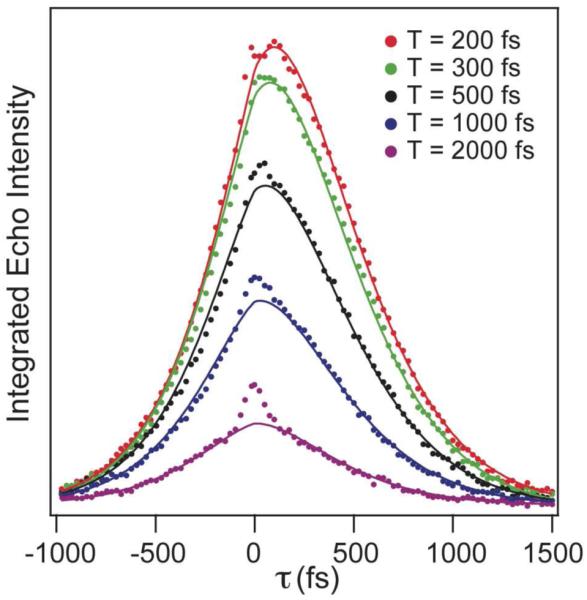
Figure 3 shows typical vibrational echo data for the wt-HCA II with azide bound at the active site. The data are plotted as integrated echo intensity as a function of the evolution time, τ for fixed values of the waiting time, T. Using a global fitting routine, we simultaneously fit all the T traces assuming a model two-point FFCF. We achieved the best fit to the wt-HCA II data with a single exponential decay and static component (Equation 2). In Figure 3, the dots are the measured data, and the solid lines show the calculated echo using the parameters listed in Table 1. The deviations at τ = 0 fs result from the response of the solvent, which can vary in amplitude considerably between experiments. We mask the region 200 fs on either side of zero during the fit so it does not influence the resulting fit parameters.
| (Eq. 2) |
Figure 3.
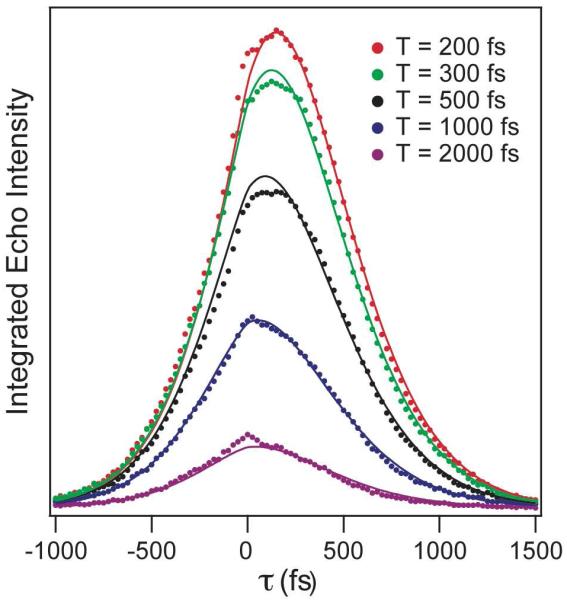
Representative integrated vibrational echo traces for fixed values of the waiting time, T, as a function of the evolution time, τ, for wild-type HCAII. The points are experimental data, and the lines are from the global fit to the data using a model correlation function.
Table 1.
Correlation function parameters for Equations 2 and 3 from global fits to the vibrational echo data for human carbonic anhydrase II (HAC II) and the mutants Thr199 → Ala (T199A) and Leu198 → Phe (L198F)
| Protein | Δ0 (ps-1) | Δ1 (ps-1) | τ1 (ps) | Δ2 (ps-1) | τ2 (ps) |
|---|---|---|---|---|---|
| HCA II | 0.86 | 2.02 | 0.45 | - | - |
| T199A | 0.88 | 1.86 | 0.40 | - | - |
| L198F | - | 1.96 | 0.25 | 1.01 | 2.5 |
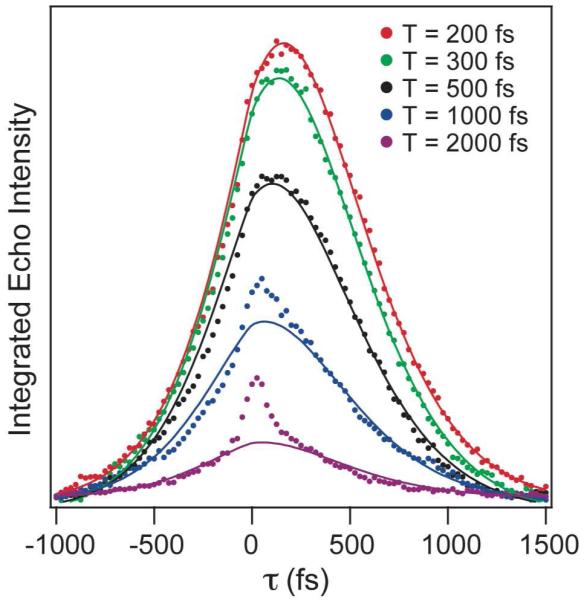
Figures 4 and 5 show typical three-pulse vibrational echo responses for azide bound at the active site of T199A and L198F, respectively. For T199A, we also use Equation 2 to get the best fit to the data. For L198F, we use a different form for the correlation function including two exponential decays and no static component as in Equation 3. This form of the correlation function differs from that for the other enzymes and is required because we were unable to get an acceptable fit to the data using a single exponential with an offset as in the other complexes. Table 1 summarizes the correlation function parameters resulting from the fits to the echo data.
| (Eq. 3) |
Figure 4.
Representative integrated vibrational echo traces for fixed values of the waiting time, T, as a function of the evolution time, τ, for the Thr199→Ala mutant of HCAII (T199A). The points are experimental data, and the lines are from the global fit to the data using a model correlation function.
Figure 5.
Representative integrated vibrational echo traces for fixed values of the waiting time, T, as a function of the evolution time, τ, for the Leu198→Phe mutant of HCAII (L198F). The points are experimental data, and the lines are from the global fit to the data using a model correlation function.
DISCUSSION
There are many motions in proteins occurring on vast array of time scales that can perturb the frequency of a chromophore in the active site. Hydrogen bonds fluctuate on short time scales of hundreds of femtoseconds to picoseconds.52-57 Side chains and small segments of the backbone move on picosecond to nanosecond time scales with the motions in unstructured loop regions typically faster than the collective breathing of structured α-helices or β-sheets. On longer time scales, tens of nanoseconds to milliseconds, the structured regions can move as a unit with respect to one another, opening and closing channels in the protein.58-60 Collective motions that involve many atoms will occur on slower time scales than local fluctuations of small groups of atoms.
Protein motions cause fluctuations in the vibrational frequency of the chromophore because the surrounding environment influences that frequency. If snapshots of the protein in motion were taken, each chromophore would reside in a slightly different environment and have a slightly different frequency, resulting in a heterogeneous distribution of frequencies. As a result of the protein motions at all time scales, the chromophore samples all available environments resulting in the loss of transition frequency correlations. If we could take data out far enough in time, we would observe the complete decay of the FFCF as the chromophore samples all possible frequencies in its distribution. We are limited by the vibrational lifetime, however, to a time widow of a few picoseconds. Therefore, any motions that occur on longer time scales (tens of picoseconds or more), appear stationary during our measurements. These motions contribute to the distribution of frequencies but are not sampled within the time scale of our measurement, and, thus, appear as a static contribution to the FFCF.
In the study of bovine CA II by Lim et al., they found a correlation function with a fast decay of 0.2 ps and a slow decay of 17 ps with amplitudes of 1.6 ps-1 and 0.95 ps-1, respectively. Our measurement of human CAII is consistent with their results for the bovine enzyme. The sub-picosecond decays are of similar amplitude and time scale for the two enzymes, and our static component corresponds well with their 17 ps decay. The fits to our data are qualitatively indistinguishable with these two sets of parameters. Lim et al. suggest that Thr199, the residue closest to the azide is important for modulating the transition frequency of the zinc-bound ligand, but do not associate specific components of the decay with particular motions of the active-site residues. In general, one cannot uniquely associate protein motions with observed time scales in the FFCF based on a single measurement. Our experiments on the mutants specifically address this problem by looking for perturbations of the FFCF due to the active site mutations.
The wild type HCA II and both mutants exhibit a fast, sub-picosecond decay. We attribute this fast decay to fluctuations of the hydrogen bond between the terminal nitrogen of the azide and the backbone amide proton of the Thr199 residue. A time scale of a few hundred femtoseconds is reasonable for hydrogen bond fluctuations based on other studies of hydrogen bond dynamics,53,55,57,61-66 and both the hydrogen bond and the sub-picosecond decay are conserved in all three species we have studied.
The mutation of the Thr at position 199 to Ala removes the hydroxyl group of the Thr side chain, thereby eliminating both the hydrogen bond to Glu106 and the electrostatic interaction with azide. Both the dynamics and absorption spectrum are identical to those of the wild type. This result suggests that the Thr side chain does not interact strongly with azide and that any interaction between them does not significantly influence the azide transition frequency. As a result, we conclude that the only significant protein-ligand interaction is the hydrogen bond between azide and the amide proton of the Thr199 (marked by a dashed line in Figure 1).
In L198F, the fast time constant in the FFCF is similar to that for the wild-type enzyme, but there is no static component. Instead, we observe an intermediate, 2.5 ps, time scale decay. In the aforementioned case of formate dehydrogenase where a transition state analog complex showed similar dynamics, the unusual absence of a static component was believed to reflect the similarity between the transition-state structure for the catalyzed reaction and the inhibited ternary complex.37 In the case of carbonic anhydrase, however, the more likely explanation is that the zinc-bound azide is only sensitive to the fluctuations of the length of the hydrogen bond between azide and the amide proton of Thr199. Because the fast component of the decay is somewhat faster than for the wild-type enzyme and there is no static component, our results suggest that the hydrogen bond to azide in the L198F mutant is stronger than that for the wild-type enzyme. That is consistent with the 6 cm-1 red shift in the infrared absorption spectrum of azide bound to L198F relative to the wild type enzyme. We propose that although the pheylalanine ring in L198F does not directly affect the hydrogen bond to the azide, it may introduce significant steric hindrance in the active site that favors a shorter distance between the terminal nitrogen of azide and the amide proton at position 199. Nair et al. report a x-ray crystal structure of L198F without azide bound in which the phenyl ring points away from the hydrophobic pocket (PDB #1YDC),67 but the average reported B factor for the ring (20.9 Å2) suggests a high degree of mobility compared to the rest of the active site (average B factor ∼6.1 Å2). Thus, with azide present in the active site, the ring may swing down to lay flat against the azide and fill the hydrophobic pocket as it does in HCA III. Since this residue sits in an unstructured loop, these dynamics are neither reflective of the fluctuations of the rest of the active site nor of the rest of the protein. Instead, the dynamics that determine the FFCF for the zinc-bound azide are most likely very local in nature. The presence of a picosecond decay component indicates that there remains some conformational flexibility, but because of the steric hindrance in the active site, there is little room for structural fluctuations that modulate the hydrogen bond distance significantly on time scales longer than a few picoseconds.
Based on these observations and the known variations in both structure and electrostatics for the mutant and wild type enzymes, we suggest an assignment for the two time scales in the FFCF of the wild type. We attribute the fast decay to local fluctuations of the hydrogen bond between azide and the amide proton of the residue at position 199. The static component arises from the conformational heterogeneity within the hydrophobic pocket of the active site associated with the flexibility in the relative orientation of azide and the position of the unstructured loop that includes residue 199.
CONCLUSION
Using vibrational echo spectroscopy, we infer time scales of protein structural motions from the decay rates in the FFCF. With the T199A mutant, we examine the effect of removing a potential electrostatic interaction, and discover that this change has little, if any, effect on the antisymmetric stretching frequency. The L198F mutation introduces steric hindrance in the hydrophobic pocket flanking the azide without directly affecting the ligand. This mutation leads to a significant change in the observed dynamics indicating that the residue at 198 plays a significant, if indirect, role in modulating the strength of the protein-ligand interactions.
All three enzymes exhibit similar sub-picosecond dynamics attributed to the fast fluctuation of the local hydrogen bond holding the azide to the backbone of the residue at position 199. Both wild type HCA II and T199A show a similar static component in the FFCF due to heterogeneity in the location of the azide relative to the amide proton at position 199. In contrast, L198F shows no significant static component because the phenyl ring constrains the position of the azide thereby reducing the conformational heterogeneity and strengthening the hydrogen bond between azide and the amide proton of Thr199.
ACKNOWLEDGEMENTS
The authors gratefully acknowledge David N. Silverman and Nicolette Case for generously providing the HCAII plasmid and for assistance with the expression and purification protocols. This work was supported by the Roy J. Carver Charitable Trust and NSF CHE-0644410 (CMC), and NIH R01 GM65368 and NSF CHE-0715448 (AK).
Cited References
- (1).Thorpe IF, Brooks CL. J. Am. Chem. Soc. 2005;127:12997. doi: 10.1021/ja053558l. [DOI] [PubMed] [Google Scholar]
- (2).Rod TH, Radkiewicz JL, Brooks CL. Proc. Natl. Acad. Sci. U.S.A. 2003;100:6980. doi: 10.1073/pnas.1230801100. [DOI] [PMC free article] [PubMed] [Google Scholar]
- (3).Hammes-Schiffer S. Acc. Chem. Res. 2006;39:93. doi: 10.1021/ar040199a. [DOI] [PubMed] [Google Scholar]
- (4).Hammes-Schiffer S, Watney JB. Philos. Trans. R. Soc. B-Biol. Sci. 2006;361:1365. doi: 10.1098/rstb.2006.1869. [DOI] [PMC free article] [PubMed] [Google Scholar]
- (5).Antoniou D, Caratzoulas S, Kalyanaraman C, Mincer JS, Schwartz SD. Eur. J. Biochem. 2002;269:3103. doi: 10.1046/j.1432-1033.2002.03021.x. [DOI] [PubMed] [Google Scholar]
- (6).Schwartz SD. Vibrationally enhanced tunneling from the temperature dependence of KIE. In: Kohen A, Limbach HH, editors. Isotope effects in chemistry and biology. Taylor & Francis, CRC Press; Boca Raton, FL: 2006. p. 475. Ch. 18. [Google Scholar]
- (7).Roca M, Moliner V, Tunon I, Hynes JT. J. Am. Chem. Soc. 2006;128:6186. doi: 10.1021/ja058826u. [DOI] [PubMed] [Google Scholar]
- (8).Ruiz-Pernia JJ, Tunon I, Moliner V, Hynes JT, Roca M. J. Am. Chem. Soc. 2008;130:7477. doi: 10.1021/ja801156y. [DOI] [PubMed] [Google Scholar]
- (9).Pang JY, Pu JZ, Gao JL, Truhlar DG, Allemann RK. J. Am. Chem. Soc. 2006;128:8015. doi: 10.1021/ja061585l. [DOI] [PubMed] [Google Scholar]
- (10).Truhlar DG. Variational transition state theory and multidimensional tunneling for simple and complex reacrions in the gas phase, solids, Liquids, and enzymes. In: Kohen A, Limbach HH, editors. Isotope effects in chemistry and biology. Taylor & Francis, CRC Press; Boca Raton, FL: 2005. p. 579. Ch. 22. [Google Scholar]
- (11).Liu HB, Warshel A. J. Phys. Chem. B. 2007;111:7852. doi: 10.1021/jp070938f. [DOI] [PubMed] [Google Scholar]
- (12).Warshel A, Sharma PK, Kato M, Xiang Y, Liu HB, Olsson MHM. Chem. Rev. 2006;106:3210. doi: 10.1021/cr0503106. [DOI] [PubMed] [Google Scholar]
- (13).Henzler-Wildman KA, Thai V, Lei M, Ott M, Wolf-Watz M, Fenn T, Pozharski E, Wilson MA, Petsko GA, Karplus M, Hubner CG, Kern D. Nature. 2007;450:838. doi: 10.1038/nature06410. [DOI] [PubMed] [Google Scholar]
- (14).Henzler-Wildman KA, Lei M, Thai V, Kerns SJ, Karplus M, Kern D. Nature. 2007;450:913. doi: 10.1038/nature06407. [DOI] [PubMed] [Google Scholar]
- (15).Klinman JP. Philos. Trans. R. Soc. B-Biol. Sci. 2006;361:1323. doi: 10.1098/rstb.2006.1870. [DOI] [PMC free article] [PubMed] [Google Scholar]
- (16).Nagel ZD, Klinman JP. Chem. Rev. 2006;106:3095. doi: 10.1021/cr050301x. [DOI] [PubMed] [Google Scholar]
- (17).Klinman JP. Faseb Journal. 2007;21:A645. [Google Scholar]
- (18).Kohen A. Prog. React. Kin. Mech. 2003;28:119. [Google Scholar]
- (19).Kohen A. Kinetic isotope effects as probes for hydrogen tunneling in enzyme catalysis. In: Kohen A, Limbach HH, editors. Isotope effects in chemistry and biology. Taylor & Francis, CRC Press; Boca Raton, FL: 2006. p. 743. Ch. 28. [Google Scholar]
- (20).Wang L, Goodey NM, Benkovic SJ, Kohen A. Philos. Trans. R. Soc. B-Biol. Sci. 2006;361:1307. doi: 10.1098/rstb.2006.1871. [DOI] [PMC free article] [PubMed] [Google Scholar]
- (21).Hay S, Pang JY, Monaghan PJ, Wang X, Evans RM, Sutcliffe MJ, Allemann RK, Scrutton NS. Chemphyschem. 2008;9:1536. doi: 10.1002/cphc.200800291. [DOI] [PubMed] [Google Scholar]
- (22).Sutcliffe MJ, Masgrau L, Roujeinikova A, Johannissen LO, Hothi P, Basran J, Ranaghan KE, Mulholland AJ, Leys D, Scrutton NS. Philos. Trans. R. Soc. B-Biol. Sci. 2006;361:1375. doi: 10.1098/rstb.2006.1878. [DOI] [PMC free article] [PubMed] [Google Scholar]
- (23).Rector KD, Thompson DE, Merchant K, Fayer MD. Chem. Phys. Lett. 2000;316:122. [Google Scholar]
- (24).Fayer MD. Ann. Rev. Phys. Chem. 2001;52:315. doi: 10.1146/annurev.physchem.52.1.315. [DOI] [PubMed] [Google Scholar]
- (25).Merchant KA, Noid WG, Thompson DE, Akiyama R, Loring RF, Fayer MD. J. Phys. Chem. B. 2003;107:4. [Google Scholar]
- (26).Merchant KA, Noid WG, Akiyama R, Finkelstein IJ, Goun A, McClain BL, Loring RF, Fayer MD. J. Am. Chem. Soc. 2003;125:13804. doi: 10.1021/ja035654x. [DOI] [PMC free article] [PubMed] [Google Scholar]
- (27).McClain BL, Finkelstein IJ, Fayer MD. J. Am. Chem. Soc. 2004;126:15702. doi: 10.1021/ja0454790. [DOI] [PMC free article] [PubMed] [Google Scholar]
- (28).Massari AM, Finkelstein IJ, McClain BL, Goj A, Wen X, Bren KL, Loring RF, Fayer MD. J. Am. Chem. Soc. 2005;127:14279. doi: 10.1021/ja053627w. [DOI] [PubMed] [Google Scholar]
- (29).Finkelstein IJ, Goj A, McClain BL, Massari AM, Merchant KA, Loring RF, Fayer MD. J. Phys. Chem. B. 2005;109:16959. doi: 10.1021/jp0517201. [DOI] [PubMed] [Google Scholar]
- (30).Massari AM, Finkelstein IJ, Fayer MD. J. Am. Chem. Soc. 2006;128:3990. doi: 10.1021/ja058745y. [DOI] [PMC free article] [PubMed] [Google Scholar]
- (31).Ishikawa H, Finkelstein IJ, Kim S, Kwak K, Chung JK, Wakasugi K, Massari AM, Fayer MD. Proc. Natl. Acad. Sci. U.S.A. 2007;104:16116. doi: 10.1073/pnas.0707718104. [DOI] [PMC free article] [PubMed] [Google Scholar]
- (32).Ishikawa H, Kim S, Kwak K, Wakasugi K, Fayer MD. Proc. Natl. Acad. Sci. U.S.A. 2007;104:19309. doi: 10.1073/pnas.0709760104. [DOI] [PMC free article] [PubMed] [Google Scholar]
- (33).Finkelstein IJ, Ishikawa H, Kim S, Massari AM, Fayer MD. Proc. Natl. Acad. Sci. U.S.A. 2007;104:2637. doi: 10.1073/pnas.0610027104. [DOI] [PMC free article] [PubMed] [Google Scholar]
- (34).Ishikawa H, Kwak K, Chung JK, Kim S, Fayer MD. Proc. Natl. Acad. Sci. U.S.A. 2008;105:8619. doi: 10.1073/pnas.0803764105. [DOI] [PMC free article] [PubMed] [Google Scholar]
- (35).Fang C, Bauman JD, Das K, Remorino A, Arnold E, Hochstrasser RM. Proc. Natl. Acad. Sci. U.S.A. 2008;105:1472. doi: 10.1073/pnas.0709320104. [DOI] [PMC free article] [PubMed] [Google Scholar]
- (36).Lim MH, Hamm P, Hochstrasser RM. Proc. Natl. Acad. Sci. U.S.A. 1998;95:15315. doi: 10.1073/pnas.95.26.15315. [DOI] [PMC free article] [PubMed] [Google Scholar]
- (37).Bandaria JN, Dutta S, Hill SE, Kohen A, Cheatum CM. J. Am. Chem. Soc. 2008;130:22. doi: 10.1021/ja077599o. [DOI] [PMC free article] [PubMed] [Google Scholar]
- (38).Lindskog S. Pharmacol. Ther. 1997;74:1. doi: 10.1016/s0163-7258(96)00198-2. [DOI] [PubMed] [Google Scholar]
- (39).Sly WS, Hu PY. Annu. Rev. Biochem. 1995;64:375. doi: 10.1146/annurev.bi.64.070195.002111. [DOI] [PubMed] [Google Scholar]
- (40).Duda DM, Tu CK, Fisher SZ, An HQ, Yoshioka C, Govindasamy L, Laipis PJ, Agbandje-McKenna M, Silverman DN, McKenna R. Biochemistry. 2005;44:10046. doi: 10.1021/bi050610h. [DOI] [PubMed] [Google Scholar]
- (41).Duda DM, Yoshioka C, Govindasamy L, An HQ, Tu CK, Silverman DN, McKenna R. Acta Crystallogr. Sect. D-Biol. Crystallogr. 2002;58:849. doi: 10.1107/s0907444902003700. [DOI] [PubMed] [Google Scholar]
- (42).Eriksson AE, Liljas A. Prot. Struct. Func. Gen. 1993;16:29. doi: 10.1002/prot.340160104. [DOI] [PubMed] [Google Scholar]
- (43).Jonsson BM, Hakansson K, Liljas A. FEBS Lett. 1993;322:186. doi: 10.1016/0014-5793(93)81565-h. [DOI] [PubMed] [Google Scholar]
- (44).Liang ZW, Xue YF, Behravan G, Jonsson BH, Lindskog S. Eur. J. Biochem. 1993;211:821. doi: 10.1111/j.1432-1033.1993.tb17614.x. [DOI] [PubMed] [Google Scholar]
- (45).Chen X, Tu CK, Lograsso PV, Laipis PJ, Silverman DN. Biochemistry. 1993;32:7861. doi: 10.1021/bi00082a004. [DOI] [PubMed] [Google Scholar]
- (46).Garcia-Viloca M, Nam K, Alhambra C, Gao JL. J. Phys. Chem. B. 2004;108:13501. [Google Scholar]
- (47).Gundogdu K, Bandaria J, Nydegger M, Rock W, Cheatum CM. J. Chem. Phys. 2007;127:044501. doi: 10.1063/1.2753840. [DOI] [PubMed] [Google Scholar]
- (48).Gundogdu K, Nydegger MW, Bandaria JN, Hill SE, Cheatum CM. J. Chem. Phys. 2006;125:174503. doi: 10.1063/1.2361288. [DOI] [PubMed] [Google Scholar]
- (49).Mukamel S. Principles of Nonlinear Optical Spectroscopy. Oxford University Press; New York: 1995. [Google Scholar]
- (50).Sung JY, Silbey RJ. J. Chem. Phys. 2001;115:9266. [Google Scholar]
- (51).Armstrong JM, Myers DV, Verpoort Ja, Edsall JT. J. Biol. Chem. 1966;241:5137. [PubMed] [Google Scholar]
- (52).Huse N, Bruner BD, Cowan ML, Dreyer J, Nibbering ETJ, Miller RJD, Elsaesser T. Phys. Rev. Lett. 2005;95 doi: 10.1103/PhysRevLett.95.147402. [DOI] [PubMed] [Google Scholar]
- (53).Heyne K, Huse N, Dreyer J, Nibbering ETJ, Elsaesser T, Mukamel S. J. Chem. Phys. 2004;121:902. doi: 10.1063/1.1762873. [DOI] [PubMed] [Google Scholar]
- (54).Heyne K, Huse N, Nibbering ETJ, Elsaesser T. Chem. Phys. Lett. 2003;382:19. doi: 10.1103/PhysRevLett.91.197401. [DOI] [PubMed] [Google Scholar]
- (55).Li SZ, Schmidt JR, Piryatinski A, Lawrence CP, Skinner JL. J. Phys. Chem. B. 2006;110:18933. doi: 10.1021/jp057568k. [DOI] [PubMed] [Google Scholar]
- (56).Lawrence CP, Skinner JL. Chem. Phys. Lett. 2003;369:472. [Google Scholar]
- (57).Lawrence CP, Skinner JL. J. Chem. Phys. 2003;118:264. [Google Scholar]
- (58).Boehr DD, Dyson HJ, Wright PE. Chem. Rev. 2006;106:3055. doi: 10.1021/cr050312q. [DOI] [PubMed] [Google Scholar]
- (59).Frauenfelder H, Sligar SG, Wolynes PG. Science. 1991;254:1598. doi: 10.1126/science.1749933. [DOI] [PubMed] [Google Scholar]
- (60).Kao YT, Saxena C, Wang LJ, Sancar A, Zhong DP. Cell Biochemistry and Biophysics. 2007;48:32. doi: 10.1007/s12013-007-0034-5. [DOI] [PubMed] [Google Scholar]
- (61).Dwyer JR, Dreyer J, Nibbering ETJ, Elsaesser T. Chem. Phys. Lett. 2006;432:146. [Google Scholar]
- (62).Heyne K, Huse N, Nibbering ETJ, Elsaesser T. J. Phys. Cond. Matt. 2003;15:S129. [Google Scholar]
- (63).Asbury JB, Steinel T, Stromberg C, Corcelli SA, Lawrence CP, Skinner JL, Fayer MD. J. Phys. Chem. A. 2004;108:1107. doi: 10.1063/1.1803532. [DOI] [PMC free article] [PubMed] [Google Scholar]
- (64).Fecko CJ, Loparo JJ, Roberts ST, Tokmakoff A. J. Chem. Phys. 2005;122:054506. doi: 10.1063/1.1839179. [DOI] [PubMed] [Google Scholar]
- (65).Fecko CJ, Eaves JD, Loparo JJ, Tokmakoff A, Geissler PL. Science. 2003;301:1698. doi: 10.1126/science.1087251. [DOI] [PubMed] [Google Scholar]
- (66).Kuo CH, Vorobyev DY, Chen JX, Hochstrasser RM. J. Phys. Chem. B. 2007;111:14028. doi: 10.1021/jp076503+. [DOI] [PubMed] [Google Scholar]
- (67).Nair SK, Krebs JF, Christianson DW, Fierke CA. Biochemistry. 1995;34:3981. doi: 10.1021/bi00012a016. [DOI] [PubMed] [Google Scholar]