

Abstract
Although several studies have provided important insights into the general principles of biological networks, the link between network organization and the genome-scale dynamics of the underlying entities (genes, mRNAs, and proteins) and its role in systems behavior remain unclear. Here we show that transcription factor (TF) dynamics and regulatory network organization are tightly linked. By classifying TFs in the yeast regulatory network into three hierarchical layers (top, core, and bottom) and integrating diverse genome-scale datasets, we find that the TFs have static and dynamic properties that are similar within a layer and different across layers. At the protein level, the top-layer TFs are relatively abundant, long-lived, and noisy compared with the core- and bottom-layer TFs. Although variability in expression of top-layer TFs might confer a selective advantage, as this permits at least some members in a clonal cell population to initiate a response to changing conditions, tight regulation of the core- and bottom-layer TFs may minimize noise propagation and ensure fidelity in regulation. We propose that the interplay between network organization and TF dynamics could permit differential utilization of the same underlying network by distinct members of a clonal cell population.
Keywords: dynamics, hierarchy, noise, systems biology, transcription network
Introduction
Transcription factors (TFs), one of the key determinants of gene expression, regulate mRNA synthesis depending on intrinsic and extrinsic signals. The set of all regulatory interactions between TFs and their target genes (TGs) in a cell can be represented as a transcription regulatory network in which nodes represent TFs and TGs, and directed edges represent the regulation of TGs by TFs. This representation provides a powerful framework to uncover the general organizational principles of transcription regulation (Babu et al, 2004; Barabasi and Oltvai, 2004). This has been shown primarily by investigating the topological aspects of these networks, both at the local and global levels of organization (Babu et al, 2004; Barabasi and Oltvai, 2004; Alon, 2007). Experimental (Harbison et al, 2004) and theoretical (Babu et al, 2004; Han et al, 2004) studies investigating condition-specific regulatory and protein interaction networks in yeast have shown that the network re-organizes its topology under different cellular conditions to efficiently respond to changing environments. More recently, several studies have identified the presence of a stratified structure in biological networks (Ravasz et al, 2002; Ma et al, 2004a; Balazsi et al, 2005; Farkas et al, 2006; Yu and Gerstein, 2006; Zhao et al, 2006; Cosentino Lagomarsino et al, 2007; Sales-Pardo et al, 2007; Takemoto and Oosawa, 2007; Freyre-Gonzalez et al, 2008). In particular, studies on both prokaryotic and eukaryotic regulatory networks have discovered the existence of hierarchical network structures, and have proposed models for their evolution (Ma et al, 2004a; Balazsi et al, 2005; Farkas et al, 2006; Yu and Gerstein, 2006; Cosentino Lagomarsino et al, 2007). The hierarchical organization of complex networks has been shown to increase adaptability and avoid conflicting constraints compared with non-hierarchical networks. This topological feature allows networks to become larger before diseconomies of scale set in (Kauffman, 1993).
Although transcriptional regulatory interactions are conveniently represented as nodes and edges in a network, it is important to note that each node in the network represents several entities (gene, mRNA, and protein) and events (transcription, translation, degradation, etc) that are compressed in both space and time (see Figure 1). Consequently, the dynamic nature of these events (synthesis and degradation of mRNA and protein molecules) and entities (steady-state levels of mRNA and protein molecules) are expected to affect the regulatory interactions in the network. Although we have a good understanding of the topology of regulatory networks, the dynamics of nodes (TFs and TGs) in these networks and their role in systems behavior remain largely unexplored. In this regard, several fundamental questions remain unanswered: for example, do TFs in the regulatory network have distinct dynamic properties (e.g., abundance, half-life, etc) characterizing their role in a regulatory cascade? More generally, does the position of a TF in the network structure relate to its dynamics? Although the richness of this detail is lost in the network representation, such questions can be addressed by integrating diverse genomic datasets encapsulating the dynamics of transcription and translation.
Figure 1.

Network representation of a transcriptional regulatory cascade. Transcription factors (TFs), denoted as nodes in a network (red and green circles), represent several entities (gene, mRNA, and protein) and events (transcription, translation, degradation, etc) that are compressed in both space and time. Although a series of regulatory events can be conveniently represented as a node in the network, the dynamics of the entities and the biological processes that make up the node are not captured.
In this study, we investigate the dynamics of the yeast DNA-binding TFs by integrating diverse genome-scale datasets with the inherent hierarchical structure in the yeast transcription regulatory network. Although several studies have proposed elegant methods to identify hierarchical structures within directed networks (Ma et al, 2004a, 2004b; Balazsi et al, 2005; Yu and Gerstein, 2006), they are either not applicable on networks containing cycles, not scalable, or not always accurate. These issues are critical and need to be addressed before attempting to understand the underlying hierarchical structure in the yeast regulatory network. Hence, as a first step, we present a new graph-theoretical algorithm called vertex sort, a variant of the classic topological sort (Cormen et al, 2001), to elucidate the precise topological ordering of vertices (nodes) in any directed network—acyclic or cyclic. Applying vertex sort on the yeast regulatory network revealed the presence of seven hierarchical levels, which could be grouped into three mutually exclusive hierarchical layers of TFs: top, core and bottom. By overlaying diverse genome-scale data on the inferred hierarchical structure, we show that TFs have static and dynamic properties that are similar within a layer and different across layers, indicating that the network topology and the nodal (TF) dynamics are tightly linked. Our findings suggest that the interplay between the inherent network hierarchy and TF dynamics could be critical to (i) making the regulatory network both robust and adaptable, and (ii) permitting differential utilization of the same underlying network in distinct members of a clonal population.
Results
Vertex sort: an approach to infer hierarchical structure in directed networks
Vertex sort (see Figure 2) first identifies strongly connected components in a given directed network and collapses them into super-nodes. A strongly connected component (SCC) is a sub-network in which, for every pair of vertices (nodes) u and v in the sub-network, there exists a directed path from u to v, and from v to u. Collapsing SCCs in a network will result in a directed acyclic graph (DAG), i.e., a network that is free of cycles, which is a necessary condition for linear ordering of nodes in a directed network. Vertex sort then constructs DAGT, the transpose of DAG, by reversing the direction of edges in the DAG. Next, the iterative leaf-removal algorithm is applied on DAG and DAGT to obtain a linear hierarchical ordering of the nodes for each network. The leaf-removal algorithm is a bottom-up iterative procedure, which, in each iteration, removes all the leaf nodes (those with no outgoing edges) and the edges incident on them from the network. The algorithm ends when the network is fully decomposed. The bottom-up ordering of nodes in DAGT (which is equivalent to the top-down ordering of nodes in DAG) is reversed, which is then combined with the bottom-up ordering of nodes in DAG to obtain the final topological ordering of nodes in the network (see Supplementary information for details of the algorithm). By using both DAG and DAGT, vertex sort reports a linear ordering of nodes that contains all feasible solutions rather than reporting just a single solution. Such an ordering permits nodes to span an entire interval of possible positions in any feasible ordering. It is important to note that the vertex-sort algorithm does not count or enumerate all feasible topological orderings of nodes in a network (a problem that is computationally intractable (NP-hard)). Rather, it only outputs an ordering that contains all feasible solutions. The differences between vertex sort and existing approaches are highlighted in Box 1. In particular, unlike the BFS-level algorithm (Yu and Gerstein, 2006), vertex sort is scalable, i.e., addition of new nodes or edges to an existing network does not alter the relative ordering of any two nodes (see Box 1 and SI for details).
Figure 2.

The vertex-sort algorithm—an approach to infer hierarchical structure in directed networks. Vertex sort first transforms the input network into one that is free of cycles by collapsing the strongly connected components (SCCs), if any, into super-nodes (orange and blue nodes). All edges within the SCC are represented with red arrows. Next, an iterative leaf-removal algorithm is applied on the resulting network and its transpose to obtain the linear ordering of nodes in the network. Super-nodes in the final ordering are represented by their constituent nodes (nodes 7 and 8 for the blue super-node and nodes 3–6 for the orange super-node). The directionality of the gray triangle represents the top-down or bottom-up ordering.
Hierarchical organization of the yeast transcription network
The transcription regulatory network of the yeast Saccharomyces cerevisiae (Figure 3A) was constructed by assembling regulatory interactions inferred from biochemical and ChIP-chip experiments (Svetlov and Cooper, 1995; Horak et al, 2002; Lee et al, 2002; Harbison et al, 2004; Borneman et al, 2006, 2007). The assembled network contained 13 385 interactions among 4503 genes, which included 158 DNA-binding TFs and 4369 TGs. We did not consider non-DNA binding proteins such as chromatin remodeling factors that may also affect gene expression. Vertex sort on this network revealed the underlying hierarchical structure with TFs occupying seven unique levels (Figure 3; BFS-level algorithm on the same network outputs an inaccurate hierarchy; see Supplementary information and Supplementary Figure S1). This means that the longest simple directed path (with no repeated TFs) connects seven TFs with six directed edges. We found that nine TFs are not connected to any other TF in the network (TFs in the right-most column in Figure 3C). As these nine TFs are not part of the inherent hierarchy, we excluded them from further analysis. The network contained one SCC with 64 TFs, which were all rightfully grouped together as a single layer by the algorithm (Figure 3C). By sampling 10 000 random networks with the same size and degree distribution as the yeast regulatory network, we estimate the probability that one would observe a SCC with ⩽64 TFs is <2.8 × 10⁻³ (Supplementary Figure S2; see Materials and methods). This suggests that the size of the SCC in the real yeast transcription network is smaller than what would be expected by chance for a random network of the same size and degree distribution.
Figure 3.

Hierarchical structure in the yeast transcription regulatory network. (A) Yeast regulatory network containing 13 385 regulatory interactions among 4503 genes, which includes 158 transcription factors (TFs) and 4369 target genes (TGs). (B) Vertex sort of TFs in the regulatory network reveals a hierarchical organizational structure (left panel). Middle panel depicts a schematic showing the inherent hierarchical structure with the number of regulatory interactions among TFs within and across layers, and those between TFs and TGs. The central skeleton of the hierarchy resembles a feed-forward structure spanning three basic non-overlapping layers, shown in red, green and blue (right panel). (C) Detailed hierarchical organization of yeast TFs. TFs within each block (polygon) can occupy any of the levels spanned by the block. Nine TFs in the right-most column are not a part of the hierarchy, as they are not connected to any other TF in the network. The hierarchal organization of TFs in the network naturally clusters into three basic non-overlapping layers: the top (red), core (green), and bottom (blue). Thirty-two regulatory hubs are highlighted in bold and marked with a star (*), and nine essential TFs are marked with an arrow.
A large fraction of TFs span more than one level in the hierarchy (see Figure 3C), which makes it difficult to delineate hierarchical levels demarcated by unambiguous boundaries. However, the hierarchal organization of TFs in the network naturally clusters into three basic non-overlapping layers centred on the SCC (level 5 in Figure 3C). All the TFs in the SCC were classified as the core layer. TFs placed in levels above (levels 6–7) and below (levels 1–4) the core-layer TFs were classified as top- and bottom-layer TFs, respectively (Figure 3B and C). Six TFs (PDC2, ARR1, DAT1, RTG1, OTU1, and RPH1), which span the top, core, and bottom layers, were classified as belonging to the top layer, as they are not regulated by any other TF. Similarly, EDS1, which is regulated by a top-layer TF, was classified as belonging to the bottom layer, as it does not regulate any other TF in the network. As a result, 25 TFs were classified as belonging to the top layer, 64 to the core layer, and 59 to the bottom layer. This leaves one TF (PHO2) whose position in the hierarchy is unclear and hence was not considered for further analysis (see Supplementary information).
In principle, using the above-described strategy, any random network with exactly one SCC can be converted into a three-layered hierarchical structure (SCC as core, all TFs that directly or indirectly regulate the core TFs as top-layer TFs, and those that are directly or indirectly regulated by core TFs as bottom-layer TFs). To investigate how often a randomized network with same size and degree distribution as the yeast network will contain a three-layer hierarchical structure, we applied the above described strategy on 10 000 randomly rewired yeast transcriptional networks and found that 95.16% of the randomized networks contained exactly one SCC, and thus effectively a three-layer hierarchical structure. Thus, the number of layers in yeast network by itself is not unexpected. We wish to emphasize that the goal of this study was not to investigate whether or not the yeast regulatory network contains an N-layer hierarchical structure; rather it was to assess the enrichment of various static and dynamic properties of TFs within each inferred layer. We will show in subsequent sections that it is not just the number of layers or the number of TFs in each layer that will yield the trends we observe; rather it is the membership of TFs to specific layers that yields the observed trends.
The central skeleton connecting the top, core, and the bottom layers is not strictly linear (Figure 3B, middle and right panels). Instead, it appears to form a feed-forward structure in which the top-layer TFs regulate the core- and the bottom-layer TFs, and the core-layer TFs regulate the bottom-layer TFs (right panel in Figure 3B). In addition to such a structure, TFs within a layer regulate each other—4, 267, and 32 instances of intra-layer regulatory interactions within the top, core, and bottom layers, respectively (middle panel in Figure 3B). It is interesting to note that the number of regulations among core-layer TFs (267) is greater than all other regulations among the top and bottom layers, and across all three layers combined (4+32+65+158=259), highlighting the complexity of the core layer. TFs from all the three layers regulate distinct and overlapping sets of TGs. This feed-forward structure should not be confused with individual feed-forward loop motifs, which are discussed in the next section.
In general, it is not uncommon for directed networks to have a multi-tiered hierarchical structure. Topological ordering of nodes in any directed acyclic network would show some kind of hierarchical organization. In the extreme case, if the network is bipartite, in which all directed edges in the network are from one set of nodes to the other, the hierarchy will be a flat two-layered structure. Hence, it was not surprising that the yeast regulatory network had an inherent hierarchical structure. The more important question, however, is whether such a hierarchical organization of TFs has any appropriate biological meaning. In particular, do TFs have biologically relevant dynamic properties that reflect their positions and roles in the organizational structure of the network? This, in principle, should be true if the network topology is the result of the underlying biology and, hence, it should be plausible to shed light on the dynamic aspects of TFs that help them organize into the observed complex organizational structure. With this premise, we sought to address these questions by integrating diverse molecular datasets with the inferred hierarchical structure.
TFs in different layers within the hierarchical framework have distinct static properties
First, we examined the local and global topological properties of TFs in relation to the above-established hierarchy. We noticed that, on an average (median values are reported), the TFs in the top layer regulate 54 TGs, the TFs in the core layer regulate 144 TGs, and the TFs in the bottom layer regulate 14 TGs (left panel in Figure 4A). The distribution of regulatory hubs (32 TFs constituting the top 20% of the highly connected TFs) within the hierarchy is striking (middle panel in Figure 4A). The hubs are rarely seen at the top of the hierarchy but are present predominantly in the core layer. In all, 27 out of the 32 TF hubs are present in the core layer, which accounts for 42% of all TFs in the core layer (P<1.7 × 10⁻⁸; hypergeometric test). The bottom layer contains no regulatory hubs (P<3.3 × 10⁻⁸; hypergeometric test). This shows that though the core layer contains the majority of the regulatory hubs, the inherent hierarchical structure is such that the top layer TFs, which are likely to trigger regulatory cascades down the hierarchy, are not enriched in regulatory hubs.
Figure 4.

Static properties of transcription factors (TFs) within the hierarchical framework. (A) Average number of target genes (TGs) regulated or co-regulated by TFs (left), percentage of TFs in each layer that are hubs (middle), and degree distribution of TFs (right). (B) Break-down of combinatorial regulatory patterns from a TG's perspective showing the percentage of TGs regulated by a combinatorial set of TFs from one or more layers. Less than 1% of TGs are jointly regulated by the top- and bottom-layer TFs. Values marked with red and green texts and arrows indicate that the corresponding subgroups are statistically under- or over-represented, respectively, compared with those in random networks of same size and degree distribution as the yeast regulatory network (see Results and Materials and methods). The percentages do not add up to 100, as a small fraction of genes are regulated by the ten unclassified TFs not included in the study. (C) Break-down of feed-forward loop (FFL) motifs showing the composition of all FFL motifs in the yeast regulatory network. Top panel shows FFL motifs where all the three nodes involve TFs, and the bottom panel shows FFL motifs involving two TFs and a TG. About 94% of all FFL motifs involve only the core- and/or top-layer TFs. Statistically over-represented FFL patterns are indicated by a green arrow, P<1.6 × 10⁻³. The percentages do not add up to 100, as a small fraction of genes are regulated by the ten unclassified TFs not included in the study. (D) Percentages of TFs that are essential in each of the three layers of the hierarchy. (E) Distribution of TF conservation levels (presence/absence of orthologs) across 15 fungal genomes in each of the three layers of the hierarchy. (F) Distribution of number of gene ontology (GO) biological processes a TF is associated with.
The 64 TFs in the core layer together regulate or co-regulate about 87% of all TGs in the network. However, the 59 TFs in the bottom layer together regulate or co-regulate only about 25% of all TGs in the network. Despite being smaller in number, the 25 top-layer TFs together regulate or co-regulate about 35% of all TGs. This indicates that the hierarchy does not follow a pyramidal structure as suggested previously (Yu and Gerstein, 2006). Rather, the yeast regulatory network is organized in such a manner that much of the regulatory workload is handled by TFs in the core layer, which appear to have the central role of regulatory signal propagators. It is interesting to note that this aspect is also reflected in the degree distribution of TFs within the hierarchical framework (right panel in Figure 4A). Although the degree distributions of all TFs as well as those only in the bottom layer resemble power-law (R2=0.84 and 0.88, respectively; see Materials and methods), the degree distributions of core-layer TFs and, to some extent, top-layer TFs do not seem to follow power-law (right panel in Figure 4A).
To understand how the TFs within the hierarchical framework regulate their targets, we examined the patterns of combinatorial regulation (co-regulation) in the regulatory network. A TG is said to be co-regulated if it is regulated by two or more TFs (Balaji et al, 2006a, 2006b). We analyzed the co-regulatory patterns from a TG's perspective (Figure 4B). About 65% of all TGs are co-regulated by two or more TFs. Co-regulations that involve only core-layer TFs (22.6%) or those that involve only the core- and the top-layer TFs (17.7%) occur more often than expected by chance (P<10−3 and P<2.5 × 10⁻², respectively; see Materials and methods). The percentage of genes that are co-regulated by TFs from all the three layers (6.8%) is statistically smaller than what one would expect by chance (P<10−3; see Materials and methods). Also, co-regulations involving top- and bottom-layer TFs are statistically under-represented (P<1.5 × 10⁻³; see Materials and methods). In fact, only 0.7% of all TGs are jointly co-regulated by top- and bottom-layer TFs. This suggests that the pecking order of TFs in the hierarchy is well-defined that co-regulations involving top- and bottom-layers are generally discouraged. This is a clear indication that there is very little joint regulation of TGs by the top- and bottom-layer TFs, which is what one expects to see in any hierarchical structure (Kauffman, 1993).
Our observation that the central skeleton of the hierarchy appears to have a structure similar to the feed-forward loop (FFL) motif (right panel in Figure 3B) prompted us to investigate the occurrence of FFLs within this framework. A FFL motif is composed of a ‘general' TF x regulating a second ‘specific' TF y, which jointly regulate a TG z (Alon, 2007). An analysis of the distribution of FFL motifs within the hierarchical framework revealed that about 94% of all FFL motifs involve only the core- and/or top-layer TFs (top panel in Figure 4C). Given that FFL motifs, isolated and overlapping/nested, could help relay persistent signals and may filter out short-term fluctuations in incoming signals (Ghosh et al, 2005; Alon, 2007; Ratushny et al, 2008; Shahrezaei et al, 2008a), it is consistent that FFL motifs are found predominantly at the top of the hierarchy, an attribute that may help filter noise before it can reach deep into the hierarchy. It should be noted that FFLs can serve very different functions depending on (i) which edges in the FFL represent activation or repression (up or downregulation, respectively) (ii) the combinatorial integration (sum, max, AND, OR, etc) of the signals attributed to two or more TFs (edges) regulating a TG, and (iii) whether the FFLs are isolated or overlapping with other FFLs (e.g., cascaded, have feedback loops around and between their nodes, etc). It remains to be investigated if the roles of nested/overlapping FFLs would be any different from the isolated FFLs and how they may affect the signal processing capabilities of the network.
The specific TF in 93% of all FFLs is a core-layer TF (P<6 × 10⁻⁴; see Materials and methods), indicating that the core-layer TFs have a central role in modulating the expression of almost all target genes in the network. Furthermore, in 73% of all FFLs, core-layer TFs serve as both the general and the specific TF. Of the instances in which all the three nodes in a FFL were a TF, we found that 8.3% contain the general TF as a top-layer TF, the specific TF as a core-layer TF, and the TG as a bottom-layer TF (bottom panel in Figure 4C). Although there are no instances of FFLs with all three nodes solely from the top or bottom layers, approximately 50% of all such FFLs (where all nodes are TFs) contain TFs solely from the core layer. This suggests that although the central skeleton of the hierarchical organization of TFs has a feed-forward structure (right panel in Figure 3B), the actual FFLs in the network tend to be initiated or terminated at different layers of the hierarchy.
To assess the importance and the extent of evolutionary conservation of TFs in relation to the hierarchical structure, we analyzed gene essentiality information and evolutionary conservation of TFs across 15 completely sequenced fungal genomes. We found that there is a strong positive correlation (R2=0.96) between gene essentiality and how high the TF is in the hierarchy (Figure 4D). This trend remained the same even when we examined the quantitative fitness data from a recent yeast gene deletion study (Steinmetz et al, 2002) that reported fitness information for non-essential genes across several different growth conditions (Supplementary Figure S3; see Materials and methods). We also found that the TFs in the top and core layers, on an average, are more conserved compared with those in the bottom layer (P<3.9 × 10⁻²; Wilcoxon's rank-sum test) (Figure 4E). As conservation is likely to be a result of functional constraints, we hypothesized that the top- and core-layer TFs might be associated with many different biological processes. Indeed, we found that top- and core-layer TFs, on an average (median values are reported), are associated with four and three Gene Ontology biological processes, respectively, compared with two processes for bottom-layer TFs (P<1.1 × 10⁻⁴; Wilcoxon's rank-sum test) (Figure 4F). Our observation that the top- and core-layer TFs are functionally versatile and highly conserved are consistent with the results from a recent study which showed that the dynamics of gene loss are highly constrained by the functional properties and interacting partners of genes (Wapinski et al, 2007). All of the above observations collectively suggest that the TFs in the top and core layers are more likely to be important for the successful survival and adaptation of the organism to its environment.
TFs in different layers within the hierarchical framework have distinct dynamic properties
We next investigated whether TFs within each hierarchical layer have different dynamic properties in terms of their abundance and degradation rates. Integrating information on transcript abundance (Holstege et al, 1998) and half-life (Wang et al, 2002) with the hierarchical structure revealed that mRNA molecules coding for core-layer TFs are relatively more abundant than that of top- and bottom-layer TFs (Figure 5A). The abundance of transcripts coding for core-layer TFs is statistically higher than that coding for bottom-layer TFs (P<10−3; Wilcoxon's rank-sum test), but not top-layer TFs (P<0.136; Wilcoxon's rank-sum test). Transcripts of TFs from all three layers have similar half-life (Figure 5B). As transcript degradation rates are comparable, this suggested that the core-layer TFs are likely to be transcribed at a higher rate than the top- or bottom-layer TFs. We then investigated if the availability of TFs may be regulated at the protein level.
Figure 5.

Dynamic properties of transcription factors (TFs) within the hierarchical framework. Distribution of TF values in each of the three layers of the inferred hierarchy for transcript abundance (mRNA molecules per cell) (A), transcript half-life (min) (B), protein abundance (protein molecules per cell) (C), protein half-life (min) (D), and noise in protein abundance (variability in protein levels in a cell population) (F). (E) Percentages of TFs in each of the three hierarchical layers containing a TATA-box. The expected percentage is shown as a broken line (22%). The y axis in (F) denotes protein noise measured as the distance from median co-efficient of variation of all proteins (DM; see Materials and methods).
Overlaying protein abundance data (Newman et al, 2006) on the hierarchical structure revealed a very striking trend wherein the top-layer TFs were significantly more abundant on an average (median values are reported; 189.5 copies per cell) when compared with those in the core (approximately 80.75 copies per cell) and the bottom layers (approximately 72 copies per cell; P<3.9 × 10⁻²; Wilcoxon's rank-sum test) (Figure 5C). We investigated if translation efficiency, as measured by tRNA Adaptation Index (tAI) (Man and Pilpel, 2007), could have a role in the observed differences in the abundance of TFs. We found that the tAI was comparable between the TFs from different layers suggesting that degradation rather than synthesis might be the contributing factor for the observed differences in protein abundance (Supplementary Figure S4). Indeed an analysis of protein half-life data (Belle et al, 2006) showed that the TFs in the top layer had a much longer half-life (median value of 42 min) than those in the core (20 min) and the bottom layers (17 min) (P<4.5 × 10⁻²; Wilcoxon's rank-sum test) (Figure 5D). This suggested that the observed slower rate of protein degradation of top-layer TFs is likely to be the reason why they are more abundant than the TFs from the other two layers.
As protein abundance has been found to be correlated with intrinsic noise (i.e., variation due to the inherent stochasticity of biochemical processes such as transcription and translation) in expression levels (Bar-Even et al, 2006; Newman et al, 2006) in a clonal population of cells, we investigated the relationship, if any, between the intrinsic noise of TFs and the TFs' position in the hierarchy. In particular, we examined whether the TFs within different hierarchical layers show more or less intrinsic stochasticity in their protein expression levels (relative to TFs in other layers and not to the entire proteome) among individuals in a population of genetically identical cells. To this end, we gathered data on intrinsic noise in protein levels in yeast cells from a recent study (Newman et al, 2006). Integrating information on intrinsic protein noise, measured as the distance from median coefficient of variation (DM; see Materials and methods), with the hierarchical structure revealed that the TFs in the top layer have relatively much larger intrinsic variation in protein abundance when compared with the TFs in the core and the bottom layers (P<3.8 × 10⁻²; Wilcoxon's rank-sum test) (Figure 5F). Although our observation that the ‘more abundant' top-layer TFs are intrinsically noisier may seem to be contradictory (as they are expected to be less noisy because abundance generally correlates inversely with noise), we wish to emphasize an important point here. The median abundance for the TFs considered in our study is 81 molecules per cell, whereas the median abundance of all proteins is 185 molecules per cell. Thus, even though we report that the top-layer TFs are highly abundant, this is only relative to the core- and bottom-layer TFs, and not compared with the set of all proteins in the genome. In other words, the top-layer TFs are relatively less abundant and noisier compared with all the set of all proteins in the genome.
An important source of intrinsic stochasticity in gene expression is linked to the presence of TATA-box in the promoter regions of genes. The presence of a TATA-box has been shown to facilitate multiple rounds of transcription initiation, contributing to the variation in the expression levels of mRNA and/or protein (Blake et al, 2003; Raser and O'Shea, 2004; Raj and van Oudenaarden, 2008). Indeed, it has been shown that point mutations to the TATA-box result in drastic noise reduction (Blake et al, 2006) and that genes with and without a TATA-box show a difference in expression divergence, mutational variance and their regulation (Tirosh et al, 2006; Landry et al, 2007; Heath et al, 2008). We therefore obtained the set of genes with a predicted TATA-box (Basehoar et al, 2004) and investigated the occurrence of a TATA-box in promoter regions of TFs in different hierarchical layers. Our analysis revealed that 8% of the top-layer TFs, 30% of the core-layer TFs, and 20% of the bottom-layer TFs contain a predicted TATA-box (Figure 5E), indicating that the core-layer TFs tend to be noisier (P<0.028; hypergeometric test) than the top-layer TFs at the transcriptional level. However, as the top-layer TFs are noisier than the core-layer TFs at the protein level (Figure 5F), these results suggest one of the following possibilities: (i) transcriptional noise is modulated (i.e., amplified for top-layer TFs and buffered for core- and bottom-layer TFs) at the translational level (Blake et al, 2003), (ii) the genes with TATA-box may still be noisy at the protein level, but such TFs may be expressed in a condition-specific manner and may not have been expressed in the experimental conditions in which protein noise was measured by Newman et al (2006), (iii) the predicted TATA-box upstream of TFs may have mutations that make them slightly different from the consensus TATA-box sequence, and hence these TFs may not show the previously reported correlation between protein noise and the ‘presence' of a TATA-box (Blake et al, 2006), or (iv) extrinsic factors might contribute to the increased variability in protein levels of top-layer TFs.
Although we have investigated the possible influence of intrinsic noise on the expression dynamics of these TFs, it should be noted that noise could be influenced by both intrinsic and extrinsic factors such as fluctuations in the local environment, amounts or states of other cellular components indirectly leading to variation in the expression of a particular gene (Swain et al, 2002; Paulsson, 2004; Raser and O'Shea, 2005). Indeed, it has been suggested recently that both the timescales of extrinsic fluctuations and their non-specificity substantially affect the function and performance of biochemical networks (Shahrezaei et al, 2008a). Therefore, future systematic genome-scale studies aimed at investigating the effect of extrinsic noise will be important for decoupling the influence of intrinsic and extrinsic noise on much larger regulatory networks and its influence on systems behavior.
To ensure that the trends we observed are not expected by chance, we investigated how often the observed trends can also be seen if a different hierarchy inference procedure was used. To this end, we analyzed the static and dynamic properties of the TFs that were grouped according to the BFS-level algorithm. Although the hierarchical structures returned by vertex-sort and the BFS-level algorithms are different, a significant overlap of TFs in the corresponding layers was observed (see Supplementary Table S1). This analysis showed that when it comes to static properties, the trends were comparable to that obtained using vertex sort algorithm. However, when it comes to dynamic properties, the outcomes were very different. In particular, the distribution of protein abundance, half-lives, and noise in protein expression and the presence of TATA-box at the promoter region of top layer TFs, as inferred by BFS-level algorithm, were not statistically different compared with the core and/or bottom layer TFs (see Supplementary Figure S5). This is because the top-layer TFs, as defined by the vertex-sort algorithm, is inaccurately classified as belonging to the middle layer in BFS-level hierarchy, thereby resulting in no statistically significant difference of these properties between the layers (see Supplementary information and Supplementary Figure S1). This direct comparison of groupings obtained from vertex-sort and BFS-level algorithms shows that it is not just the number of layers or the number of TFs in each layer that will yield the trends we observe for protein abundance, half-life, and noise, rather it is the membership of TFs to specific layers that yields the observed trends.
Discussion
Recent studies have largely focused on understanding how topological properties and network organization characterize complex biological systems. However, the dynamic nature of the nodes and its role in systems behavior on a genomic-scale has remained unclear. In this study, we used a new method called vertex sort to classify DNA-binding TFs in the yeast regulatory network into seven hierarchical levels, which naturally clustered into three mutually exclusive hierarchical layers that were named as top, core, and bottom. By integrating several genome-scale datasets onto the inferred hierarchy, we found that TFs have static and dynamic properties that are similar within a layer and different across layers. These findings indicate that the network topology and the nodal (TF) dynamics are tightly linked.
We did not find the inherent hierarchy to be strictly linear or pyramidal as previously suggested (Yu and Gerstein, 2006). Instead, we found that the central skeleton appears to have a feed-forward structure (Figure 3B). The core layer is enriched in TFs that regulate many genes and the bottom layer contains TFs that regulate few genes (Figure 4A), further suggesting that the hierarchy is non-pyramidal. In addition, the fact that the core-layer TFs regulate or co-regulate 87% of all target genes, and are involved in over 90% of all feed-forward loops suggest that core-layer TFs are the power-centers of the regulatory network, which is consistent with previous observations (Maslov and Sneppen, 2005; Farkas et al, 2006). Our observation of a multi-level hierarchy with a strongly connected component (core-layer; SCC) is consistent with what has been discussed recently by Bar-Yam et al (2009), where they suggested that the complexity of the transcriptional network in cellular systems is somewhere in between a strictly hierarchical ‘autocratic' structure (with multiple hierarchical levels and no SCC) and a highly interconnected ‘democratic' structure (in which a few master-regulator TFs regulate the set of other TFs that mutually regulate each other, effectively forming a two-level hierarchy).
Overlaying large-scale genomic datasets on transcript abundance, transcript half-life, translation efficiency, protein abundance, protein half-lives, and protein and transcription noise on the inferred hierarchical structure showed that the dynamics of TFs in the regulatory network is not random. Rather, we find that TFs in distinct hierarchical layers of the network have similar dynamic properties, indicating that the network topology and the nodal (TF) dynamics at the mRNA and the protein level are tightly linked. Although the presence of a hierarchical structure in the yeast regulatory network is of interest in itself, our finding that the TFs possess inherent characteristics that encapsulate their dynamic roles in systems behavior is noteworthy and unexpected.
Our observations that transcript half-lives of TFs from the three layers are comparable (Figure 5B), but the top-layer TFs are present in relatively higher abundance at the protein level (Figure 5C) and have a much longer protein half-life (Figure 5E) when compared with that of core- and bottom-layer TFs suggest that post-translational regulation has an important role in ensuring the availability of right amount of each TF within the cell. The need for the presence of top-layer TFs to relay faithful signals down the transcriptional cascade and their involvement in many biological processes (Figure 4F) could explain why top-layer TFs need to be relatively abundant than the core- and bottom-layer TFs. These findings are consistent with what has been proposed by Farkas et al (2006) who suggested a model in which regulatory cascades originating from distinct fractions of the regulatory network control robust integrated responses to complex stimuli.
The observation that top-layer TFs show a relatively higher variability in protein abundance between individuals in a clonal population of cells (Figure 5F) suggests that such a behavior may confer a selective advantage to individuals, as this permits at least some members in a population to respond effectively to changing conditions by triggering relevant transcriptional cascades (Spudich and Koshland, 1976; McAdams and Arkin, 1999; Rao et al, 2002; Kaern et al, 2005; Raser and O'Shea, 2005; Blake et al, 2006; Ramsey et al, 2006; Samoilov et al, 2006; Acar et al, 2008; Heath et al, 2008; Lopez-Maury et al, 2008; Raj and van Oudenaarden, 2008; Shahrezaei and Swain, 2008b). For instance, ABF1, which is a multifunctional TF present in the top layer, is an abundant protein whose levels are noisy in a clonal population of cells. However, the activity of ABF1 depends on the availability of its co-activators (e.g., CDC6) and on its phosphorylation state, which is known to be regulated by several kinases (e.g., casein kinase 2) or phosphatases (Silve et al, 1992; Upton et al, 1995). The relatively higher noise in the abundance of ABF1 might ensure that, at least, some members in a population would respond rapidly to changing environments (i.e., when co-activators or kinases are activated in response to the altered external stimulus). We propose that high variability in the expression of key TFs, whose TGs might contribute to phenotypic variation, might be a general strategy to facilitate adaptation to diverse environments (see Figure 6 for a model). This does not exclude the possibility that variation in the protein expression levels of specific target genes (independent of the variation in the levels of their regulating TFs) might dictate cell-fate outcomes in a post-transcriptional or post-translational manner. Hence, a detailed investigation that integrates multiple types of networks with data on cell-to-cell variation in the levels of transcripts and proteins might elucidate the contribution from TF-dependent and TF-independent modes for adaptability of cells to changing environments.
Figure 6.

A schematic model describing the conceptual framework of differential utilization of the same underlying regulatory network by distinct members of a genetically identical cell population. (A) A toy regulatory network showing two regulatory pathways, which will be used to respond to two specific extracellular stimuli. The red, green, and blue nodes in the network represent transcription factors (TFs), symbolically representing the inferred top-, core-, and bottom-layer TFs in the hierarchical network, respectively. (B) Members of a clonal cell population responding to stimulus 1 (top panel). The variability in expression of top-layer TFs (shown as nodes in varying shades of red; middle panel) permits differential sampling of the same underlying network by distinct members of a genetically identical population of cells. TFs colored in gray are not expressed at necessary levels, and are shown as inactive nodes. Edges originating from inactive TFs are inactive (shown in gray). A noisy master-regulator TF at the top of the hierarchy would mean that only a subset of a population, in which this TF is expressed at necessary levels, will have this TF in active form. An inactive TF at the top of a hierarchical regulatory cascade will result in the non-expression per inactivation of all downstream TFs and TGs dependent on this TF. Members of a clonal population whose regulatory pathway for a specific extracellular stimulus is active will initiate an effective response when that stimulus is encountered. And, those members in whom this regulatory pathway is inactive will be unable to mount an effective response. Though all members in the population are sampling the part of the network necessary to respond to stimulus 1, only a few members (shown as purple and orange cells; bottom panel) are sampling (or poised to sample) the part of the network necessary to respond to stimulus 2. (C) A change in stimulus (from stimulus 1 to 2) causes only those cells that have an active regulatory response pathway for stimulus 2 to effectively respond and survive, whereas the others may mount a late response or will not survive. Alternatively, low expression of top-layer TFs might facilitate cell survival if the pathway regulated by such TFs leads to cell death (e.g., apoptosis). Thus, the presence of noisy TFs at the top of the hierarchical regulatory cascade might confer a selective advantage as this permits at least some members in a clonal population to respond to changing conditions.
Further, our observation that the protein levels of the core-layer TFs (the power-centers) and bottom-layer TFs are inherently tightly regulated suggests that such a tight regulation, along with other regulatory mechanisms such as post-translational modifications or physical interactions with other proteins, might act as a filter to minimize noise propagation down the hierarchy due to any ‘inadvertently' triggered response. In other words, tight regulation of the core- and bottom-layer TFs by rapid degradation (i.e., shorter protein half-life; Figure 5D) would ensure that such TFs are present only in low levels under normal conditions. Their presence in relatively lower levels might facilitate minimization of noise propagation because sufficient levels of TFs may not be present to trigger an appropriate response when transient signals ‘inadvertently' activate them. Therefore, we suggest that the tight regulation of protein levels of the core- and bottom-level TFs might ensure fidelity and robustness in a regulatory cascade.
Taken together, our findings suggest that (i) the higher variability in abundance of top-layer TFs compared with core- and bottom-layer TFs in distinct members of a clonal cell population might permit differential utilization of the same underlying network (see Figure 6) and (ii) the tight regulation of core- and bottom-layer TFs might contribute to fidelity in gene expression. Thus, the interplay between the dynamics of individual nodes and the topology of the regulatory network would make the underlying network robust and permit at least some members in a population to effectively adapt to (or survive in) changing environments.
Our findings have implications in synthetic biology experiments aimed at engineering gene regulatory circuits (Becskei and Serrano, 2000; Elowitz and Leibler, 2000; Gardner et al, 2000). In particular, the dynamics of TFs in terms of their abundance, half-life, and noise cannot be ignored as modulating these attributes could affect the outcome of a regulatory cascade. The proposed conceptual framework (see Figure 6) from our findings serves as a general model and also has important implications for a number of apparently different but related phenomena as outlined below.
Bacterial persistence or adaptive resistance
This is a phenomenon where a fraction of a genetically homogeneous microbial population survives upon exposure to stress, such as antibiotics (Balaban et al, 2004; Levin, 2004; Dhar and McKinney, 2007). Although key regulatory proteins, which facilitate random phenotypic switching, have been implicated in this phenomenon (Dhar and McKinney, 2007), we suggest that the altered dynamics and stochastic expression of certain regulatory proteins may alter the susceptibility of an individual by facilitating differential utilization of the underlying network efficiently (Figure 6). This might permit alteration of the phenotype (i.e., the switching in susceptibility states) in an otherwise genetically identical population of cells. Indeed, this suggestion is supported by recent studies which have implicated TFs such as PhoU (Li and Zhang, 2007) and the two component signal transduction system DpiAB (Miller et al, 2004) in this phenomenon.
Differential cell-fate outcome in response to the same uniform stimulus
Factional survival or cell-death in clonal cell populations upon drug treatment is a well-known phenomenon in certain diseases such as cancer. Two important studies recently showed that this could be achieved by variability in the expression dynamics of key regulatory proteins that determine cell fate such as death or survival. In one study (Cohen et al, 2008), it was shown that the dynamics of the regulatory proteins, which either dictate cell death or survival, varied widely between individual cancer cells. In the other study (Spencer et al, 2009), it was shown that naturally occurring differences in the levels or states of proteins regulating apoptosis are the primary causes of cell-to-cell variability in the timing and probability of death in individual members of the population upon induction of apoptosis. We suggest that this dynamic variability in expression level of key regulatory proteins might permit differential sampling (i.e., the survival network or the apoptotic network) of the same underlying regulatory network (governing all cells) by different members in a clonal population (see Figure 6). This differential network utilization might result in divergent cell-fate outcomes among different individuals in an otherwise identical cell population.
Phenotypic variability in fluctuating environments
When organisms experience fluctuating environments, individuals of the same population may exhibit very different phenotypes. This may be achieved either by sensing followed by response or through the generation of diversity by random switching between different states (Kussell and Leibler, 2005; Acar et al, 2008). Although variation in expression levels of certain regulatory proteins has been implicated in this phenomenon, we suggest that such variation in expression levels may allow stochastic switching between phenotypes by poising certain individuals or permitting the sampling of relevant parts of the same underlying network (see Figure 6). This suggestion is supported by recent studies. Upon fluctuating nutrient starvation, some yeast cells sporulated, whereas others underwent delayed sporulation (Nachman et al, 2007). This variability was shown to be governed by the variation in the production rate of the meiotic master regulator Ime1p and its gradual increase over time. In another set of studies, by analyzing the probabilistic and transient differentiation of Bacillus subtilis cells into the state of competence (Iber, 2006; Suel et al, 2006, 2007; Maamar et al, 2007), it was shown that variation in the expression level of ComK determines the frequency of the differentiation events. The increased variability in expression level of these key regulatory proteins, in turn, might permit different individuals in the same population to activate relevant parts (i.e., the sporulation sub-network or the competence sub-network) of the same underlying global transcriptional network to exhibit phenotypic variability (i.e., to sporulate or not; to exhibit a competence or vegetative state).
Cellular differentiation and development
During the course of stem-cell differentiation and development, it has been well established that maintaining the right balance of combinations of key TFs and appropriate signaling environment in space and time dictates (a) lineage specification of the progenitor cells (e.g., myeloid lineage commitment from hematopoietic stem cells; see (Iwasaki and Akashi, 2007)) and (b) formation of distinct spatial patterns of cell-types during organ development (e.g., cell fate specification in neural development; see (Guillemot, 2007)). In this context, the inherent dynamics of TFs, such as cell-to-cell variation in expression levels, might have an important role in development, stem cell maintenence and differentiation (Arias and Hayward, 2006; Huang et al, 2007; Silva and Smith, 2008). Although dedicated circuits that filter noise in expression may be required for certain processes to be robust and reproducible (Arias and Hayward, 2006; Barkai and Shilo, 2007), we suggest that distinct TF dynamics, as dictated by the position in the hierarchy of the transriptional network, might provide the flexibility for individuals in a population to initiate distinct response and sample distinct networks that permit lineage commitment when the appropriate signaling environment is experienced (see Figure 6). The implications of our findings assume significance particularly in light of the recent discovery that transcriptome-wide noise of specific TFs controls lineage choice during stem cell differentiation (Chang et al, 2008; Kalmar et al, 2009)
In conclusion, investigating the dynamics (e.g., cell-to-cell variability in abundance, half-life of transcripts and proteins, etc) of individual nodes in relation to the network organization in other biological networks such as the protein interaction network, kinase-substrate regulatory network, metabolic network, and understanding their impact on each other will be important to obtain a better understanding of how (i) cells adapt to changing environments, (ii) different phenotypic outcomes are mediated in clonal cell populations and (iii) mutations that disrupt the dynamics of key regulatory proteins may influence disease conditions.
Materials and methods
Vertex-sort algorithm
Given a directed network, vertex sort first identifies SCCs and collapses them into super-nodes. It then constructs DAGT, the transpose of DAG, by reversing the direction of edges in the DAG. Next, it applies the iterative leaf-removal algorithm on DAG and DAGT to obtain linear hierarchical ordering of the nodes in each network. The leaf-removal algorithm is a bottom-up iterative procedure, which, in each iteration, removes all the leaf nodes (those with no out-going edges) and the edges incident on them from the network. Finally, after the network is fully decomposed, the (top-down) ordering of nodes in DAGT is reversed, which is then combined with the (bottom-up) ordering of nodes in DAG to obtain the final topological order of nodes in the network (see Figure 2, Box 1, and Supplementary information for details and the pseudocode).
Datasets
Yeast transcription network
The yeast transcription regulatory network was assembled from biochemical and ChIP-chip experiments (Svetlov and Cooper, 1995; Horak et al, 2002; Lee et al, 2002; Harbison et al, 2004; Borneman et al, 2006, 2007). The resulting network had 13 385 regulatory interactions among 4503 genes. This includes 158 DNA-binding TFs and 4369 TGs. The top 20% of the highly connected TFs (32 TFs that regulate 162 or more TGs) were considered as regulatory hubs. A TG is said to be combinatorially regulated if it is regulated by two or more TFs. About 65% of all target genes are regulated by two or more TFs.
Essentiality, conservation, and gene ontology analysis
The list of essential yeast genes was obtained from the Saccharomyces genome database (http://www.yeastgenome.org). In all, 9 out of the 158 TFs were found to be essential. Evolutionary conservation of yeast TFs across 15 different fungal genomes was assessed by computing the percentage of genomes in which a TF is conserved. Bi-directional BLAST best-hits were used to determine whether a TF is conserved in one of the other fungal genomes. The list of Gene Ontology biological processes in which a TF is involved was obtained from the Saccharomyces genome database.
Condition-specific quantitative fitness
Fitness information for non-essential genes across different media was obtained from the yeast gene deletion study by Steinmetz et al (2002). We considered five media, representing major growth conditions of yeast (YPD—1% Bacto-peptone, 2% yeast extract, and 2% glucose; YPDGE—0.1% glucose, 3% glycerol, and 2% ethanol; YPG—3% glycerol; YPE—2% ethanol; and YPL—2% lactate), for which a deletion screen was carried out twice for reproducibility purposes. The quantitative fitness of each deletion strain was computed by averaging the fitness values from the two time-courses. In cases where strain fitness could only be measured in one time-course, we used that measurement directly. Using an approach similar to that of Gu et al (2003), we classified the genes into four fitness categories based on their quantitative fitness value f: lethal (f=0), strong negative effect (0<f<0.8), moderate negative effect (0.8⩽f⩽0.95), weak or no effect (0.95<f⩽1.05), and positive effect (f>1.05).
Transcript abundance and half-life
Information on transcript abundance and transcript half-life was obtained from previously published studies (Holstege et al, 1998; Wang et al, 2002). Transcript abundances for yeast grown in YPD were determined by using an Affymetrix high-density oligonucleotide array and transcript half-lives were determined by monitoring transcript levels over several minutes after inhibiting transcription by using a temperature sensitive RNA polymerase rpb1-1 mutant S. cerevisiae strain.
Protein abundance, half-life and noise
Protein abundance and noise data was obtained from a recent study by Newman et al (2006). Protein half-life data was obtained from Belle et al (2006). Estimates of the endogenous protein expression levels during log-phase were obtained by tagging every yeast protein with GFP and measuring the intensity. Protein half-lives were determined by first inhibiting protein synthesis by the addition of cyclohexamide and by monitoring the abundance of each tagged protein in the yeast genome as a function of time. Measurements of noise in protein levels in a population of cells were obtained in a single-cell proteomics study that coupled high-throughput flow cytometry and a library of GFP tagged yeast strains. Noise was calculated as the ratio of the standard deviation to its mean abundance. For every protein, DM represents the difference between the noise value of that protein and the median over all proteins. Lower values represent less noise in protein abundance. The data on genes with a predicted TATA-box was obtained from Basehoar et al (2004).
Statistical significance
Combinatorial regulations and FFL motifs
To assess whether the observed characteristics are not a direct result of the underlying network structure, we carried out the same set of analyses on 10 000 random trials. In each trial, the TFs were randomly classified into three groups (top, core and bottom) of sizes identical to that seen in the real data. The results were normalized with respect to the number of TFs in each layer. The P-value was calculated as the fraction of times (over 10 000 trials) a value observed in the random trial is, at least, as much as that observed for the real data. Bonferroni correction was applied to the obtained P-values as multiple hypotheses were tested.
Comparison of distributions
The Wilcoxon's rank-sum test, also known as Mann–Whitney U test, was used to test if two samples of observations came from the same distribution.
Enrichment analysis
The hypergeometric test was used to assess the significance of whether a given sample of observations is enriched for a particular attribute.
Assessment of fits to distributions
Attempts were made to fit several linear and non-linear equations to the data points, and the distribution that fits the data points the best (measured as the one with the highest coefficients of variation, R2) is reported.
Comparison of the different methods to uncover hierarchical structures in directed networks.
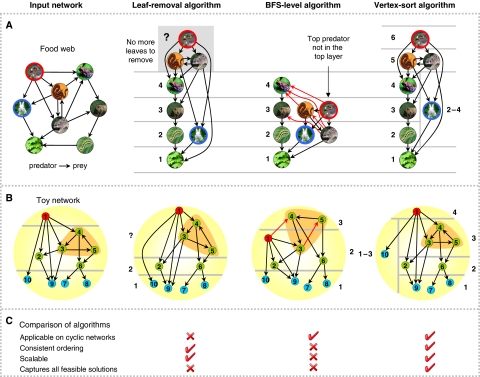
To illustrate the issues and the differences in the perceived hierarchical structure inferred by different methods, we use a food web network (A) and a toy network (B) with pre-defined hierarchical structures. In the food-web network, nodes represent organisms and links represent predator-prey relationships. The hierarchical structures obtained by different hierarchy elucidation algorithms output very different solutions when applied to the same network. The leaf-removal algorithm fails when cycles are encountered, and does not allow for ambiguity when a node's position in the hierarchy is unclear (the rabbit's position in A). Though the BFS-level algorithm can handle cycles, it is not scalable, nor does it always produce accurate ordering or allow for ambiguity. These issues are overcome by vertex sort, which is applicable on cyclic networks, provides consistent ordering, and allows for ambiguity. Vertex sort's robustness is evident from its scalability, i.e., addition of new nodes or edged to an existing network do not alter the relative ordering of any two nodes. For instance, let u and v be two nodes belonging to hierarchical layers i and j⩽i in the original network, respectively. Vertex sort guarantees that the redefined layers i* and j* of nodes u and v after the addition of new nodes and/or edges to the network will be such that j*⩽i*.
Supplementary Material
Supplementary text, Supplementary figures S1-5, Supplementary table S1
Data: Yeast regulatory network
Acknowledgments
We thank several colleagues from National Institutes of Health (NIH) and Medical Research Council (MRC) for providing helpful comments on the paper. We also thank the anonymous referees for helpful suggestions on a previous version of this paper. RJ was supported by the intramural research program of the National Institutes of Health, NIEHS. SB, TMP, and LA were supported by the intramural research program of National Institutes of Health, NLM. MMB acknowledges Darwin College and Schlumberger Ltd. MMB, AW, and JG acknowledge the MRC for funding their research. JG was supported by the MRC special training award in computational biology.
Author contributions: RJ, SB, and MMB designed the study; RJ and SB gathered the data; RJ carried out the experiments. JAG contributed to the network motif analysis; RJ, SB, and MMB analyzed the data with contributions from AW, JG, TMP, and LA; RJ and MMB wrote the paper; we read and approved the final version of the paper.
Footnotes
The authors declare that they have no conflict of interest.
References
- Acar M, Mettetal JT, van Oudenaarden A (2008) Stochastic switching as a survival strategy in fluctuating environments. Nat Genet 40: 471–475 [DOI] [PubMed] [Google Scholar]
- Alon U (2007) Network motifs: theory and experimental approaches. Nat Rev Genet 8: 450–461 [DOI] [PubMed] [Google Scholar]
- Arias AM, Hayward P (2006) Filtering transcriptional noise during development: concepts and mechanisms. Nat Rev Genet 7: 34–44 [DOI] [PubMed] [Google Scholar]
- Babu MM, Luscombe NM, Aravind L, Gerstein M, Teichmann SA (2004) Structure and evolution of transcriptional regulatory networks. Curr Opin Struct Biol 14: 283–291 [DOI] [PubMed] [Google Scholar]
- Balaban NQ, Merrin J, Chait R, Kowalik L, Leibler S (2004) Bacterial persistence as a phenotypic switch. Science 305: 1622–1625 [DOI] [PubMed] [Google Scholar]
- Balaji S, Babu MM, Iyer LM, Luscombe NM, Aravind L (2006a) Comprehensive analysis of combinatorial regulation using the transcriptional regulatory network of yeast. J Mol Biol 360: 213–227 [DOI] [PubMed] [Google Scholar]
- Balaji S, Iyer LM, Aravind L, Babu MM (2006b) Uncovering a hidden distributed architecture behind scale-free transcriptional regulatory networks. J Mol Biol 360: 204–212 [DOI] [PubMed] [Google Scholar]
- Balazsi G, Barabasi AL, Oltvai ZN (2005) Topological units of environmental signal processing in the transcriptional regulatory network of Escherichia coli. Proc Natl Acad Sci USA 102: 7841–7846 [DOI] [PMC free article] [PubMed] [Google Scholar]
- Bar-Even A, Paulsson J, Maheshri N, Carmi M, O′Shea E, Pilpel Y, Barkai N (2006) Noise in protein expression scales with natural protein abundance. Nat Genet 38: 636–643 [DOI] [PubMed] [Google Scholar]
- Bar-Yam Y, Harmon D, de Bivort B (2009) Systems biology. Attractors and democratic dynamics. Science 323: 1016–1017 [DOI] [PubMed] [Google Scholar]
- Barabasi AL, Oltvai ZN (2004) Network biology: understanding the cell′s functional organization. Nat Rev Genet 5: 101–113 [DOI] [PubMed] [Google Scholar]
- Barkai N, Shilo BZ (2007) Variability and robustness in biomolecular systems. Mol Cell 28: 755–760 [DOI] [PubMed] [Google Scholar]
- Basehoar AD, Zanton SJ, Pugh BF (2004) Identification and distinct regulation of yeast TATA box-containing genes. Cell 116: 699–709 [DOI] [PubMed] [Google Scholar]
- Becskei A, Serrano L (2000) Engineering stability in gene networks by autoregulation. Nature 405: 590–593 [DOI] [PubMed] [Google Scholar]
- Belle A, Tanay A, Bitincka L, Shamir R, O'Shea EK (2006) Quantification of protein half-lives in the budding yeast proteome. Proc Natl Acad Sci USA 103: 13004–13009 [DOI] [PMC free article] [PubMed] [Google Scholar]
- Blake WJ, Balazsi G, Kohanski MA, Isaacs FJ, Murphy KF, Kuang Y, Cantor CR, Walt DR, Collins JJ (2006) Phenotypic consequences of promoter-mediated transcriptional noise. Mol Cell 24: 853–865 [DOI] [PubMed] [Google Scholar]
- Blake WJ, M KA, Cantor CR, Collins JJ (2003) Noise in eukaryotic gene expression. Nature 422: 633–637 [DOI] [PubMed] [Google Scholar]
- Borneman AR, Gianoulis TA, Zhang ZD, Yu H, Rozowsky J, Seringhaus MR, Wang LY, Gerstein M, Snyder M (2007) Divergence of transcription factor binding sites across related yeast species. Science 317: 815–819 [DOI] [PubMed] [Google Scholar]
- Borneman AR, Leigh-Bell JA, Yu H, Bertone P, Gerstein M, Snyder M (2006) Target hub proteins serve as master regulators of development in yeast. Genes Dev 20: 435–448 [DOI] [PMC free article] [PubMed] [Google Scholar]
- Chang HH, Hemberg M, Barahona M, Ingber DE, Huang S (2008) Transcriptome-wide noise controls lineage choice in mammalian progenitor cells. Nature 453: 544–547 [DOI] [PMC free article] [PubMed] [Google Scholar]
- Cohen AA, Geva-Zatorsky N, Eden E, Frenkel-Morgenstern M, Issaeva I, Sigal A, Milo R, Cohen-Saidon C, Liron Y, Kam Z, Cohen L, Danon T, Perzov N, Alon U (2008) Dynamic proteomics of individual cancer cells in response to a drug. Science 322: 1511–1516 [DOI] [PubMed] [Google Scholar]
- Cormen TH, Leiserson CE, Rivest RL, Stein C (2001) Introduction to Algorithms, 2nd edn. Cambridge, MA, USA: The MIT Press [Google Scholar]
- Cosentino Lagomarsino M, Jona P, Bassetti B, Isambert H (2007) Hierarchy and feedback in the evolution of the Escherichia coli transcription network. Proc Natl Acad Sci USA 104: 5516–5520 [DOI] [PMC free article] [PubMed] [Google Scholar]
- Dhar N, McKinney JD (2007) Microbial phenotypic heterogeneity and antibiotic tolerance. Curr Opin Microbiol 10: 30–38 [DOI] [PubMed] [Google Scholar]
- Elowitz MB, Leibler S (2000) A synthetic oscillatory network of transcriptional regulators. Nature 403: 335–338 [DOI] [PubMed] [Google Scholar]
- Farkas IJ, Wu C, Chennubhotla C, Bahar I, Oltvai ZN (2006) Topological basis of signal integration in the transcriptional-regulatory network of the yeast, Saccharomyces cerevisiae. BMC Bioinformatics 7: 478. [DOI] [PMC free article] [PubMed] [Google Scholar]
- Freyre-Gonzalez JA, Alonso-Pavon JA, Trevino-Quintanilla LG, Collado-Vides J (2008) Functional architecture of Escherichia coli: new insights provided by a natural decomposition approach. Genome Biol 9: R154. [DOI] [PMC free article] [PubMed] [Google Scholar]
- Gardner TS, Cantor CR, Collins JJ (2000) Construction of a genetic toggle switch in Escherichia coli. Nature 403: 339–342 [DOI] [PubMed] [Google Scholar]
- Ghosh B, Karmakar R, Bose I (2005) Noise characteristics of feed forward loops. Phys Biol 2: 36–45 [DOI] [PubMed] [Google Scholar]
- Gu Z, Steinmetz LM, Gu X, Scharfe C, Davis RW, Li WH (2003) Role of duplicate genes in genetic robustness against null mutations. Nature 421: 63–66 [DOI] [PubMed] [Google Scholar]
- Guillemot F (2007) Cell fate specification in the mammalian telencephalon. Prog Neurobiol 83: 37–52 [DOI] [PubMed] [Google Scholar]
- Han JD, Bertin N, Hao T, Goldberg DS, Berriz GF, Zhang LV, Dupuy D, Walhout AJ, Cusick ME, Roth FP, Vidal M (2004) Evidence for dynamically organized modularity in the yeast protein-protein interaction network. Nature 430: 88–93 [DOI] [PubMed] [Google Scholar]
- Harbison CT, Gordon DB, Lee TI, Rinaldi NJ, Macisaac KD, Danford TW, Hannett NM, Tagne JB, Reynolds DB, Yoo J, Jennings EG, Zeitlinger J, Pokholok DK, Kellis M, Rolfe PA, Takusagawa KT, Lander ES, Gifford DK, Fraenkel E, Young RA (2004) Transcriptional regulatory code of a eukaryotic genome. Nature 431: 99–104 [DOI] [PMC free article] [PubMed] [Google Scholar]
- Heath AP, Kavraki L, Balázsi G (2008) Bipolarity of the Saccharomyces cerevisiae genome. IEEE 2nd Intl Conf Bioinformatics Biomed Eng 330–333 [Google Scholar]
- Holstege FC, Jennings EG, Wyrick JJ, Lee TI, Hengartner CJ, Green MR, Golub TR, Lander ES, Young RA (1998) Dissecting the regulatory circuitry of a eukaryotic genome. Cell 95: 717–728 [DOI] [PubMed] [Google Scholar]
- Horak CE, Luscombe NM, Qian J, Bertone P, Piccirrillo S, Gerstein M, Snyder M (2002) Complex transcriptional circuitry at the G1/S transition in Saccharomyces cerevisiae. Genes Dev 16: 3017–3033 [DOI] [PMC free article] [PubMed] [Google Scholar]
- Huang S, Guo YP, May G, Enver T (2007) Bifurcation dynamics in lineage-commitment in bipotent progenitor cells. Dev Biol 305: 695–713 [DOI] [PubMed] [Google Scholar]
- Iber D (2006) A quantitative study of the benefits of co-regulation using the spoIIA operon as an example. Mol Syst Biol 2: 43. [DOI] [PMC free article] [PubMed] [Google Scholar]
- Iwasaki H, Akashi K (2007) Myeloid lineage commitment from the hematopoietic stem cell. Immunity 26: 726–740 [DOI] [PubMed] [Google Scholar]
- Kaern M, Elston TC, Blake WJ, Collins JJ (2005) Stochasticity in gene expression: from theories to phenotypes. Nat Rev Genet 6: 451–464 [DOI] [PubMed] [Google Scholar]
- Kalmar T, Lim C, Hayward P, Muñoz-Descalzo S, Nichols J, Garcia-Ojalvo J, Martinez Arias A (2009) Regulated fluctuations in nanog expression mediate cell fate decisions in embryonic stem cells. PLoS Biol 7: e1000149. (doi:10.1371/journal.pbio.1000149; PMID: 19582141) [DOI] [PMC free article] [PubMed]
- Kauffman S (1993) The Origins of Order. New York: Oxford University Press [Google Scholar]
- Kussell E, Leibler S (2005) Phenotypic diversity, population growth, and information in fluctuating environments. Science 309: 2075–2078 [DOI] [PubMed] [Google Scholar]
- Landry CR, Lemos B, Rifkin SA, Dickinson WJ, Hartl DL (2007) Genetic properties influencing the evolvability of gene expression. Science 317: 118–121 [DOI] [PubMed] [Google Scholar]
- Lee TI, Rinaldi NJ, Robert F, Odom DT, Bar-Joseph Z, Gerber GK, Hannett NM, Harbison CT, Thompson CM, Simon I, Zeitlinger J, Jennings EG, Murray HL, Gordon DB, Ren B, Wyrick JJ, Tagne JB, Volkert TL, Fraenkel E, Gifford DK et al. (2002) Transcriptional regulatory networks in Saccharomyces cerevisiae. Science 298: 799–804 [DOI] [PubMed] [Google Scholar]
- Levin BR (2004) Microbiology. Noninherited resistance to antibiotics. Science 305: 1578–1579 [DOI] [PubMed] [Google Scholar]
- Li Y, Zhang Y (2007) PhoU is a persistence switch involved in persister formation and tolerance to multiple antibiotics and stresses in Escherichia coli. Antimicrob Agents Chemother 51: 2092–2099 [DOI] [PMC free article] [PubMed] [Google Scholar]
- Lopez-Maury L, Marguerat S, Bahler J (2008) Tuning gene expression to changing environments: from rapid responses to evolutionary adaptation. Nat Rev Genet 9: 583–593 [DOI] [PubMed] [Google Scholar]
- Ma HW, Buer J, Zeng AP (2004a) Hierarchical structure and modules in the Escherichia coli transcriptional regulatory network revealed by a new top-down approach. BMC Bioinformatics 5: 199. [DOI] [PMC free article] [PubMed] [Google Scholar]
- Ma HW, Kumar B, Ditges U, Gunzer F, Buer J, Zeng AP (2004b) An extended transcriptional regulatory network of Escherichia coli and analysis of its hierarchical structure and network motifs. Nucleic Acids Res 32: 6643–6649 [DOI] [PMC free article] [PubMed] [Google Scholar]
- Maamar H, Raj A, Dubnau D (2007) Noise in gene expression determines cell fate in Bacillus subtilis. Science 317: 526–529 [DOI] [PMC free article] [PubMed] [Google Scholar]
- Man O, Pilpel Y (2007) Differential translation efficiency of orthologous genes is involved in phenotypic divergence of yeast species. Nat Genet 39: 415–421 [DOI] [PubMed] [Google Scholar]
- Maslov S, Sneppen K (2005) Computational architecture of the yeast regulatory network. Phys Biol 2: S94–100 [DOI] [PubMed] [Google Scholar]
- McAdams HH, Arkin A (1999) It′s a noisy business! Genetic regulation at the nanomolar scale. Trends Genet 15: 65–69 [DOI] [PubMed] [Google Scholar]
- Miller C, Thomsen LE, Gaggero C, Mosseri R, Ingmer H, Cohen SN (2004) SOS response induction by beta-lactams and bacterial defense against antibiotic lethality. Science 305: 1629–1631 [DOI] [PubMed] [Google Scholar]
- Nachman I, Regev A, Ramanathan S (2007) Dissecting timing variability in yeast meiosis. Cell 131: 544–556 [DOI] [PubMed] [Google Scholar]
- Newman JR, Ghaemmaghami S, Ihmels J, Breslow DK, Noble M, DeRisi JL, Weissman JS (2006) Single-cell proteomic analysis of S. cerevisiae reveals the architecture of biological noise. Nature 441: 840–846 [DOI] [PubMed] [Google Scholar]
- Paulsson J (2004) Summing up the noise in gene networks. Nature 427: 415–418 [DOI] [PubMed] [Google Scholar]
- Raj A, van Oudenaarden A (2008) Nature, nurture, or chance: stochastic gene expression and its consequences. Cell 135: 216–226 [DOI] [PMC free article] [PubMed] [Google Scholar]
- Ramsey SA, Smith JJ, Orrell D, Marelli M, Petersen TW, de Atauri P, Bolouri H, Aitchison JD (2006) Dual feedback loops in the GAL regulon suppress cellular heterogeneity in yeast. Nat Genet 38: 1082–1087 [DOI] [PubMed] [Google Scholar]
- Rao CV, Wolf DM, Arkin AP (2002) Control, exploitation and tolerance of intracellular noise. Nature 420: 231–237 [DOI] [PubMed] [Google Scholar]
- Raser JM, O'Shea EK (2004) Control of stochasticity in eukaryotic gene expression. Science 304: 1811–1814 [DOI] [PMC free article] [PubMed] [Google Scholar]
- Raser JM, O'Shea EK (2005) Noise in gene expression: origins, consequences, and control. Science 309: 2010–2013 [DOI] [PMC free article] [PubMed] [Google Scholar]
- Ratushny AV, Ramsey SA, Roda O, Wan Y, Smith JJ, Aitchison JD (2008) Control of transcriptional variability by overlapping feed-forward regulatory motifs. Biophys J 95: 3715–3723 [DOI] [PMC free article] [PubMed] [Google Scholar]
- Ravasz E, Somera AL, Mongru DA, Oltvai ZN, Barabasi AL (2002) Hierarchical organization of modularity in metabolic networks. Science 297: 1551–1555 [DOI] [PubMed] [Google Scholar]
- Sales-Pardo M, Guimera R, Moreira AA, Amaral LA (2007) Extracting the hierarchical organization of complex systems. Proc Natl Acad Sci USA 104: 15224–15229 [DOI] [PMC free article] [PubMed] [Google Scholar]
- Samoilov MS, Price G, Arkin AP (2006) From fluctuations to phenotypes: the physiology of noise. Sci STKE 2006: re17. [DOI] [PubMed] [Google Scholar]
- Shahrezaei V, Ollivier JF, Swain PS (2008a) Colored extrinsic fluctuations and stochastic gene expression. Mol Syst Biol 4: 196. [DOI] [PMC free article] [PubMed] [Google Scholar]
- Shahrezaei V, Swain PS (2008b) The stochastic nature of biochemical networks. Curr Opin Biotechnol 19: 369–374 [DOI] [PubMed] [Google Scholar]
- Silva J, Smith A (2008) Capturing pluripotency. Cell 132: 532–536 [DOI] [PMC free article] [PubMed] [Google Scholar]
- Silve S, Rhode PR, Coll B, Campbell J, Poyton RO (1992) ABF1 is a phosphoprotein and plays a role in carbon source control of COX6 transcription in Saccharomyces cerevisiae. Mol Cell Biol 12: 4197–4208 [DOI] [PMC free article] [PubMed] [Google Scholar]
- Spencer SL, Gaudet S, Albeck JG, Burke JM, Sorger PK (2009) Non-genetic origins of cell-to-cell variability in TRAIL-induced apoptosis. Nature 459: 428–432 [DOI] [PMC free article] [PubMed] [Google Scholar]
- Spudich JL, Koshland DE Jr (1976) Non-genetic individuality: chance in the single cell. Nature 262: 467–471 [DOI] [PubMed] [Google Scholar]
- Steinmetz LM, Scharfe C, Deutschbauer AM, Mokranjac D, Herman ZS, Jones T, Chu AM, Giaever G, Prokisch H, Oefner PJ, Davis RW (2002) Systematic screen for human disease genes in yeast. Nat Genet 31: 400–404 [DOI] [PubMed] [Google Scholar]
- Suel GM, Garcia-Ojalvo J, Liberman LM, Elowitz MB (2006) An excitable gene regulatory circuit induces transient cellular differentiation. Nature 440: 545–550 [DOI] [PubMed] [Google Scholar]
- Suel GM, Kulkarni RP, Dworkin J, Garcia-Ojalvo J, Elowitz MB (2007) Tunability and noise dependence in differentiation dynamics. Science 315: 1716–1719 [DOI] [PubMed] [Google Scholar]
- Svetlov VV, Cooper TG (1995) Review: compilation and characteristics of dedicated transcription factors in Saccharomyces cerevisiae. Yeast 11: 1439–1484 [DOI] [PubMed] [Google Scholar]
- Swain PS, Elowitz MB, Siggia ED (2002) Intrinsic and extrinsic contributions to stochasticity in gene expression. Proc Natl Acad Sci USA 99: 12795–12800 [DOI] [PMC free article] [PubMed] [Google Scholar]
- Takemoto K, Oosawa C (2007) Modeling for evolving biological networks with scale-free connectivity, hierarchical modularity, and disassortativity. Math Biosci 208: 454–468 [DOI] [PubMed] [Google Scholar]
- Tirosh I, Weinberger A, Carmi M, Barkai N (2006) A genetic signature of interspecies variations in gene expression. Nat Genet 38: 830–834 [DOI] [PubMed] [Google Scholar]
- Upton T, Wiltshire S, Francesconi S, Eisenberg S (1995) ABF1 Ser-720 is a predominant phosphorylation site for casein kinase II of Saccharomyces cerevisiae. J Biol Chem 270: 16153–16159 [DOI] [PubMed] [Google Scholar]
- Wang Y, Liu CL, Storey JD, Tibshirani RJ, Herschlag D, Brown PO (2002) Precision and functional specificity in mRNA decay. Proc Natl Acad Sci USA 99: 5860–5865 [DOI] [PMC free article] [PubMed] [Google Scholar]
- Wapinski I, Pfeffer A, Friedman N, Regev A (2007) Natural history and evolutionary principles of gene duplication in fungi. Nature 449: 54–61 [DOI] [PubMed] [Google Scholar]
- Yu H, Gerstein M (2006) Genomic analysis of the hierarchical structure of regulatory networks. Proc Natl Acad Sci USA 103: 14724–14731 [DOI] [PMC free article] [PubMed] [Google Scholar]
- Zhao J, Yu H, Luo JH, Cao ZW, Li YX (2006) Hierarchical modularity of nested bow-ties in metabolic networks. BMC Bioinformatics 7: 386. [DOI] [PMC free article] [PubMed] [Google Scholar]
Associated Data
This section collects any data citations, data availability statements, or supplementary materials included in this article.
Supplementary Materials
Supplementary text, Supplementary figures S1-5, Supplementary table S1
Data: Yeast regulatory network