

Abstract
We examined the effects of metallic silver particles on resonance energy transfer (RET) between fluorophores covalently bound to DNA. A coumarin donor and a Cy3 acceptor were positioned at opposite ends of a 23-bp double helical DNA oligomer. In the absence of silver particles the extent of RET is near 9%, consistent with a Forster distance R0 near 50 Å and a donor to acceptor distance near 75 Å. The transfer efficiency increased when the solution of AMCA-DNA-Cy3 was placed between two quartz plates coated with silver island films to near 64%, as determined by both steady-state and time-resolved measurements. The apparent R0 in the presence of silver island films increases to about 110 Å. These values of the transfer efficiency and R0 represent weighted averages for donor-acceptor pairs near and distant from the metallic surfaces, so that the values at an optimal distance are likely to be larger. The increased energy transfer is observed only between two sandwiched silvered slides. When we replaced one silvered slide with a quartz plate the effect vanished. Also, the increased energy transfer was not observed for silvered slides separated more than a few micrometers. These results suggest the use of metal-enhanced RET in PCR, hybridization, and other DNA assays, and the possibility of controlling energy transfer by the distance between silver surfaces.
Fluorescence resonance energy transfer (RET)3 is widely used in biochemistry [1–4] and in DNA biotechnology [5–7]. RET is a widely useful phenomenon because the Forster distance (R0) can be readily calculated from the spectral properties of the donor (D) and acceptor (A), and the extent of RET is insensitive to the sample conditions if the sample remains transparent. A disadvantage of RET is the limited distances over which RET occurs. The largest known Forster distances are near 55 Å for organic fluorophores and near 90 Å for lanthanide donors [8–10]. In the case of DNA a Forster distance of 50 Å corresponds to approximately 16 bp, so that RET only occurs when the donor and acceptor are closely spaced within the DNA helix. DNA assays based on RET over larger distances have not been developed because longer range RET does not occur.
In the present report we describe a new approach which promises to increase the Forster distances by several-fold. At present almost all fluorescent measurements are performed for fluorophores in the free-space conditions, meaning the surrounding medium is mostly homogeneous and transparent to the absorption and emission wavelengths. Under these conditions the observed far-field emission is well described by Maxwell’s equations for an oscillating dipole. However, the free-space conditions can be modified by the presence of a conducting metallic surface [11–13]. The interactions between fluorophores and metallic surfaces have been studied theoretically for over 20 years [14–17]. The effects on absorption and emission are the result of the incident light and the oscillating dipole interacting with the conducting metallic surface. With only a few recent exceptions [18–20] these interactions have not be utilized in applications of fluorescence to biochemistry or biotechnology.
In several recent reports we summarized the theoretical and experimental effects of fluorophore-metal interactions [21–23]. Proximity to a metallic surface or particle, which we will refer to as a metal, can result in increased intensities, increased quantum yields, decreased lifetimes and increased photostability. These effects are due to increases in the rates of excitation and to increases in the radiative decay rate of fluorophores near metals. It appears likely that proximity of fluorophores to metal particles can result in a dramatic increase in the number of photons which can be observed for a single fluorophore [22].
In the present report we describe the effects of metallic particles on RET between donors and acceptors covalently bound to DNA. Theoretical studies have predicted increased rates of energy transfer over distances as large as 700 Å near silver particles of appropriate size and shape [24,25]. To test this prediction we prepared a double helical DNA oligomer, 23 bp long, with a donor and acceptor placed at opposite sides about 75 Å apart. Because the R0 value is near 50 Å little energy transfer is expected under free-space conditions. We used steady-state and time-resolved fluorescence to determine the effects of silver island films on RET between the widely spaced donor-acceptor pairs.
Materials and methods
DNA oligomers
The structure and sequence of the labeled and unlabeled DNA oligomers are shown in Scheme 1. The donor- and acceptor-labeled 23-mers were obtained from Synthetic Genetics (San Diego, CA) and contained 7-amino-3-((((propyl)amino)carbonyl)methyl)-4-methyl-coumarin-6-sulfonic acid (AMCA) or N,N′-(dipropyl)tetramethylindocarbocyanine (Cy3) on the 5′ ends. Complementary unlabeled oligonucleotides were obtained from the Biopolymer Core Facility at the University of Maryland School of Medicine.
Scheme 1.

Chemical structures of the unlabeled and labeled oligonucleotides. The lower right shows a gel electrophoresis of single-stranded AMCA-DNA(A), single-stranded DNA-Cy3(B), and double-stranded AMCA-DNA-Cy3 (C).
The ds-DNA samples (AMCA-DNA, DNA-Cy3, AMCA-DNA-Cy3, and DNA, Scheme 1) were prepared by mixing the complementary oligonucleotides in 5 mM Hepes, pH 7.5, 0.2 M KCl, and 0.25 mM EDTA to a final concentration of 20 μM followed by heating to 70 °C for 2 min and by slow cooling. Concentrations were determined using ε(355nm) = 18,000M−1 cm−1 and ε(548nm) = 150,000M−1 cm−1 for AMCA and Cy3, respectively. The efficiency of hybridization was examined by gel electrophoresis using 20% polyacrylamide. We did not detect any single-stranded DNA labeled with either AMCA or Cy3 in a solution containing hybridized AMCA-DNA-Cy3 (Scheme 1, lower right).
The quantum yield of AMCA-DNA was found to be 0.49 using quinine sulfate in 0.1 M H2SO4 (Q = 0.577) as a reference. The quantum yield of DNA-Cy3 was found to be 0.24 using rhodamine B in water (Q = 0.48) as a reference. The R0 was calculated to be 49.6 Å. The donor appeared to have free mobility as judged by a steady-state anisotropy of 0.08 using 345 nm excitation and 450 nm emission.
Procedure for making silver nanoparticle films
Silver islands were formed on quartz microscope slides as described previously [23,26]. The quartz slides were first cleaned for 12 h in a 10:1 (v/v) mixture of H2SO4 (95–98%) and H2O2 (30%) then washed with distilled water. Silver deposition was carried out in a beaker with stirring. Eight drops of fresh 5% NaOH solution were added to a stirred silver nitrate solution (0.22 g in 26 ml of water). A dark-brownish precipitate formed immediately. Less than 1 ml of ammonium hydroxide was then added to redissolve the precipitate. The clear solution was cooled to 5 °C, followed by placing the quartz slides in this solution. At 5 °C, a fresh solution of D-glucose (0.35 g in 4 ml of water) was added. The mixture was stirred for 2 min. Subsequently, the beaker was removed from the ice bath and allowed to warm to 30 °C. The color of the mixture turned from yellow-greenish to yellow-brown, and the color of the slides became greenish, the slides were removed and washed with water and bath sonicated for 1 min at room temperature. After rinsing with water the slides were stored in water for several hours prior to the experiments.
Fluorescence measurements
Emission spectra were obtained using a SLM 8000 spectrofluorometer using 345 nm or 514 nm excitation. Intensity decays were measured in the frequency-domain (FD) using instrumentation described previously [27]. The excitation wavelength of 345 nm for AMCA was obtained from the frequency-doubled output of a pyridine 1 dye laser with a 10 ps or less pulse width, cavity dumped at ~3.8 MHz. Direct excitation of Cy3 was achieved with mode-locked argon ion laser, 514 nm, 76-MHz repetition rate, 100-ps pulse width. The AMCA emission was observed through a 450-nm interference filter, and the Cy3 emission was observed through a 570-nm-long pass filter. The frequency-domain intensity decay measurements were performed under magic-angle polarized conditions. We examined the signal as carefully as possible for the presence of scattered light. We scanned the emission spectra through the emission filters used for the FD measurements, starting at a wavelength 10 nm below the excitation wavelength, that is, 335 nm for AMCA and 504 nm for Cy3. In these spectra we did not observe significant scattered light.
The frequency domain (FD) intensity decay was analyzed in terms of the multi-exponential model
| (1) |
where τi are the lifetimes with amplitudes αi and Σαi = 1.0. Fitting to the multi-exponential model was performed as described previously [28]. The contribution of each component to the steady-state intensity is given by
| (2) |
The mean decay time is given by
| (3) |
The amplitude-weighted lifetime is given by
| (4) |
The rate of energy transfer for a donor (D) and acceptor (A) at a distance r is given by
| (5) |
where τ0 is the donor decay time in the absence of acceptor and R0 is the Forster distance. In the present experiment the labeled oligomers are present in an approximate 1-μm thick space between two silver island films (Fig. 1), and hence are present at a range of distances from the metallic particles. The experimental resolution is not adequate to recover the details of this spatial distribution and its effect on the Forster distance. Hence for analysis the donor decay in the presence of RET (IDA(t)) we assumed the presence of two populations of oligomers, those unaffected by the metal particles with a Forster distance of R01 and those strongly affected by the metal with R02. The intensity decay of the samples is then given by
Fig. 1.
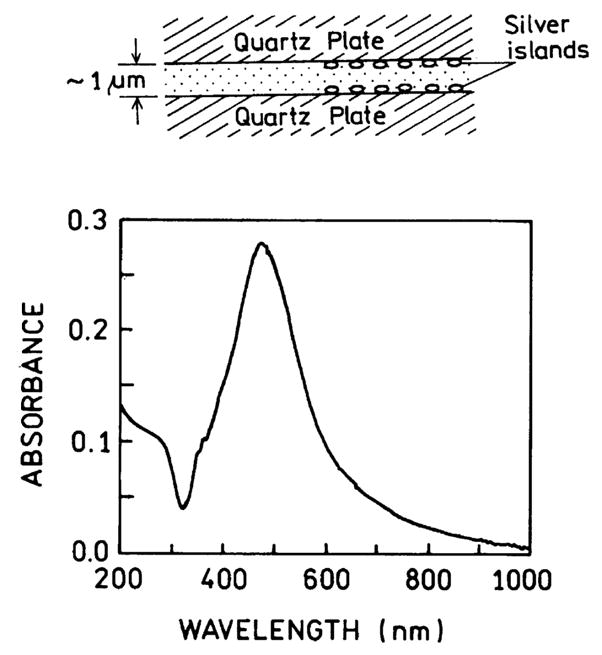
Absorption spectrum of two quartz plates with silver island films. The upper panel shows the experimental configuration.
| (6) |
where F1 and F2 are the steady-state intensities of each population, F1 + F2 = 1.0.
The intensity decays of the donors in the D-A oligomers were analyzed in terms of a distribution of D-to-A distances [29–31]. The distance distribution was assumed to be described by a Gaussian
| (7) |
where r̄ is the mean distance and the standard deviation σ is related to the full width at half-maximum by hw = 2.354σ. The half-width of the recovered distributions, in the absence of silver particles, reflects the flexibility of the donor and acceptor on the ends of the double helical oligomer. Additional details of the distance distribution analysis can be found in [31].
Results
Silver island films on quartz were prepared as described under Materials and methods. If the mass thickness of the deposited silver is low the silver layer is not continuous, but is instead made up of small islands. Such particles display a characteristic surface plasmon absorption (Fig. 1). AFM studies showed the mean particle size to range from 100 to 800 nm wide, and from 30 to 80 nm high (Fig. 2). However, we believe the larger particles are aggregates of smaller particles.
Fig. 2.

Typical AFM image of our silver island films.
Theoretical studies have predicted long-range RET to occur near donor and acceptors placed at optimal positions near silver particles with an optimal shape [24,25]. Prior to proceeding with this more complicated fabrication we decided to test whether useful increases in RET occurred near silver island films. The samples were placed between two silver island films (Fig. 1, top). Absorption measurement of dyes between the films indicated the thickness to be about 1 μm. Usefully large effects from such spatially heterogeneous samples would indicate that the effects of metallic particles can be used in applications even without optimization of the geometry. Additionally, observable effects in such samples would indicate that still larger effects could be obtained with more control of particle size and shape and location of the donors and acceptors.
RET efficiency in the DNA 23-mer
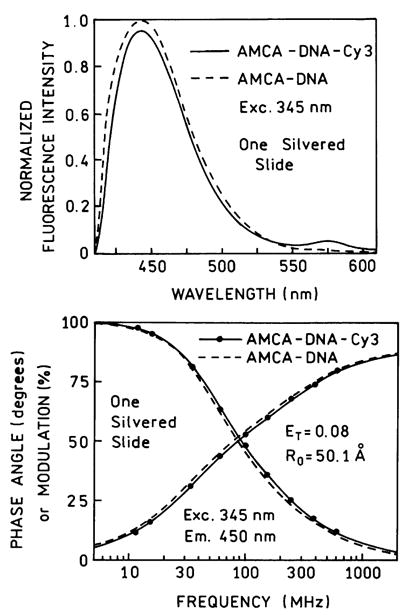
The oligomer length of 23 bp was chosen so there would be little energy transfer between AMCA and Cy3 under free-space conditions. Emission spectra of the donor strand AMCA-DNA and the donor-acceptor strand AMCA-DNA-Cy3 taken in a standard 1-cm2 cuvette are shown in Fig. 3, top. The emission from the donor is nearly unaffected by the presence of acceptor, and is decreased by about 2%. We also examined the intensity decay of the donor alone and the donor-acceptor pair (Fig. 3, bottom). The frequency response of the D-A pair is just slightly shifted to higher frequencies, which reflects a slightly shortened donor lifetime due to the acceptor. In the case of RET the efficiency of energy transfer can be calculated from the amplitude-weighted lifetimes [31]
Fig. 3.
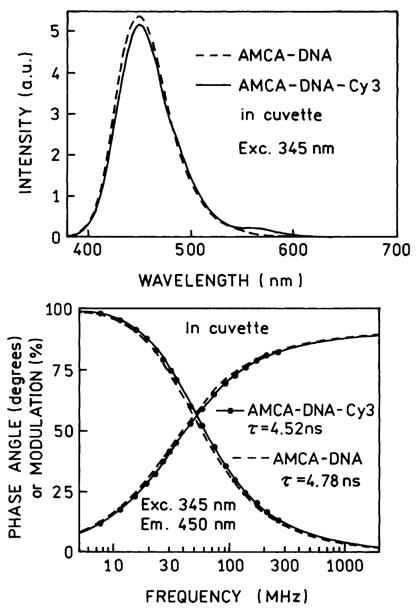
Top: Emission spectra of donor AMCA-DNA (– – –) and the donor-acceptor pair AMCA-DNA-Cy3 (———) in a 1-cm2 cuvette. Bottom: Frequency-domain intensity decays of the donor AMCA-DNA in the absence (– – –) and presence (———) of the Cy3 acceptor.
| (8) |
These values are given in Table 1. Hence the time-resolved donor decays also indicate a low transfer efficiency near 5.4%.
Table 1.
Multiexponential analysis of fluorescence intensity decays of AMCA-DNA (donor), Cy3-DNA (acceptor), and AMCA-DNA-Cy3 (donor-acceptor)
| Compound/condition | Excitation(nm) | Emission(nm) | τ̄ (ns) | 〈τ〉 (ns) | α1(f1) | τ1 (ns) | α2(f2) | τ2(ns) | α3(f3) | τ3(ns) | ||
|---|---|---|---|---|---|---|---|---|---|---|---|---|
| AMCA-DNA, cuvette | 345 | 450 | 4.78a | 4.78b | 1.0 | 4.78 | — | — | — | — | 1.7 | |
| AMCA-DNA-Cy3, cuvette | 345 | 450 | 4.52 | 4.52 | 1.0 | 4.52 | — | — | — | — | 1.9 | |
| Cy3-DNA, cuvette | 345 | >570 | 1.03 | 0.74 | 0.623 (0.318) | 0.91 | 0.377 (0.682) | 1.33 | — | — | 1.9 | |
| AMCA-DNA, quartz | 345 | 450 | 3.24 | 2.63 | 0.369 (0.136) | 0.97 | 0.631 (0.864) | 3.61 | — | — | 0.9 | |
| AMCA-DNA, two silver slides | 345 | 450 | 3.20 | 2.34 | 0.445 (0.137) | 0.72 | 0.555 (0.863) | 3.64 | — | — | 1.0 | |
| AMCA-DNA, one silver slide | 345 | 450 | 3.27 | 2.38 | 0.501 (0.192) | 0.91 | 0.499 (0.808) | 3.84 | — | — | 1.4 | |
| Cy3-DNA, quartz | 514 | >570 | 1.22 | 0.90 | 0.432 (0.139) | 0.29 | 0.568 (0.861) | 1.36 | — | — | 1.7 | |
| Cy3-DNA, two silver slides | 514 | >570 | 0.72 | 0.11 | 0.888 (0.310) | 0.04 | 0.078 (0.263) | 0.38 | 0.034 (0.427) | 1.41 | 0.9 | |
| AMCA-DNA-Cy3, quartz | 345 | 450 | 2.93 | 2.37 | 0.371 (0.136) | 0.87 | 0.629 (0.864) | 3.26 | — | — | 1.3 | |
| AMCA-DNA-Cy3, two silver slides | 345 | 450 | 2.12 | 0.66 | 0.580 (0.148) | 0.17 | 0.309 (0.290) | 0.63 | 0.111 (0.562) | 3.40 | 1.4 | |
| AMCA-DNA-Cy3, one silver slide | 345 | 450 | 3.01 | 2.29 | 0.504 (0.200) | 0.87 | 0.496 (0.800) | 3.54 | — | — | 0.9 | |
| AMCA-DNA-Cy3, quartz | 514 | >570 | 1.25 | 1.03 | 0.272 (0.069) | 0.26 | 0.728 (0.931) | 1.32 | — | — | 1.8 | |
| AMCA-DNA-Cy3, two silver slides | 514 | >570 | 0.93 | 0.07 | 0.948 (0.301) | 0.02 | 0.030 (0.159) | 0.329 | 0.022 (0.540) | 1.56 | 1.1 | |
| AMCA-DNA-Cy3, two silver slides | 345 | >570 | 1.50 | 0.55 | 0.578 (0.072) | 0.07 | 0.296 (0.407) | 0.76 | 0.125 (0.521) | 2.30 | 2.2 |
, .
.
Effect of silver island films on the donor-alone- and acceptor-alone-labeled oligomers
It is known that silver island films can affect the apparent quantum yields and lifetimes of fluorophores even in the absence of energy transfer. More specifically, proximity to silver island films can result in increased excitation due to an enhancement of the incident light field by the metal particles [17]. Additional effects include increases in the radiative decay rate and decreases in lifetime. Hence we examined the donor-labeled and acceptor-labeled oligomers separately, in the absence of RET, to determine the effects of the silver particles.
Fig. 4 top shows the emission spectra of AMCA-DNA between uncoated quartz plates and between silver island films. Fig. 4 bottom shows the emission spectra of the donor-acceptor pair AMCA-DNA-Cy3 with no excitation of the donor and direct excitation of the acceptor at 514 nm. The intensity of the donor-alone AMCA-DNA was essentially unchanged by the silver particles. In contrast the intensity of DNA-Cy3 were increased several-fold (Fig. 4). The different effects are consistent with the effects expected for high and low quantum yield fluorophores. It is not possible to increase a quantum yield above unity, and the larger increases in quantum yield are obtained for lower quantum yield fluorophores [17,21,23].
Fig. 4.
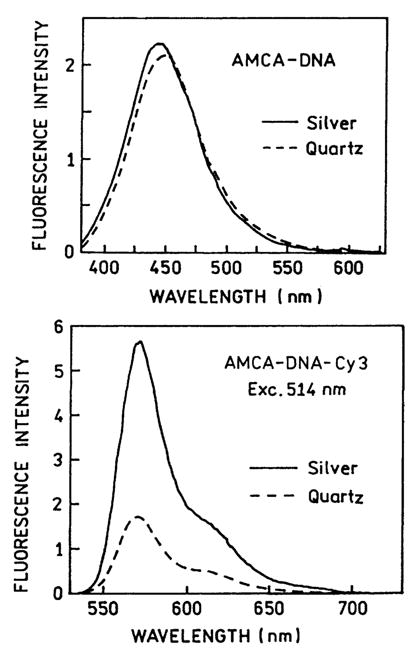
Top: Emission spectra of the donor AMCA-DNA between quartz plates (– – –) and between silver island films (———). Bottom: Emission spectra of the directly excited acceptor in AMCA-DNA-Cy3 between quartz plates (– – –) and between silver island films (———).
In interpreting the spectra in Fig. 4, it is important to remember the spatial distribution of fluorophores at various distances from the silver particles. The effects of these particles is thought to extend about 200 Å from ellipsoidal colloids [14], which means only about 4% of our 1-μm thick samples would be within the active volume. We believe the active volume is larger than 4%, but we are currently unable to precisely define this percentage. In any event the increased intensity seen for DNA-Cy3 in our micrometer-thick sample is likely to be smaller than the effect on those molecules in close proximity to the silver.
Frequency-domain intensity decays of the donor-alone AMCA-DNA is shown in Fig. 5. The donor-alone decay was essentially unchanged between quartz plates and silver films. This is the expected result since AMCA-DNA has a high quantum yield and the observed emission is due to the entire thickness of the sample. In the case of the donor-acceptor pair AMCA-DNA-Cy3 the directly excited (514 nm) intensity decay of the acceptor is dramatically shortened (Fig. 6). We believe the large effect on Cy3 is due to its increased quantum yield near the particles, which would weight the intensity decay more heavily by the emission from acceptors near the silver particles. The mean lifetime τ̄ of the acceptor is decreased from 1.25 to 0.93 ns by the particles, and the amplitude-weighted lifetime is dramatically decreased from 1.03 to 0.07 ns by the particles. These decreases are due to a fast 40 ps component in the Cy3 intensity decay which we believe is due to Cy3 molecules close to the silver particles.
Fig. 5.
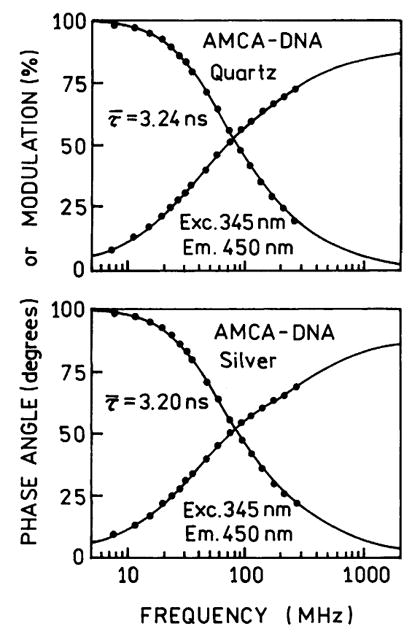
Frequency-domain intensity decays of the AMCA-DNA donor between quartz plates (top) and between silver island films (bottom).
Fig. 6.
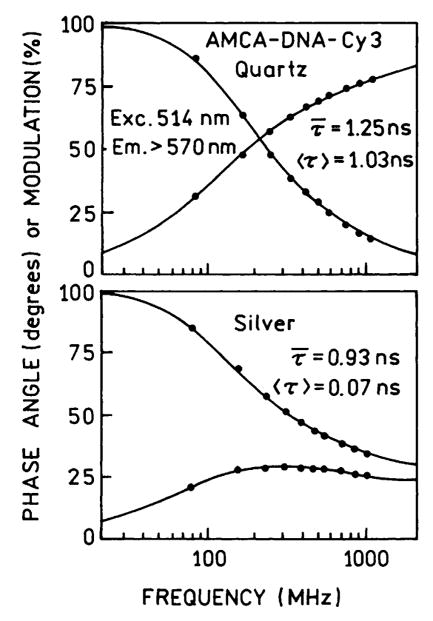
Frequency-domain intensity decays of the directly excited Cy3 acceptor in AMCA-DNA-Cy3 between quartz plates (top) and between silver island films (bottom).
Effects of silver particles on resonance energy transfer
We examined the emission spectra of the donor- and acceptor-labeled DNA between quartz plates and silver island films (Fig. 7). An increase in the acceptor emission is seen in the donor-normalized spectra (Fig. 7, bottom). It is difficult to judge the extent to which the increased acceptor emission is due to increased energy transfer or due to the increase intensity of Cy3 shown in Fig. 4. Nonetheless, it was clear that much of the Cy3 emission from AMCA-DNA-Cy3 between the silver islands is due to RET. This was shown by measuring the Cy3 acceptor decay when the sample was excited at the acceptor absorption (514 nm) and at the donor absorption maxima (345 nm). For excitation at 514 nm the acceptor decay is short lived (Fig. 8, top). The mean decay time is considerably longer when excited at the donor wavelength (Fig. 8, bottom). In fact, the frequency response is qualitatively similar to that of the AMCA donor (Fig. 6, top). This result demonstrates that a substantial fraction of the emission at 575 nm for AMCA-DNA-Cy3 between silver islands (Fig. 7) is due to RET from AMCA to Cy3. In principle the energy transfer efficiency can be estimated from the emission spectra of the donor and the donor-acceptor pair (Fig. 7). However, this requires a direct comparison of the intensities of two different sandwich samples in the front face geometry, which is difficult with these samples.
Fig. 7.

Emission spectra of AMCA-DNA donor and AMCA-DNA-Cy3 the donor-acceptor pair on quartz (top) and silver (middle). The bottom panel shows normalized emission spectra of AMCA-DNA-Cy3 donor acceptor between quartz (– – –) and between silver island films (———).
Fig. 8.
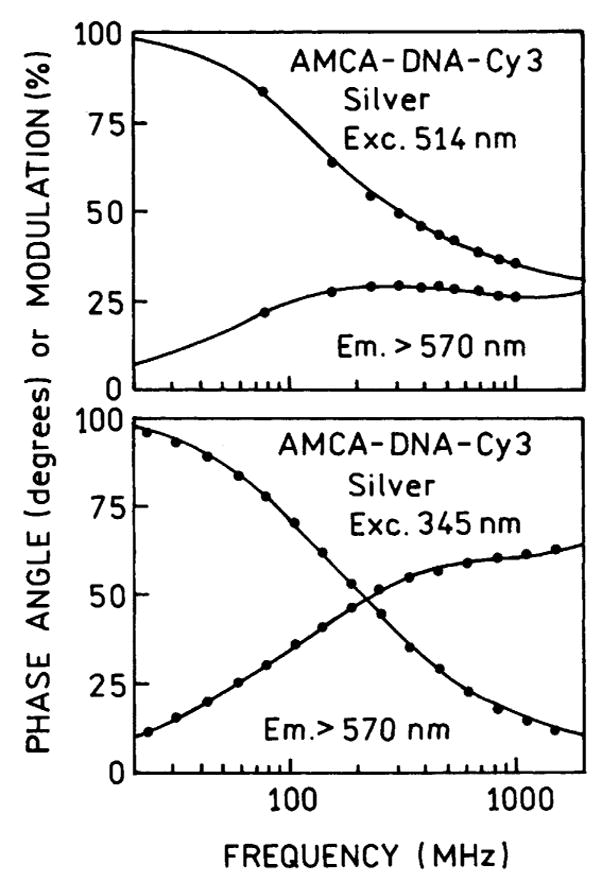
Frequency-domain intensity decays of Cy3 in AMCA-DNA-Cy3 for excitation at 514 nm (top) and 345 nm (bottom).
Intensity decay measurements provide less ambiguous information on energy transfer because the recovered lifetimes are mostly independent of intensity and geometry of the sample. Fig. 9 shows the intensity decay of the donor decay in AMCA-DNA-Cy3. When this donor-acceptor pair was placed between uncoated quartz plates the acceptor had minimal effect on the donor decay. We used these data to obtain an effective value of the Forster distance R0 for the molecular structure (Scheme 1). We calculated the distance between AMCA and Cy3 to be 76.1 Å. We analyzed the donor decay of AMCA-DNA-Cy3 holding this distance as a fixed value (Table 2). Essentially the same value of the goodness-of-fit parameter was obtained if the half-width of the distribution was 0 or 8 Å. This analysis yields an effective value of R0 = 52 Å for the oligomer.
Fig. 9.
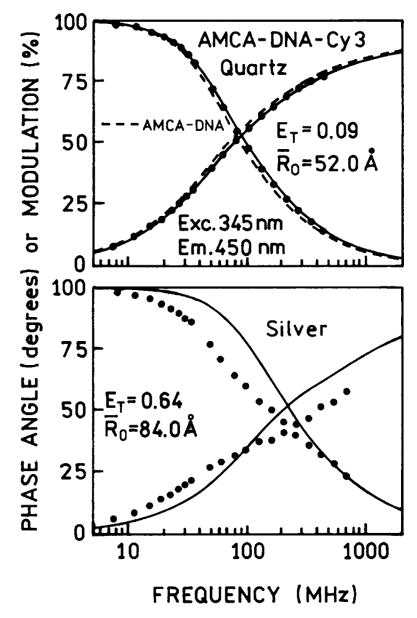
Frequency-domain intensity decays of the donor-acceptor pair AMCA-DNA-Cy3 between quartz plates (top) and between silver island films (bottom). The dashed line (top) shows the intensity decay for the donor alone AMCA-DNA between quartz plates. The solid line (lower panel) shows the best fit of the frequency response of the donor-acceptor pair to a single R0 value.
Table 2.
Energy transfer analysis for AMCA-DNA-Cy3 donor-acceptor DNA
| 1 R0 model |
2 R0 model |
|||||||||||
|---|---|---|---|---|---|---|---|---|---|---|---|---|
| R0 (Å) | r̄ (Å) | hw (Å) | R01 (Å) | R02 (Å) | r̄ (Å) | hw (Å) | F1a | |||||
| Cuvette | 〈46:9〉b | 76.1 | 〈8〉 | 1.7 | ||||||||
| Cuvette | 〈46:9〉 | 75.6 | 〈0〉 | 1.9 | ||||||||
| Quartz | 52.1 | 〈76:1〉 | 〈8〉 | 1.2 | ||||||||
| Quartz | 52.0 | 〈75:6〉 | 〈0〉 | 1.2 | ||||||||
| Two silver slides | 84.0 | 〈76:1〉 | 〈8〉 | 431.6 | 53.9 | 110.6 | 〈76:1〉 | 〈8〉 | 0.70 | 2.4 | ||
| Two silver slides | 83.1 | 〈75:6〉 | 〈0〉 | 456.4 | 54.8 | 109.7 | 〈75:6〉 | 〈0〉 | 0.70 | 3.1 | ||
| One silver slide | 50.1 | 〈76:1〉 | 〈8〉 | 1.1 | ||||||||
| One silver slide | 50.0 | 〈75:6〉 | 〈0〉 | 1.1 | ||||||||
F2 = 1 − F1.
The values in 〈 〉 were held constant during analysis.
The lower panel of Fig. 9 shows the donor decay for AMCA-DNA-Cy3 between the silver island films. The donor intensity decay is considerably more rapid between the silver particles. Integration of the donor decays indicates that the transfer efficiency has increased to 64%, and use of Eq. (8) yields a transfer efficiency of 72%. However, these are only an apparent efficiencies because the donor decay became strongly heterogeneous in the presence of the silver islands. The poor single R0 fit (Fig. 9, bottom, ———) and the data (• • •) indicate that there exists either a wider distribution of D-to-A distances or a range of R0 values in the presence of silver island films.
We analyzed the donor decay of AMCA-DNA-Cy3 in terms of two R0 values (Fig. 10). This analysis resulted in a good fit to the data. One R0 value was comparable to that found in the absence of silver particles. The second R0 value of 111 Å was more than twofold larger. We assign this Forster distance of 111 Å to an apparent value for those D-A pairs which are near the silver islands. The analysis indicates that the fraction with this R0 value contributes about 30% of the total donor emission. It is probably that the larger R0 value is a lower limit to that which could be obtained for more optimally localized D-A pairs and/or more optimal silver particle shapes. This value of 30% of the sample is roughly consistent with the calculated transfer efficiency near 0.70. This can be seen by recognizing that 30% of the sample displays a transfer efficiency near 1.0, and 70% of the sample a transfer efficiency near 5%.
Fig. 10.
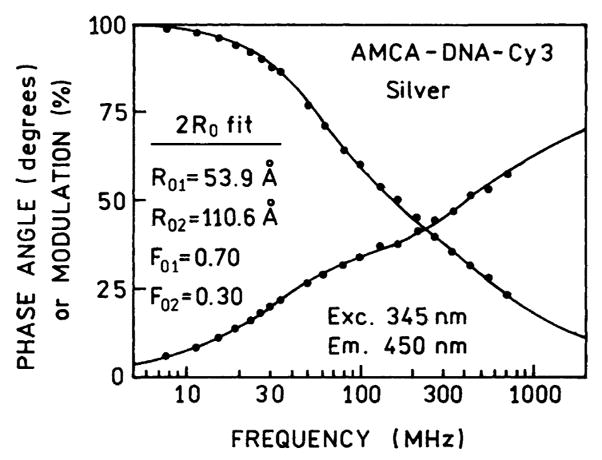
Frequency response of the donor-acceptor pair AMCA-DNA-Cy3 in terms of two values of the Forster distance (R01 and R02).
The 30% fraction of the strongly affected donor-acceptor pairs is in disagreement with the estimated 4% volume of the sample which is close to this silver particles. To clarify this discrepancy we repeated our experiments with a different sample geometry, using one SIF instead of two SIFs. That is, one side of the sandwich was a SIF and the other an unsilvered quartz plate. This was accomplished by coating different slides with 1/3 or 2/3 of the area with silver, so that there were regions of the sample between two quartz plates, between one quartz and one SIF, or between two silver island films (Fig. 11, top). When there was only 1 SIF we found no increase in energy transfer (Fig. 11) and no decrease in the donor lifetime (Table 1). In fact, there appeared to be less energy transfer with one silver plate then with two quartz plates (see Fig. 12). Furthermore, we did not observe increased energy transfer when two SIFs were separated by over 15 μm, which was obtained using a Teflon spacer.
Fig. 11.
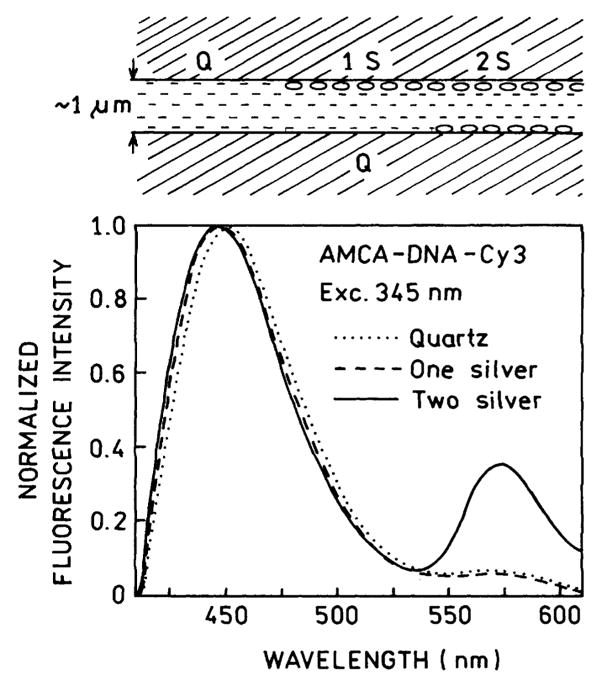
Normalized emission spectra of AMCA-DNA-Cy3 recorded on quartz (Q), one silvered slide (1 S) and two silvered slides (2 S).
Fig. 12.
Top: Emission spectra of AMCA-DNA donor and AMCA-DNA-Cy3 donor acceptor between one silvered slide and one unsilvered slide (1 S). Bottom: Energy transfer fit to the frequency response of the donor-acceptor between one silvered and one unsilvered slide (—•—). The dashed line (– – –) is for the donor alone.
The observation of increased energy transfer between two SIFs, and no change or less energy transfer near one SIF, suggests a role of microcavities in enhancing energy transfer. Increased energy transfer has been predicted theoretically in microcavities [32–35]. We believe the increase in energy transfer we observed between two SIFs is due to a system of microcavities created by the two closely spaced SIFs.
One can ask how many molecules bind to the quartz and silver island film surfaces, and how a close proximity to the islands affects energy transfer. We covered the slides with AMCA-DNA-Cy3 solution for 24 h followed by extensive washing with the buffer. The sample showed about 15% of the original signal. This emission on silver island film showed no enhancement in energy transfer efficiency. In summary, the close proximity of molecules to silver island film does not enhanced energy transfer efficiency. The increase of energy transfer is induced by a second silvered surface spaced by a micrometer/submicrometer distance.
Discussion
What opportunities are available from long-range resonance energy transfer? It is difficult to anticipate the future uses because all present RET assays have been designed to position the donors and acceptors within the upper range of Forster distances near 50 Å. One possibility for metal-enhanced RET is detection of target sequences with larger numbers of base pairs (Scheme 2). Shorter D-A distances can be detected between quartz and larger distances between two silvered plates. One can also image the use of induced long-range RET for analysis of chromosomes with fluorescence in situ hybridization (FISH). As currently performed the emission spectra of the FISH samples reflects the location of specific sequences, and RET does not normally occur between the labeled oligonucleotides used in these hybridizations. This situation may change for labeled chromosomes, especially if placing solution in microcavity system results in RET over hundreds of angstroms.
Scheme 2.
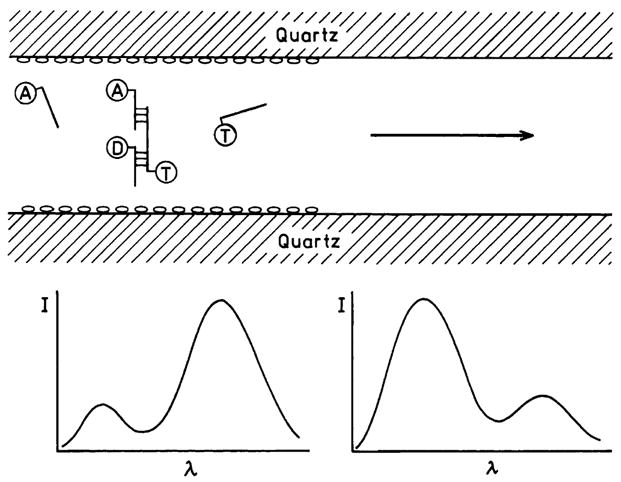
Detection of DNA sequences using long-range RET on a silver particle surface. D, A, and T are the donor, acceptor, and target nucleotides, respectively.
We believe that the microcavity system created by two silver island films gives a unique opportunity for the control and manipulation of energy transfer. One can imagine an experimental system with precise motion control. The nanometer changes in silvered plates distance can be achieved with piezo drivers. Such nano-mechanical control of energy transfer can be used to adjust the R0 value to the studied system.
Acknowledgments
This work was supported by NIH National Center for Research Resources, RR-08119. We thank Dr. Badri P. Maliwal for his help in suggesting the DNA sequence and preparation of samples.
Footnotes
Abbreviations used: A, acceptor; AMCA, 7-amino-3-((((propyl)amino)carbonyl)methyl)-4-methylcoumarin-6-sulfonic acid; Cy3, N,N′-(dipropyl)tetramethylindocarbocyanine; D, donor; FD, frequency domain; FISH, in situ hybridization; PCR, polymerase chain reaction; RET, resonance energy transfer; SIF(s), silver island film(s).
References
- 1.Wu P, Brand L. Review-resonance energy transfer. Methods and applications. Anal Biochem. 1994;218:1–13. doi: 10.1006/abio.1994.1134. [DOI] [PubMed] [Google Scholar]
- 2.Dos Remedios CG, Moens PDJ. Fluorescence resonance energy transfer spectroscopy is a reliable “ruler” for measuring structural changes in proteins. J Struct Biol. 1995;115:175–185. doi: 10.1006/jsbi.1995.1042. [DOI] [PubMed] [Google Scholar]
- 3.Lilley DMJ, Wilson TJ. Fluorescence resonance energy transfer as a structural tool for nucleic acids. Curr Opin Chem Biol. 2000;4:507–517. doi: 10.1016/s1367-5931(00)00124-1. [DOI] [PubMed] [Google Scholar]
- 4.Walter F, Murchie AIH, Duckett D, Lilley DMJ. Global structure of four-way RNA junctions studied using fluorescence resonance energy transfer. RNA. 1998;4:719–728. doi: 10.1017/s135583829898030x. [DOI] [PMC free article] [PubMed] [Google Scholar]
- 5.Mitsui T, Nakano H, Yamana K. Coumarin-fluorescein pair as a new donor-acceptor set for fluorescence energy transfer study of DNA. Tetrahedron Lett. 2000;41:2605–2608. [Google Scholar]
- 6.Norman DG, Grainger RJ, Uhrin D, Lilley DMJ. Location of cyanine-3 on double-stranded DNA: Importance for fluorescence resonance energy transfer studies. Biochemistry. 2000;39:6317–6324. doi: 10.1021/bi992944a. [DOI] [PubMed] [Google Scholar]
- 7.Sueda S, Yuan J, Matsumoto K. Homogenous DNA hybridization assay by using europium luminescence energy transfer. Bioconj Chem. 2000;11:827–831. doi: 10.1021/bc000030r. [DOI] [PubMed] [Google Scholar]
- 8.Selvin PR, Rana TM, Hearst JE. Luminescence resonance energy transfer. J Am Chem Soc. 1994;116:6029–6030. [Google Scholar]
- 9.Selvin PR. Lanthanide-based resonance energy transfer. IEEE J Selected Topics Quantum Electron. 1996;2(4):1077–1087. [Google Scholar]
- 10.Mathis G. Rare earth cryptates and homogenous fluoroimmunoassays with human sera. Clin Chem. 1993;39:1953–1959. [PubMed] [Google Scholar]
- 11.Drexhage KH. Interaction of light with monomolecular dye lasers. In: Wolf E, editor. Progress in Optics XII. Chapter IV North-Holland: Amsterdam; 1974. pp. 161–232. [Google Scholar]
- 12.Hinds EA. Cavity quantum electrodynamics. Adv Atom Mol Opt Phys. 1991;28:237–289. [Google Scholar]
- 13.Chance RR, Prock A, Silbey R. Molecular fluorescence and energy transfer near interfaces. Adv Chem Phys. 1978;37:1–65. [Google Scholar]
- 14.Gersten J, Nitzan A. Spectroscopic properties of molecules interacting with small dielectric particles. J Chem Phys. 1981;75(3):1139–1152. [Google Scholar]
- 15.Chew H. Transition rates of atoms near spherical surfaces. J Chem Phys. 1987;87(2):1355–1360. [Google Scholar]
- 16.Weitz DA, Garoff S. The enhancement of Raman scattering, resonance Raman scattering, and fluorescence from molecules adsorbed on a rough silver surface. J Chem Phys. 1983;78:5324–5338. [Google Scholar]
- 17.Kümmerlen J, Leitner A, Brunner H, Aussenegg FR, Wokaun A. Enhanced dye fluorescence over silver island films: Analysis of the distance dependence. Mol Phys. 1993;80(5):1031–1046. [Google Scholar]
- 18.Shalkhammer T, Aussenegg FR, Leitner A, Brunner H, Hawa G, Lobmaier C, Pittner F. Detection of fluorophore-labeled antibodies by surface-enhanced fluorescence on metal nanoislands. SPIE. 1997;2976:129–136. [Google Scholar]
- 19.Mayer C, Stich N, Schalkhammer TGM. Surface-enhanced fluorescence biochips using industrial standard slide format and scanners. SPIE. 2001;4252:37–46. [Google Scholar]
- 20.Lobmaier Ch, Hawa G, Gotzinger M, Wirth M, Pittner F, Gabor F. Direct monitoring of molecular recognition processes using fluorescence enhancement at colloid-coated microplates. J Mol Recogn. 2001;14:215–222. doi: 10.1002/jmr.536. [DOI] [PubMed] [Google Scholar]
- 21.Lakowicz JR. Radiative decay engineering: Biophysical and biomedical applications. Anal Biochem. 2001;298:1–24. doi: 10.1006/abio.2001.5377. [DOI] [PMC free article] [PubMed] [Google Scholar]
- 22.Lakowicz JR, Gryczynski I, Shen Y, Malicka J, Gryczynski Z. Intensified fluorescence. Photon Spectra. 2001:96–104. [Google Scholar]
- 23.Lakowicz JR, Shen Y, D’Auria S, Malicka J, Gryczynski Z, Gryczynski I. Radiative decay engineering. 2. Effects of silver island films on fluorescence intensity, lifetimes and resonance energy transfer. Anal Biochem. 2002;301:261–277. doi: 10.1006/abio.2001.5503. [DOI] [PMC free article] [PubMed] [Google Scholar]
- 24.Hua XM, Gersten JI, Nitzan A. Theory of energy transfer between molecules near solid state particles. J Chem Phys. 1985;83:3650–3659. [Google Scholar]
- 25.Gersten JI, Nitzan A. Accelerated energy transfer between molecules near a solid particle. Chem Phys Lett. 1984;104(1):31–37. [Google Scholar]
- 26.Ni F, Cotton TM. Chemical procedure for preparing surface-enhanced Raman scattering active silver films. Anal Chem. 1986;58:3159–3163. doi: 10.1021/ac00127a053. [DOI] [PubMed] [Google Scholar]
- 27.Laczko G, Gryczynski I, Gryczynski Z, Wiczk W, Malak H, Lakowicz JR. A 10-GHz frequency-domain fluorometer. Rev Sci Instrum. 1990;61:2331–2337. [Google Scholar]
- 28.Lakowicz JR, Laczko G, Cherek H, Gratton E, Limkeman M. Analysis of fluorescence decay kinetics from variable-frequency phase shift and modulation data. Biophys J. 1994;46:463–477. doi: 10.1016/S0006-3495(84)84043-6. [DOI] [PMC free article] [PubMed] [Google Scholar]
- 29.Grinvald A, Haas E, Steinberg IA. Evaluation of the distribution of distances between energy transfer donors and acceptors by fluorescence decay. Proc Natl Acad Sci USA. 1972;69:2273–2277. doi: 10.1073/pnas.69.8.2273. [DOI] [PMC free article] [PubMed] [Google Scholar]
- 30.Cheung HC, Wang CK, Gryczynski I, Wiczk W, Laczko G, Johnson ML, Lakowicz JR. Distance distributions and anisotropy decays of troponin C and its complex with troponin 1. Biochemistry. 1991;30:5238–5247. doi: 10.1021/bi00235a018. [DOI] [PMC free article] [PubMed] [Google Scholar]
- 31.Cheung HC. Resonance energy transfer. In: Lakowicz JR, editor. Topics in Fluorescence Spectroscopy. Vol. 2. Principles, Plenum; New York: 1991. pp. 127–176. [Google Scholar]
- 32.Andrew P, Barnes WL. Forster energy transfer in an optical microcavity. Science. 2000;290:785–788. doi: 10.1126/science.290.5492.785. [DOI] [PubMed] [Google Scholar]
- 33.Kobayashi T, Zheng Q, Sekiguchi T. Resonant dipole-dipole interaction in a cavity. Phys Rev A. 1995;52:2835–2846. doi: 10.1103/physreva.52.2835. [DOI] [PubMed] [Google Scholar]
- 34.Kurizki G, Kofman AG, Yudson V. Resonant photon exchange by atom pairs in high-Q cavities. Phys Rev A. 1996;53:R35–R38. doi: 10.1103/physreva.53.r35. [DOI] [PubMed] [Google Scholar]
- 35.Agarwal GS, Gupta SD. Microcavity-induced modification of the dipole-dipole interaction. Phys Rev A. 1998;57:667–670. [Google Scholar]