

Abstract
This study investigated contributions from the retinal On and Off pathways, and the spiking and nonspiking activity of neurons in those pathways to the pattern ERG of the mouse. Light-adapted pattern and ganzfeld ERGs were recorded from anesthetized C57BL/6 mice 3-4 months of age. Recordings were made before and after intravitreal injections of PDA (cis-2, 3-piperidine-dicarboxylic acid) to block transmission to hyperpolarizing 2nd order and all 3rd order neurons, TTX (tetrodotoxin) to block Na+-dependent spiking, APB (2-amino-4-phosphonobutyric acid) to block synapses between photoreceptors and ON-bipolar cells, and APB+TTX and PDA+TTX cocktails. The pattern stimuli consisted of 0.05 cy/deg gratings reversing in contrast at 1 Hz, presented at various contrasts (50-90%) and a rod saturating mean luminance. For flash ERGs, brief green ganzfeld flashes were presented on a rod suppressing green background. Recordings were made 39-42 days after unilateral optic nerve crush (ONC) in a subset of animals in which ganglion cell degeneration was subsequently confirmed in retinal sections. Pattern ERGs were similar in waveform for all contrasts, with a positive wave (P1) peak for 90% contrast around 60 ms on average and maximum trough for a negative wave (N2) around 132 ms after each contrast reversal; amplitudes were greatest for 90% contrast which became the standard stimulus. ONC eliminated or nearly eliminated the pattern ERG but did not affect the major waves of the flash ERG. PDA and TTX both delayed P1 and N2 waves of the pattern ERG, and reduced their amplitudes, with effects of PDA on N2 greater than those of TTX. In the flash ERG, PDA reduced a-wave amplitudes, removed OPs but hardly affected b-wave amplitudes. In contrast, TTX reduced b-wave amplitudes substantially, as previously observed in rat. APB removed P1 of the pattern ERG, but left a negative wave of similar timing and amplitude to N2. In the flash ERG, APB removed the b-wave, producing a negative ERG. Addition of TTX to the APB injection removed most of N2 of the pattern ERG, while other waves of the pattern and flash ERG resembled those after APB alone. Addition of TTX to the PDA injection had little effect on the pattern ERG beyond that of PDA alone, but it prolonged the b-wave of the flash ERG. In conclusion, this study confirmed that a selective lesion of ganglion cells will practically eliminate the pattern ERG. The study also showed that P1 of the mouse pattern ERG is dominated by contributions, mainly spiking, from ON pathway neurons, whereas N2 reflects substantial spiking activity from the OFF pathway as well as non spiking contributions from both pathways.
INTRODUCTION
The pattern electroretinogram (ERG), first described by Riggs et al (Riggs et al., 1964), is commonly recorded noninvasively at the cornea as the voltage change that occurs in response to each reversal of the contrast of a checkerboard or grating pattern under light-adapted conditions. For such a stimulus, changes in local luminance occur when the pattern reverses, but the average luminance remains constant. This causes the linear signals that produce the ERG a- and b-waves to cancel, leaving only the nonlinear signals in the response. The nonlinear signals that compose the pattern ERG are known to depend upon the functional integrity of retinal ganglion cells (Bach and Hoffman, 2006 for review). Studies in several mammal have shown that the pattern ERG is eliminated, while the a- and b-waves of the flash ERG from more distal retina are still present, following optic nerve section or crush that causes the retinal ganglion axons and subsequently their cell bodies to degenerate. These studies were initially done in cats (Maffei and Fiorentini, 1982), but similar results were subsequently obtained in monkeys (Maffei et al., 1985), rats (Berardi et al., 1990) and mice (Porciatti et al., 1996). In a human individual (Harrison et al., 1987), accidental optic nerve transection also was found to eliminate the pattern ERG.
The pattern ERG has been used widely in the clinic and in clinical research for assessing retinal ganglion cell function in eyes with glaucoma and other diseases that affect the inner retina, for review see: (Bach and Hoffmann, 2008; Holder, 2001). In humans, the pattern ERG has potential for detecting early dysfunction of retinal ganglion cells caused by ocular hypertension (Aldebasi et al., 2004; Arai et al., 1993; Bach et al., 2006; Pfeiffer et al., 1993), and early glaucoma when visual field deficits are minimal (Bach et al., 1988; Hood et al., 2005; Ventura et al., 2005).
There is increasing evidence that the pattern ERG is a useful tool for monitoring functional effects of glaucomatous neuropathy in moue models of glaucoma. The DBA/2J mouse is a model of inherited glaucoma that progresses from normal ganglion cell numbers at two months of age to massive retinal ganglion cell degeneration by 12-14 months (Anderson et al., 2002; Jakobs et al., 2005; John et al., 1998). The pattern ERG in young DBA/2J mice is of normal amplitude, whereas it is practically eliminated in the older mice while the light-adapted flash ERG amplitude is reduced to a lesser extent (Porciatti et al., 2007).
Pattern ERGs can be recorded as transient responses to low reversal frequencies, i.e, 1 to 2 Hz, or as steady state responses to higher frequencies, e.g. 8 Hz. The transient pattern ERG has an early positive and a later negative component named respectively P50 and N95 in humans to denote the time in milliseconds that the peak and trough occur following a pattern reversal (Holder et al., 2007). Both waves of the transient pattern ERG in humans reflect ganglion cell activity, although P50 may include other signals (see Holder, 2001). Recent studies of DBA/2J mice have used the transient pattern ERG, a robust signal in healthy eyes with an early positive (P1) and later negative (N2) component, different in exact time of occurrence, but similar in general appearance to the P50 and N95 components in the humans (Porciatti, 2007 for review).
Given the importance of the mouse model for studies of retina, the diseases that affect it, and developing treatments for those diseases (Chang et al., 2005; Peachey and Ball, 2003), a good understanding of the origins of ERG waves is useful. Although a ganglion cell origin is known for the pattern ERG, the contribution of the ON and OFF retinal pathways feeding signals to the ganglion cells, and the role of spiking activity remains to be established. . The retinal OFF pathway hardly contributes to the light-adapted flash ERG in mice and rats (Shirato et al., 2008; Xu et al., 2003) whereas it does to a great extent in primates, e.g. (Sieving et al., 1994), making the presence of this pathway's signals in the pattern ERG of particular interest.
Elimination of Na+-dependent spiking activity has been shown to reduce the pattern ERG in several species, but not to completely eliminate it (Ben-Shlomo et al., 2005; Trimarchi et al., 1990; Viswanathan et al., 2000). It is well-established that essentially all retinal ganglion cells, and some amacrine cells in mammals express voltage-gated Na+ channels that produce action potentials. However, there are recent reports of TTX-sensitive voltage-gated Na+ channels in certain cone bipolar cells in rats as well, blockade of which reduces inward Na+ currents and spiking (Cui and Pan, 2008; Ma et al., 2005; Pan and Hu, 2000), and can reduce the light-adapted b-wave (Bui and Fortune, 2004; Mojumder et al., 2007; Mojumder et al., 2008). This raises the possibility of multiple retinal loci for the effects of TTX in the mouse as well.
The purpose of the present study was to identify the role of the retinal pathways, and spiking vs nonspiking responses in generating the transient pattern ERG in the mouse using pharmacologic manipulations. In order to confirm previous work and to compare effects of ganglion cell lesions with pharmacologic studies, optic nerve crush (ONC) also was done to create a selective ganglion cell lesion, and flash ERGs were recorded in all experiments. Results of these studies indicate that the P1 and N2 waves of the mouse pattern ERG are dominated by retinal ganglion cell contributions from the ON and OFF pathways respectively, and that both spiking and nonspiking activity contributes to the two components.
METHODS
Subjects
The subjects were 25 C57BL/6 mice of both sexes (n=30 eyes) 3 - 6 months of age. Mice were reared and housed in a room with a 12 hr on (<40 lux) / 12 hr off light / dark cycle. All experimental and animal care procedures were approved by the Institutional Animal Care and Use Committee of the University of Houston, and adhered to the ARVO Statement for the Use of Animals in Ophthalmic and Vision Research. Four of the animals had the optic nerve crushed in one eye; recordings from their fellow eyes were used for control data.
Animal preparation for ERG recordings
Animal preparation was similarly to that described previously (Saszik et al., 2002; Shirato et al., 2008). Animals were initially anesthetized with an intraperitoneal injection of ketamine (60 mg/kg) and xylazine (6 mg/kg), and anesthesia was maintained with 93% of the dose every 20-40 minutes via a subcutaneous needle fixed in the flank. The animal's head was fixed in a head holder. Pupils were fully dilated to 3 mm in diameter with topical atropine (0.5%) and phenylephrine (2.5%). Body temperature was monitored and maintained at 37°C with a thermostatically controlled electrically heated blanket (CWE, Inc., Ardmore, PA, USA). Recording periods lasted 2 – 4 hours. Nearly all mice recovered from anesthesia after recording sessions, and data were discarded from those few that succumbed during the session, and for which responses were falling inin amplitude and/or becoming prolonged in time course over the session. ERGs were recorded using DTL fiber electrodes (Dawson et al., 1979) placed across the center of the cornea of the tested eye and the fellow eye which served as a reference. The cornea of tested eye was covered with a contact lens heatformed from clear film (ACLAR film, Honeywell, USA). For pattern ERG studies, an artificial pupil was used to improve depth of field. The contact lens then was opaque (permanent black marker applied) except for a 0.8 mm diameter clear aperture in the center of the lens. The non-tested eye was covered with a black plastic (PVC) contact lens and a black aluminum foil cap that covered both the eye and the skull to block any scattered light. Electrodes were moistened with methylcellulose sodium (Celluvisc, Allergan Inc., USA) to ensure good electrical contact and to keep the corneas hydrated during the experiment.
Visual stimulation
Pattern ERGs were recorded in response to contrast-reversal of horizontal black and white square wave bar gratings with a mean luminance of 50 photopic (ph) cd/m2 (calibrated using a spot photometer, model LS-100 Minolta Camera Co., Ltd. Osaka, JP), and more appropriate for mouse M-cones, 45 scotopic (sc) cd/m2 (calibrated using model IL 1700 with a scotopic filter, International Light, Peabody MA, USA). The standard grating contrast was 90%, with a 1 Hz reversal rate, and spatial frequency of 0.05 cy/deg. It was displayed on an RGB monitor 28 cm high by 34 cm wide (model HL7955SFK; Mitsubishi Electric Corporation, Nagasaki, JP) at a distance of 20 cm from the mouse's eye. The spatial frequency and approximate contrast have been reported to maximize pattern ERG amplitude in the mouse (Porciatti, 2007). For a subset of animals, contrasts between 50 and 90% were used to ensure that the amplitude of both positive (P1) and negative (N2) portions of the response were optimized. The stimulus display contained four full cycles of the grating. The center of visual stimulus was aligned with the projection of the pupil. A typical protocol consisted of a series of 6 consecutive responses to 300 contrast reversals each, and then the1800 reversals were averaged.
Flash ERGs were measured after the drug injection (about one hour) and before the pattern ERG recording to make sure that drug injections took effect adequately, and to document effects on the flash ERG. The flash ERG stimulus consisted of a brief ganzfeld flash of short duration (<4 ms) on a rod-suppressing background of 2.6 log sc td (63 cd s/m2 seen through a 3 mm diameter pupil). These full field flash stimuli were provided by green light-emitting diodes (LEDs) whose peak wavelength (λmax = 513 nm) was near that both of mouse M-cones (Jacobs et al., 1991; Lyubarsky et al., 1999) and rods (hence the scotopic calibration). Stimulus strengths ranged from 0.4 to 2.5 log sc td s, with a flash interval of 1.0 sec. The ganzfeld stimuli were produced by a monocular mini-ganzfeld stimulator (Espion Colorburst stimulator, Diagnosys Ltd, Lowell MA, USA). Animals were adapted to the background light for 45 minutes before recording to ensure complete light adaptation and a stable photopic response (Kaneko et al., 2006). Time zero was taken to be the half-way through the flash. Responses were averages of 15 flashes for each of the stimulus energies.
Intravitreal injections
Under a dissecting microscope (10x), a small hole was punctured in the eye just behind the limbus of one eye with a 30-gauge needle, and a glass pipette (tip ∼20 μm) was inserted through the hole. The following pharmacologic agents (all from Sigma Aldrich, USA) were injected (1.0-1.2 μl) using a Hamilton Microsyringe (Hamilton Company, Reno, NV, USA). PDA (cis-2, 3-piperidine-dicarboxylic acid, 5.2 mM) to block transmission to hyperpolarizing (Off) bipolar, horizontal and inner retinal cells (Bush and Sieving, 1994; Slaughter and Miller, 1983), TTX (tetrodotoxin, 5 μM) to block Na+--dependent spiking activity, APB (L-2 amino-4-phosphonobutyric acid, 1.4 mM) to block the activities of the postreceptoral ON-pathway at depolarizing bipolar cells (Slaughter and Miller, 1981), and mixed solutions of APB+TTX and PDA+TTX. Final intravitreal doses of drugs were based on an estimated vitreal volume of 20 μl. Concentrations of drugs were chosen on the basis of those used in previous ERG studies in mice (Shirato et al., 2008), cats (Robson and Frishman, 1995) and primates (Rangaswamy et al., 2004; Viswanathan et al., 1999). After drug injection, the ERG was monitored until no further change was seen in the response to ensure that data were obtained only when the flash ERG had stabilized. Responses generally stabilized within an hour of the time of injection.
Unilateral optic nerve crush (ONC)
Before crushing the optic nerve, pattern and flash ERGs were recorded to confirm that responses were normal. Then under a dissecting microscope (10x), a small incision was made in the conjunctiva temporally, and it was gently peeled back to the posterior region of the eyeball with care not to cut any vessels. The optic nerve was then exposed using blunt forceps and a retractor. The nerve was crushed with the forceps for three sec under direct visualization. Crush was done with a blunt instrument, instead of transection with a sharp instrument because a sinus filled with blood impeded access to the nerve. After the forceps were removed, a drop of anti-microbial ointment (AK-Spore, Akorn, USA) was applied to the conjunctiva. We confirmed by direct ophthalmoscopic inspection that there was no bleeding from retinal blood vessels or retinal whitening due to retinal artery occlusion around the optic nerve head that would indicate ischemic changes that could affect the ERG. After these procedures, all instruments and surfaces were scrubbed with antimicrobial soap, and instruments were sterilized for future use (Hot Bread Sterilizer, Fine Science Tools, Inc., USA). Since the loss of ganglion cells occurs over 3-4 week period following ONC (Li et al., 1999), final recordings were done 39 to 42 days post ONC to ensure that ganglion cells had degenerated. Ganglion cell loss was confirmed in histological sections using immunocytochemical analysis. Animals in which many ganglion cells were still present in the retina subsequent to ONC also were eliminated from the sample.
Cell counting
After mice were euthanized, the eyes were excised from the head, and the corneas and lenses were removed. The eyecups were fixed in 4% paraformaldehyde in cocodylate buffer solution (pH 7.4) at room temperature for 30 minutes. After rinsing with PBS, eyecups were cryoprotected in 30% sucrose in PBS for at least 24 hrs, embedded in OCT (Tissue-Tek, Elkhart, IN) and flash frozen in liquid nitrogen. Retinal blocks were stored at −80°C prior to sectioning at 10 μm. Immunolabeling was performed on frozen sections using immunofluorescent method as previously described (Sherry and Heidelberger, 2005; Sherry et al., 2003; Wang et al., 2003). Sections were thawed, rinsed with Nano-pure water, treated with 1% NaBH4 for 2 min and rinsed with Nano-pure water and PBS. After incubation in blocker (10% NGS, 5% bovine serum, 1% fish gelatin, and 0.5% Triton X-100 in PBS) for 2 hours at room temperature, sections were incubated with primary antibodies for 2 days at 4°C. To identify the cell types, double labeling was done with specific cell marker antibodies to a ganglion cell marker, Brn3a (Chemicon International, Temecula, CA, USA; host, mouse; dilution 1:0-30 or 50) and with 4′,6 diamidino 2 phenylindole (DAPI), which stains double-stranded DNA and hence labels nuclei of all retinal cells. Brn3a proteins are found in a large fraction of ganglion cells (∼80%) (Xiang et al., 1995). In a few cases γ aminobutyric acid (GABA) also was used (gift from Dr. DV Pow, University of Queensland, AU; host, rabbit; dilution, 1:1000). GABA is the inhibitory neurotransmitter released by many amacrine cells, and most displaced amacrine cells (Kao and Sterling, 2006; Perez De Sevilla Muller et al., 2007; Wassle et al., 1987). After sections were washed with PBS and incubated in blocker for 30 min, secondary antibodies were applied for one hour at room temperature. The following secondary antibodies were used: Alexa 488-coupled goat anti-rabbit IgG antibody (1:400; Molecular Probes, Eugene, OR), Cy3-coupled goat anti-mouse IgG antibody (1:400; Jackson Immunoresearch Laboratories, West Grove, PA). After PBS and nano-pure water rinses, sections were coverslipped in Vectashield mounting medium containing a fade-retardant mounting medium with DAPI (Vector Labs Inc, Burlingame CA, USA). For conventional microscopy, gray-scale images were captured from an Olympus IX 70 and frame-averaged (24-32 frames/image) to reduce noise. For confocal microscopy, the sections were visualized and imaged using Leica TCS SP2 microscope and LCS software (Leica Microsystems, Exton, PA, USA). Stacks of serial optical sections were collected and generated into a single image using maximum projection. To avoid bleed through of signals, each fluorescence channel was sequentially imaged. The images were imported into Photoshop Cs2 (Adobe Systems, Inc., Mountain View, CA, USA) for further analysis. To assess the colocalization in double labeling, the matching images taken via different channels were pseudocolored and superimposed. Image scales were calibrated, and brightness and contrast were adjusted if necessary. Single labeling appeared white, green or red.
Cell counting was performed on 12 vertical sections for each eye that extended from central (around the optic nerve head) to peripheral retina. Each stained cell in the ganglion cell layer was counted in the photo-images. The mean countable area was approximately 700 μm of retina in each animal. Cells were quantified using the number occurring per each mm length.
Data analysis
Flash ERG
B--wave amplitudes were measured from baseline to the positive peak of the b-wave rather than from the a-wave trough, as it was small and variable. A band-pass filter, 1 Hz to 45 Hz, was used before the amplitude measurements to remove drift at low frequencies and the influence of oscillatory potentials (OPs) at high frequencies (i.e. > 45 Hz) in the flash ERG waveform. However, for the figures in this paper displaying flash ERGs, the filter was not used. The b-wave amplitudes shown in the bar plots and tables were calculated by averaging the response amplitudes from filtered records for the three highest stimulus energies (1.9, 2.2 and 2.5 log sc td s). Peak amplitudes of these three responses varied less after filtering out the OPs, and effects of experimental manipulations on the responses were always similar. Results based on responses to 2.2. log sc td s alone were similar to the average results reported, but variability was greater.
Pattern ERG
The amplitude of P1 was measured from baseline at the positive peak of P1. The full PERG amplitude, in most cases was measured from the positive peak of P1 to the negative trough of N2, and referred to as P1N2. In special cases, as noted in the text, N2 was measured from baseline. The same band-pass filter that was used for b-wave measurements was used for the pattern ERG data.
Statistics
For comparisons between before and after ONC, a two-sample t-test that assumed unequal variance was used. For comparisons of the same eye's ERG and pattern ERG results before and after intravitreal injections, a paired comparison two sample for means t-test was used. To compare results after different pharmacologic agents were injected, a two-sample t-test assuming unequal variance was used.
RESULTS
Flash and pattern ERGs of control eyes
The primary aim of the current study was to investigate the retinal origins of the pattern ERG. However, in each experimental session light-adapted full-field flash ERGs also were recorded. Effects of pharmacologic agents were monitored initially using flash ERGs. This was done to make sure that expected changes in flash ERGs, when known in mice, e.g. effects of APB and PDA (Sharma et al., 2005; Shirato et al., 2008), were obtained before recording pattern ERGs for which the effects of the agents were unknown. Flash ERG recordings also provided new information on the function of the retinal cells distal to the pattern ERG generator in inner retina, before and after pharmacologic manipulations not previously documented, e.g. injection of TTX, and in eyes in which optic nerve crush (ONC) had been performed.
Fig. 1A shows a representative family of flash ERG responses recorded from a normal C57BL/6 mouse under the light-adapted conditions used in this study in response to brief (<4 ms) full-field flashes of increasing stimulus energy. A small a-wave, peaking around 15 ms after the flash, appeared for stimulus energy of 1.3 log sc td s and grew slowly in amplitude. In mice, a-waves elicited by these stimulus energies are known to be dominated by postreceptoral OFF pathway contributions, rather than the cone photoreceptors (Ohtoshi et al., 2004; Sharma et al., 2005; Shirato et al., 2008). A positive-going b-wave, generated mainly by ON cone bipolar cells though OFF bipolar and/or horizontal cells also shape the response (Bush and Sieving, 1994; Pugh et al., 1998; Sharma et al., 2005; Shirato et al., 2008) was present in all records. Although barely visible for the weakest stimulus, its amplitude increased steadily as the stimuli energy was increased. The timing of the b-wave peak was around 45 ms after flash onset, as seen in previous studies for similar stimulus conditions, e.g. (Ohtoshi et al., 2004). A small, negative-going wave of variable amplitude in controls recordings, just following the b-wave, called the photopic negative response (PhNR) also was present. The PhNR originates from ganglion cells in primates (Viswanathan et al., 1999), but probably from amacrine cells in rats (Mojumder et al., 2008), and in mice, as subsequent figures in the present study suggest. Oscillatory potentials (OPs) which also are thought to originate from amacrine and perhaps ganglion cells of the inner retina, for reviews see (Frishman, 2005; Wachtmeister, 1998) could be seen superimposed on the b-wave for most stimuli stronger than 1.3 log sc td. In some animals, and with some pharmacologic manipulations, the OPs were more or less prominent, as can be seen in later sections of the results. For measurement of b-wave amplitudes, shown in subsequent figures and Table 2, the OPs were filtered out, as described in the Methods section.
Figure 1. Flash and pattern ERGs in normal eyes of C57BL/6 mice.

(A) Light-adapted full-field flash ERGs in response to brief ganzfeld flashes (λmax = 513 nm) of increasing stimulus strength on a rod saturating background for a control C57BL/6 mouse. (B) Pattern ERG responses to 0.05 cy/deg horizontal square wave gratings modulated at 1 Hz recorded from 30 normal “control” eyes of 25 mice. Thin gray lines are individual waveforms, and the thick black line is the average waveform. (C) Pattern ERGs of 19 mouse eyes tested with four different grating contrasts. Black, red, blue and green lines represent responses to reversing gratings of 90%, 75%, 60% and 50% contrast, respectively. (D) Average contrast response functions for the mouse pattern ERG. P1 amplitude is represented by filled circles and P1N2 by open circles. Linear regression lines were fit using Sigmaplot 10 regression wizard (Systat Software Inc, USA). For P1, r2 = 0.98, for P1n2, r2=0.99. The vertical bars indicate the standard error of the mean, SE, in this and all subsequent figures. The same standard flash stimuli, and pattern stimuli (90% contrast only) were used for all subsequent figures showing recorded responses.
TABLE 2.
Pattern and flash ERG amplitudes before and after pharmacologic blockade
| P1 | P1N2 | P1N2/P1 | b-wave | |||||
|---|---|---|---|---|---|---|---|---|
| Agent | Before (μv) | After (μv) | Before (μv) | After (μv) | Before | After | Before (μv) | After (μv) |
|
TTX (n=4) |
4.5±0.7 | 1.1±0.2* | 9.7±1.0 | 4.5±0.6** | 2.2±0.2 | 4.5±0.9 | 239.1±4.4 | 94.3±5.0*** |
|
PDA (n=4) |
7.1±1.5 | 1.7±0.7 | 13.8±3.0 | 4.2±0.5* | 2.0±0.05 | 4.0±1.9 | 239.9±21.0 | 232.1±34 |
|
APB (n=3) |
5.7±0.8 | - | 9.4±1.3 | 4.5±0.4+ | 1.7±0.03 | - | 214.3±35.3 | - |
|
APB+TTX (n=3) |
8.7±1.9 | - | 16.0±2.9 | 2.5±0.2* | 1.9±0.3 | - | 251.7±35.0 | - |
|
PDA+TTX (n=4) |
7.5±0.8 | 1.5±0.3** | 12.6±0.4 | 3.2±0.6*** | 1.7±0.2 | 2.2±0.2** | 178.5±12.0 | 186.0±29 |
Data are expressed as the mean (μv) ± SE.
Statistics were not done for results after APB and APB+TTX when P1 of the PERG and the b-wave of the flash ERG were completely eliminated. The b-wave amplitudes shown in this table were calculated by averaging the response amplitudes from filtered records (to remove OPs) for the three highest stimulus energies (1.9, 2.2 and 2.5 log sc td s).
A paired comparison two sample for means t- test was used for these statistics where results were compared for the same eye before and after injection.
P<0.05
P<0.01
P<0.001
P=.056
Transient pattern ERG responses to reversals at 1 Hz of high contrast (90%), with a rod saturating mean luminance, were obtained from 30 normal “control” eyes of 25 C57BL/6 mice. Fig. 1B shows the pattern ERG waveforms (gray lines) for all 30 eyes as well as the average waveform (black line) for the group. The pattern ERG consisted of a prominent positive component that peaked, on average, around 60 ms after each reversal (P1), with little variability across animals and contrasts. P1 was followed by a slower negative component (N2) whose trough was on average around 132 ms after each reversal for the highest contrast of 90%, 138 ms for 75%, 148 ms for 60%, and 189 ms for 50%. However the N2 timing was variable, and in few records measured at 90% contrast, the trough occurred as late as 200 ms after each pattern reversal. Although the exact peak times are later in humans, these waves are similar in appearance to the P50 and N95 waves of the human pattern ERG, named for the peak (or trough) time. The human pattern ERG also has an initial negative component called N35, which would be termed, N1 in these mouse studies, if it were obvious in the records. For control mouse eyes, the pattern ERG was a robust response: the mean peak amplitude (90% contrast) of P1, measured from the baseline was 7.4 μV (SE=0.6), and the mean amplitude of the peak to trough (P1N2) was 13.3 μV (SE=0.9). The ratio, P1N2/P1 was 1.9, indicating that the amplitude of P1, on average was just slightly greater than that of N2.
To ensure that the highest contrast was the appropriate one to use, i.e. that it produced the largest P1 and N2 waves, but that responses were not saturated, pattern ERGs also were recorded using three lower contrasts. Fig. 1C shows average pattern ERGs (n=19) for each of four contrasts ranging from 50% to 90%. The PERG amplitude increased monotonically as contrast was increased (Fig. 1D) and the amplitudes of both waves were greatest for 90% contrast. Similar characteristics of the mouse PERG, and its relation to contrast have been described previously (Porciatti, 2007).
Effect of unilateral optic nerve crush (ONC) on the flash and pattern ERG
As noted in the Introduction, previous work in a number of species, including mice, has shown that generation of the pattern ERG relies upon the functional integrity of the retinal ganglion cells. In the present work to confirm this finding for the strain of mice, C57BL/6, and stimulus and recording conditions used for our studies of pattern ERG origins, the effects of ganglion cell loss due to unilateral ONC were studied in four mice. Fig. 2 (A-D) shows the flash ERG responses to the strongest flash (2.5 log sc td s) in the insets to each plot, and the pattern ERGs in the main plots for each of the four mice. The black lines show the control records acquired before ONC, and the red lines show responses 39-42 days after the ONC operations. Fig. 2 and Table 1 show that b-wave amplitudes before and 39-42 days after ONC were not significantly different. For this and subsequent figures, the b-wave amplitude measurement reflects the average of the responses to the three strongest flashes, for the range of stimulus energies illustrated in Fig. 1A. A small elevation of the tail of the b-wave after ONC in the region of the PhNR, occurred removing the response, at least at its normal time of occurrence. Given the small size of the negative wave, results were not quantified. In contrast to the effects on the flash ERG, the figure and table show that for the PERG, ONC led to significant reductions in amplitude for both P1 and N2 (P1N2), leaving only small positive and negative waves, or no response at all in the case of mouse #1283.
Figure 2. Flash and pattern ERGs following optic nerve crush and retinal ganglion cell degeneration.

(A-D) Individual pattern ERGs before (black line) and 39 to 42 days after (red line) unilateral optic nerve crush (ONC) in four mice. The inset plots show flash ERGs for the same ONC eye elicited by a +2.5 log sc td s flash before (black line) and after (red line) ONC.
TABLE 1.
Effects of ONC on pattern ERGs, flash ERGs and number of cells in the ganglion cell layer
| A. Flash ERG and PERG amplitudes and P-values before and after ONC operation | ||||||||
|---|---|---|---|---|---|---|---|---|
| A. | P1 | P1N2 | P1N2/P1 | b-wave | ||||
| Mouse | Before | After | Before | After | Before | After | Before | After |
| 1281 | 7.4 | 1.2 | 21.3 | 2.6 | 2.9 | 2.2 | 178.0 | 194.5 |
| 1282 | 12.5 | 2.1 | 19.1 | 4.1 | 1.5 | 2.0 | 215.0 | 196.9 |
| 1283 | 9.4 | 0 | 13.7 | 0 | 1.5 | 0 | 181.7 | 157.4 |
| 1285 | 14.1 | 1.0 | 25.0 | 2.3 | 1.8 | 2.4 | 134.5 | 144.1 |
| average | 10.8±1.5 | 1.1±0.4 | 19.8±2.4 | 2.3±0. | 1.9±0.3 | 1.6±1.1 | 177.3±16.5 | 173.2±13.2 |
| P-value | 0.007* | 0.003* | 0.59 | 0.71 | ||||
| B. Number of cells (per mm) and P-values for comparison of numbers before and after ONC operation | |||
| B. | Before | After | P-value |
| DAPI (n=4) | 100.16±1.7 | 69.91±3.3 | 0.0005* |
| Brn3A (n=4) | 39.83±0.46 | 1.91±0.5 | 2.2×10⁻⁹* |
Average data are expressed as the mean ± SE.
For comparisons between before and after ONC, a two-sample t-test that assumed unequal variance was used.
P≤ 0.003
To confirm that the ONC procedure reduced the ganglion cell population, retinas were removed for histological processing after ERG recordings were completed. Cell counts were made in the retinal ganglion cell layer of the eye after ONC, and its fellow eye. Retinas were stained with DAPI (blue) to show, as described in the Methods section, all cells' nuclei, and Brn3a (green) to label, in the control eye, about 80% of the retinal ganglion cells (Xiang et al., 1995). Fig. 3 shows DAPI and Brn3a stained sections from an eye about 40 days after ONC, and its fellow eye. Inspection of the figure indicates that outer and inner nuclear layers were similar in the two eyes, but in the ONC eye, the retinal ganglion cell layer was lacking cells, especially cells labeled for Brn3a. This figure also shows GABA staining in red. GABA is released by many amacrine cells and their processes distal to the ganglion cell layer, as well as most of the displaced amacrine cells in the ganglion cell layer (Kao and Sterling, 2006; Perez De Sevilla Muller et al., 2007; Wassle et al., 1987). The GABA staining was similar in the two eyes, in the inner nuclear, and inner plexiform layer, and in the ganglion cell layer, as well. The presence of normal GABA staining in the ganglion cell layer indicated that displaced amacrine cells, which make up about 60% of the cell population in the ganglion cell layer of mice (Jeon et al., 1998) were still present following ONC.
Figure 3. Retinal sections from an eye after optic nerve crush and the control fellow eye immunolabeled for Brn3a, GABA and DAPI.
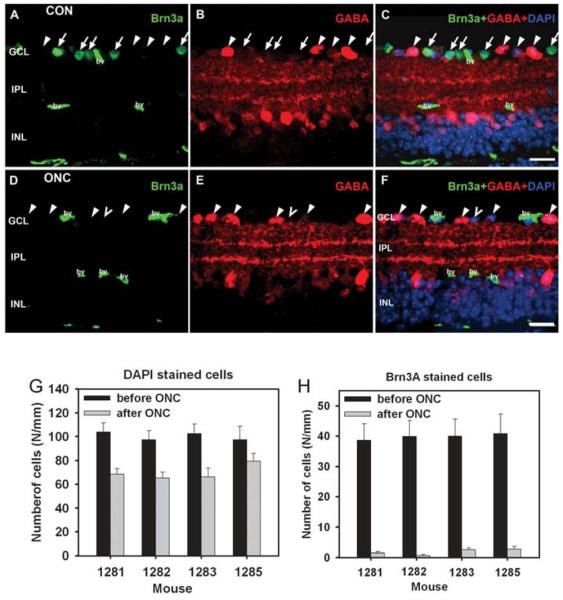
(A-C) Retinal section from control eye. (A) Brn3a labels a large fraction of ganglion cells (arrow). Non-specific labeling is present in blood vessels (bv). (B) GABA labels displaced amacrine cells in the ganglion cell layer (GCL) (arrowheads), amacrine cells in the inner nuclear layer (INL) and amacrine cell processes in the inner plexiform layer (IPL). (C) Overlay for Brn3a, GABA and DAPI labeling. DAPI labeling visualizes all nuclei. Some nuclei, although none in the section illustrated were not labeled for Brn3a or GABA. They are either Brn3a negative ganglion cells or GABA negative amacrine cells. (D-F) Retinal section from an eye 40 days after ONC. (D) Brn3a labeling is absent, indicating loss of ganglion cells. Non-specific labeling is present in blood vessels (bv). (E) GABA immunoreactivity is present in the INL, IPL and in displaced amacrine cells in the GCL (arrowheads), as in the control retina. (F) One nucleus (unfilled arrowhead) indicated by DAPI staining is not labeled for Brn3a. Scales bar: 20 μm. (G, H) Number of DAPI and Brn3a-stained cells in the retinal ganglion cell layer per mm before (black bars) and after (gray bars) ONC for the four mice.
Fig. 3G and h illustrate, using bar graphs, for the four mice after ONC, the counted number of cells per mm in the ganglion cell layer in retinal sections from ONC and control fellow eyes stained with DAPI and Brn3a. The average values appear in Table 1 as well. DAPI stained cells in the ganglion cell layer were reduced to about 60% of control in three of the ONC eyes, and 75% in the remaining one, whereas Brn3a stained cells were almost eliminated in all eyes, with less than 5% of control present in the eyes after ONC. These results are consistent with substantial loss of retinal ganglion cells in eyes following ONC.
Effect of TTX on the flash and pattern ERG
Sodium dependent action potentials occur in retinal ganglion cells, and some amacrine cells in the inner retina. As noted in the introduction recent studies in rat retina have indicated presence of TTX-sensitive voltage-gated Na+ channels in cone bipolar cells in rats as well (Bui and Fortune, 2004; Cui and Pan, 2008; Ma et al., 2005; Mojumder et al., 2007; Mojumder et al., 2008; Pan and Hu, 2000). In order to investigate the role of voltage-gated Na+ channels in generation of the flash ERG and pattern ERG in mice, one eye of each of four subjects was injected with TTX.
Fig. 4A shows a typical flash ERG for one mouse eye before and after TTX injection. In this and subsequent figures, the control response before injection is shown by the black line, the response, about an hour after injection, is shown with a red line. The most obvious effect of TTX on the flash ERG was a reduction of the b-wave in response to flash energies of 1.6 log sc td s or greater. TTX reduced the b-wave amplitudes, measured after filtering responses to remove OPs, by about 60% for the four mice tested (Fig. 4C and Table 2), which was at least a great as the reduction seen in rat light-adapted ERG (Bui and Fortune, 2004; Mojumder et al., 2008). Another effect of the TTX was to delay the rise of the b-wave. The a-wave amplitude was slightly increased because the wave lasted longer before the b-wave began to rise. This small effect was consistent, but not quantified. TTX also caused the OPs to become more prominent in responses to the lower energies, and prolonged the tail of the b-wave for the strongest two stimuli, thereby reducing the small PhNR that occurred after the b-wave in the control eye.
Figure 4. Effect of TTX on the flash pattern ERG.

(A) Light-adapted flash ERGs recorded from a mouse eye before (black lines) and after (red lines) TTX injection. (B) Average pattern ERG before (black line) and after (red line) TTX injection for four mice. In this and subsequent figures, the flash ERGs were recorded from one of the four mice for which pattern ERGs were recorded. The inset plot shows the individual pattern ERGs (gray lines) for the four mice after TTX injection, and the same average waveform (red line) that is shown in the main plot. (C) Average amplitudes before (black bars) and after (gray bars) TTX injection of P1 and P1N2 of the pattern ERG, the P1N2/P1 ratio and the amplitude of the b-wave, averaged in this and subsequent figures over the responses to the three strongest flashes, filtered to include only those signals between 1 Hz to 45 Hz.
Fig. 4B shows the average PERG (n=4) before and after TTX injections; individual results after injection are shown in the inset in this and subsequent figures that illustrate pattern ERGs. Fig. 4B and C and Table 2 show that both PI and P1N2 were significantly reduced by TTX. TTX reduced P1 amplitude by about 76% and P1N2 amplitude by about 54%. TTX also delayed both components of the pattern ERG, P1 peak time by 12.5 ms (SE=3.2), and the trough of N2 by 41.0 ms (SE=8.8). Mean P1N2/P1 ratios (Table 2) doubled after TTX injection, reflecting the relatively larger amplitude of the negative-going response, than the positive one after blockade of spiking activity.
Effect of PDA on the flash and pattern ERG
Another pharmacologic agent that affects amacrine and ganglion cell responses is the ionotropic glutamate receptor antagonist, PDA. In addition to blocking activation of amacrine and ganglion cells, it also blocks activation of OFF bipolar cells and horizontal cells (Slaughter and Miller, 1983). Fig. 5A shows the flash ERG for one mouse eye before and after PDA injection. After PDA injection, the a-wave was eliminated, as observed originally in monkey (Bush and Sieving, 1994) and previously in mice as well for these or similar stimuli (Sharma et al., 2005; Shirato et al., 2008), and the entire waveform was smoothed because of removal of OPs. The b-wave amplitude was not greatly affected (see Fig. 5C and Table 2), but the peak time was delayed and the recovery phase of b-wave was slowed, broadening the response, and eliminating the PhNR (see Fig. 5C).
Figure 5. Effect of PDA on the flash and pattern ERG.

(A) Light-adapted flash ERGs recorded from a mouse eye before (black lines) and after (red lines) PDA injection. (B) Average pattern ERG before (black line) and after (red line) PDA injection for four mice. The inset plot shows the individual pattern ERGs (gray lines) for the four mice after PDA injection and the same average waveform (red line) that is shown in the main plot. (C) Average amplitudes before (black bars) and after (gray bars) PDA injection of P1 and P1N2 of the pattern ERG, P1N2/P1 ratio and amplitude of the b-wave.
The pattern ERGs (n=4) before and after PDA injections are illustrated in Fig. 5B. Both P1 and N2 were greatly reduced, particularly at the peak times of the original response. However, as found after TTX, peak times were delayed after PDA. P1 peak time was delayed by 14.8 ms (SE= 4.3), similar to the finding after TTX. The N2 trough was delayed 85.5 ms (SE= 9.5), which was nearly twice as much as after TTX. This suggests a different origin, at least in part, for the residual response, after PDA than after TTX. Possible mechanisms for the delayed responses will be addressed in the discussion section. Fig. 5C and Table 2 show amplitude measurements after PDA injection made at the delayed times. PDA reduced P1 amplitudes by about 76%, similar to results after TTX, and P1N2 amplitudes were reduced by about 70%, slightly more than after TTX. As was found for TTX, mean P1N2/P1 ratios doubled after PDA injection, reflecting the relatively larger amplitude of the negative-going response, than the positive one after blockade of inner retinal activity. Presumably both of these responses originated distal to amacrine and ganglion cells.
Effect of APB on the flash and pattern ERG
To examine the role of ON and OFF retinal pathways in generating the PERG, APB, a metabotropic glutamate receptor analogue was used. APB prevents transfer of cone signals to ON cone bipolar cells, leaving the OFF pathway signaling intact(Slaughter and Miller, 1981).
Fig. 6A shows the typical effect of APB on the flash ERG. As expected from many previous studies, including studies in mice, e.g. (Sharma et al., 2005; Shirato et al., 2008), APB eliminated the b-wave, leaving a negative ERG composed of cone photoreceptor, OFF pathway, and possibly glial responses. The late positive intrusion starting about 40 to 50 ms after stimulus onset in mice lacking b-waves has been found to be PDA sensitive, and therefore has an origin in the OFF pathway (Koyasu et al., 2008; Shirato et al., 2008).
Figure 6. Effect of APB on the flash and pattern ERG.

(A) Light-adapted flash ERGs recorded from a mouse eye before (black lines) and after (red lines) APB injection. (B) Average pattern ERG before (black line) and after (red line) APB injection for three mice. The inset plot shows the individual pattern ERGs (gray lines) for the three mice after APB injection and the same average waveform (red line) that is shown in the main plot. (C) Average amplitudes of P1, P1N2 of the pattern ERG, P1N2/P1 ratio and the b-wave amplitude before (black bars) APB injection. Only P1N2, measured from baseline, is shown after APB injection (gray bar). The plot does not include amplitudes of P1 and the b-wave or the P1N2/P1 ratio after APB injection because both P! and the b-wave were eliminated.
Pattern ERGs (Fig. 6B, n=3) after APB injections no longer contained a P1 component, but N2 was present, commencing much earlier than in control eyes, but then of similar time course and amplitude to the control responses. Fig. 6C and Table 2 show amplitudes for P1 and P1N2. After APB, P1 was eliminated, and therefore no amplitude measurements were made. For measurements of P1N2, P1 was assumed to be at the zero amplitude baseline, and the measured amplitude was just that of N2. The amplitude of N2 after APB was, on average, about 0.8 μV larger than that of N2 before APB (P1N2 – P1), but this was not significant. The early onset of N2 may reflect the normal timecourse of N2, when not obscured by P1.
Effect of APB+TTX on the flash and pattern ERG
APB injection appeared to leave the N2 wave of the pattern ERG intact (Fig. 6), suggesting that N2 originates from the OFF pathway. However, it was possible that the remaining response included substantial contributions from cells other than ganglion cells in the unusual situation where the entire ON pathway was blocked. To investigate this issue, a combination of APB and TTX was injected. TTX alone, as shown in Fig. 4 and Table 2, removed nearly half of P1N2.
Fig. 7A shows that the flash ERG after APB+TTX injection was similar to that after APB alone, although the positive intrusion, starting around 40 ms after the stimulus flash was less prominent in this and other eyes.
Figure 7. Effect of APB+TTX on the flash and pattern ERG.

(A) Light-adapted flash ERGs recorded from a mouse eye before (black lines) and after (red lines) APB+TTX injection. (B) Average pattern ERG before (black line) and after (red line) APB+TTX injection for three mice. The inset plot shows the individual pattern ERGs (gray lines) for the three mice after APB+TTX injection and the same average waveform (red line) that is shown in the main plot. (C) Average amplitudes of P1, P1N2 of the pattern ERG, P1N2/P1 ratio and the b-wave amplitude before (black bars) APB+TTX injection. Only P1N2, measured from baseline, is shown after APB+TTX injection (gray bar). The plot does not include amplitudes of P1 and the b-wave or the P1N2/P1 ratio after APB injection because both P! and the b-wave were eliminated.
For the pattern ERG, as shown in Fig. 7B, APB+TTX removed P1, similar to the results for APB alone. However, the combined injection had a dramatic effect on the negative wave of the pattern ERG. The early portion of the wave, revealed by APB alone (see Fig. 7B) was essentially gone, leaving only a low amplitude slow negative wavThe combination of APB and TTX also was more effective in removing N2 than TTX alone. This can also be appreciated by comparing APB+TTX results in Fig. 7C with TTX results in Fig. 4C. The timing of the maximum amplitude of the remaining slow wave was similar to that after PDA.
Effect of PDA+TTX on the flash and pattern ERG
Fig. 8 illustrates a parallel experiment to the previous one. In this case, PDA, rather than APB was combined with TTX in the same injection. This was done mainly to see if eliminating Na+-dependent spiking activity would have effects on the pattern ERG greater than those of PDA alone, which is thought to block activity of ganglion, amacrine cells and horizontal cells(Bush and Sieving, 1994; Slaughter and Miller, 1983).
Figure 8. Effect of PDA+TTX on the flash and pattern ERG.

(A) Light-adapted flash ERGs recorded from a mouse eye before (black lines) and after (red lines) PDA+TTX injection. (B) Average pattern ERG before (black line) and after (red line) PDA+TTX injection for four mice. The inset plot shows the individual pattern ERGs (gray lines) for the four mice after PDA+TTX injection and the same average waveform (red line) that is shown in the main plot. (C) Average amplitudes of P1, P1N2 of the pattern ERG, P1N2/P1 ratio and the b-wave amplitude before (black bars) and after (gray bars) PDA+TTX injection.
Fig. 8A shows that the flash ERG was profoundly affected by the injection of PDA+TTX. As found for PDA alone (Fig. 5A), the a-wave (except for the strongest stimulus in this case) and the OPs were eliminated. In addition, the response was prolonged with a second positive peak occurring about 120 ms. Fig. 8C and Table 2 show that the average amplitude of the b-waves elicited by the strongest three flashes was hardly affected by the combined injection. However, Fig. 8A shows that typically the b-wave (first peak) was enhanced for flash energies of 1.9 sc td s and lower.
A comparison of the pattern ERGs after PDA+TTX in Fig. 8B with those after PDA alone in Fig. 5B, indicates that the effects on the response were similar for the two conditions. The measured amplitudes in Fig. 8C and Table 2 show similar residual P1 and P1N2 for the two conditions, consistent with blockade of inner retinal spiking activity by PDA even in the absence of TTX. In contrast, a comparison of the results after PDA+TTX with those after TTX alone (Fig. 4B and 4C) reveals some differences. Although effects on P1 were similar, the presence of PDA caused more reduction of P1N2 than TTX alone, suggesting that both spiking and non-spiking activity was involved in producing the remaining slow N2 component of the response.
N2 amplitude, measured at the time of the trough in control eyes
For the results reported thus far, P1N2 amplitudes were measured (except after APB) to capture the full extent of pharmacologic effects on the pattern ERG. These responses were measured at P1 peak and N2 trough times of both control and post injection records, regardless of the timing in control records. Such measurements obscured to some extent the specific effects of pharmacologic manipulations on the normal pattern ERG generators, particularly in the case of N2. For P1, residual responses, while slowed after TTX and PDA, were quite small, and the large effects on P1 for all pharmacologic manipulations were obvious. For N2, measuring from baseline at the trough time of control responses (132 ms in most cases) both before and after pharmacologic manipulations, added additional information. Table 3 shows that both TTX and PDA reduced N2 amplitude significantly at time of the control N2 trough, and the effect of PDA was significantly greater than that of TTX. Addition of TTX to the APB injection reduced N2 amplitude significantly more that APB alone, and the effect of combining PDA with TTX showed a reduction beyond that with TTX alone that was nearly significant.
TABLE 3.
N2 amplitude before and after pharmacologic blockade, measured at the time of the N2 trough in control recordings
| N2 @ trough of control | Comparison of percent change | ||||
|---|---|---|---|---|---|
| Agents | Before (μv) | After (μv) | PDA | APB+TTX | PDA+TTX |
|
TTX (n=4) |
5.2±0.5 | 2.4±0.2** | P=0.03+ | ns | P=0.06+ |
|
PDA (n=4) |
5.5±2.0 | 1.1±0.6* | ns | ns | |
|
APB (n=3) |
3.7±0.3 | 3.7±0.4 | P=0.02+ | ||
| APB+TTX (n=3) | 5.0±1.3 | 1.9±0.3 | ns | ns | |
| PDA+TTX (n=4) | 5.3±0.7 | 0.9±0.4* | ns | ns | |
N2 amplitudes before and after agents listed in column one are expressed in columns two and three as the mean (μv) ± SE. A paired comparison two sample for means t-test was used to compare results before and after injection in the same eye.
P<0.05
P<0.01
P<0.001.
Percent changes in N2 amplitudes were compared for agents named in columns four through six vs agents named in rows three through seven in the left hand column. To compare results after different pharmacologic agents were injected, a two-sample t-test assuming unequal variance was used. Results after injections of APB alone were not compared with those after TTX or PDA, because APB alone did not affect N2 amplitude, whereas effects of TTX and PDA were significant.
The value in for the pharmacologic agent in the column was significantly greater than the value in the one in the row to which is was compared
DISCUSSION
The main goal of the present study was to investigate the retinal origins of the pattern ERG of a commonly studied mouse strain, C57BL/6. Although previous studies have strongly indicated a primary role for retinal ganglion cells in generating the pattern ERG in mice, as in several other species, further information about the retinal inputs to the response has been lacking. Of particular interest is the contribution of Na+-dependent spiking activity and the ON and OFF pathways of the retina to the response. Findings in the present study in mice lacking ganglion cells following ONC, and after injection of TTX were consistent with both spiking and nonspiking activity of retinal ganglion cells contributing to the P1 and N2 components of the mouse pattern ERG. The study also revealed, using PDA and APB, that the positive, P1 component of the mouse pattern ERG originates entirely from activity of neurons in the ON pathway, whereas the negative, N2 component may be dominated by activity of neurons in the OFF pathway.
Although this study was motivated by questions about the origins of the pattern ERG, light-adapted full-field flash ERGs were recorded, as well, for every experimental manipulation. Effects on flash ERGs after intravitreal injections of APB to block the ON pathway and PDA to block OFF hyperpolarizing second order, and all third order neurons (Slaughter and Miller, 1983) were consistent with previous reports, as acknowledged in the results. New findings showed that loss of ganglion cells due to ONC had no effect on the light-adapted flash ERG a- and b-waves, and created perhaps a small effect on the PhNR, but elimination of spiking activity with TTX dramatically reduced the light-adapted b-wave as has been reported previously for rats (Bui and Fortune, 2004; Mojumder et al., 2007; Mojumder et al., 2008). All manipulations affecting inner retinal cells reduced the PhNR. These findings will be addressed more fully in a later section of the Discussion.
The role of retinal ganglion cells and spiking activity in generating the pattern ERG
Retinal ganglion cells
The pattern ERG was practically eliminated, with only small residual waves or ganglion cell or other origin (see below) when recorded 39-42 days after ONC, whereas the flash ERGs were hardly affected. The effect on the pattern ERG of ONC is consistent with previous reports for mice and other species including rats, cats and monkeys with ganglion cell lesions due to optic nerve section or crush (Berardi et al., 1990; Maffei and Fiorentini, 1982; Maffei et al., 1985; Porciatti et al., 1996); or laser- induced or inherited glaucomatous neuropathy (Ben-Shlomo et al., 2005; Johnson et al., 1989; Porciatti, 2007; Porciatti et al., 2007; Viswanathan et al., 2000). This suggests that the ganglion lesions in the present study were extensive. Cell counts in ganglion cell layers of eyes following ONC and final flash and pattern ERG recordings in this study, were consistent with what would be predicted from previous studies. As shown in Table 1, the retinal ganglion cells (Brn3a positive) made up about 40% of all cells in the ganglion cell layer (DAPI-labeled). This value agrees with previous studies of mouse retina (Drager and Olsen, 1981; Jeon et al., 1998), or within 20% when taking into account the ganglion cells (∼20 % of the population, not labeled for Brn3a (Xiang et al., 1995). The average density of ganglion cells was about 41 cells/mm, and this number was similar to previous work as well (Moon, 2005).
Spiking activity
In the present study, TTX blockade of the Na+-dependent spiking activity, which occurs mainly in ganglion and amacrine cells of the retina, reduced but did not eliminate P1 and N2 waves from the mouse pattern ERG (see Fig. 4B). In previous studies in cat (Trimarchi et al., 1990) and in rat (Ben-Shlomo et al., 2005) TTX also reduced but did not eliminate the positive or negative portions of the response. Thus in these three species in which ganglion cell lesions will essentially eliminate the pattern ERG, the pattern ERG depends upon both spiking and nonspiking activity, likely to originate from the ganglion cells. In contrast, in macaque monkey, the N95 (N2) was found to be completely eliminated by TTX (or severe experimental glaucoma), giving spiking activity a larger role in the generation of the pattern ERG in this species. P50 (P1) in macaques, while reduced, was still present particularly for stimuli of low spatial frequencies (Viswanathan et al., 2000). Residual P1 was seen in three of the four mouse eyes, as well as in the presence of PDA, raising the possibility for small contributions from more distal generators in mice as well. The retinal structure and the waves of the transient pattern ERG, are sufficiently similar in macaque monkeys and humans to predict similar results would occur for humans. The reason for species differences in relative contributions of spiking and nonspiking activity is not presently known.
TTX also was injected in combination with APB and PDA in the present study to further understand spiking and nonspiking contributions with respect to ON and OFF pathways. APB alone, which blocks ON pathway activity, thereby isolating OFF pathway activity, eliminated the entire P1 response (see Fig. 6B), effectively isolating the N2 portion of the response, which was enlarged at early times, probably due to the removal of P1. The addition of TTX to APB almost completely abolished the large isolated N2 component (see Fig. 7B). This finding, taken together with the finding that ganglion cell lesions also practically eliminate the pattern ERG, would be consistent with a large OFF ganglion spiking contribution to the early portion of the N2 component of the PERG. Some of smaller nonspiking contribution to N2, seen after TTX alone in Fig. 4B, were removed by the APB/TTX mixture, perhaps a small negative-going contribution from ON pathway neurons in the post TTX N2 response. Studies using APB in cat (Trimarchi et al., 1990) and more recently in monkey (unpublished observations, Luo, X. and Frishman, L.J.) indicate much more overlap of ON and OFF pathway spiking activity for both the positive and negative components of the pattern ERG than seen in the present study of the pattern ERG of the mouse. Experiments analyzing the reason for this species difference are in progress.
The effects of combining PDA and TTX were less dramatic, with only small additional effect on N2 than TTX alone. The effects of PDA and TTX on P1, were not additive, indicating that both removed spiking activity contributions to the wave. The origin of the slowed residual P1 after PDA or TTX, or both, would logically occur in the ON bipolar cells. Recall that the entire wave was removed by APB. The origin of the slow negative wave after injection of PDA (Fig. 5B) alone or in combination with TTX (Fig. 8B) is not completely established by these experiments. At least some of it is likely to be photoreceptor driven, is indicated in preliminary experiments combining APB and PDA injections (data not shown). Slow PIII, for example, has been seen to contribute to the light-adapted ERG in mice when more proximal responses are removed (Shirato et al., 2008). But this is a complicated issue. The pattern ERG normally displays the nonlinear retinal responses that do not cancel. Injection of pharmacologic agents that alter activity of second order neurons, or even glial contributions to the ERG (APB and PDA, and even TTX, see below) could disturb the balance so that responses that normally would cancel in the pattern ERG do not do so anymore. In any event, residual waves after elimination of inner retina activity are small.
Origins of the light-adapted flash ERG in mice
A- and b-waves
The flash ERG data collected in these studies provided an opportunity to consider findings related to the origins of the flash ERG, as well as the pattern ERG. The origins of the major waves of the flash ERG, the a- and b-waves, have been well studied, and findings in the present study paralleled that of previous work. Light adapted a-waves represent a combination of cone photoreceptor responses, and postreceptoral OFF pathway contributions to the ERG (Bush and Sieving, 1994; Rangaswamy et al., 2004; Robson et al., 2003; Sharma et al., 2005; Xu et al., 2003). B-waves, which can be eliminated by APB, require function of depolarizing bipolar cells (Sharma et al., 2005; Shirato et al., 2008; Sieving et al., 1994). It was also found that ONC had virtually no effect on the light-adapted a- and b-waves in mice, as previous reported after optic nerve section in rat (Mojumder et al., 2008) (although another study in rat reported, using a different surgical approach reported some decrease in b-waves (Bui and Fortune, 2004).
In contrast to ONC, blockade by TTX of voltage-gated Na+ channels, had a profound effect on the b-wave of the light-adapted ERG, reducing the amplitude by more than a factor of two, as seen previously in rats (Bui and Fortune, 2004; Mojumder et al., 2008). In rat retina, using pharmacologic blockade of inner retina, this effect of TTX was traced to channels likely to be in the ON cone bipolar cells themselves (Mojumder et al., 2007; Mojumder et al., 2008), rather than in the more traditionally predicted inner retinal neurons, indicated in studies of rabbit ERG (Dong and Hare, 2000). Supporting the results in rat retina, TTX-sensitive Na+ currents in the somato-dendritic compartment of rat cone bipolar cells (Ma et al., 2005; Pan and Hu, 2000), as well as in the bipolar cells of other vertebrate retinas, originally reported fish retina (Miguel-Hidalgo et al., 1994; Pan and Hu, 2000; Zenisek et al., 2001) and also found in salamander (Ichinose and Lukasiewicz, 2005), but not to our knowledge, yet reported in mice.
The locus of the effect of TTX on the light-adapted b-wave in mice remains to be determined. When PDA was combined with TTX, the flash ERG was not reduced in amplitude to the extent that it was after TTX. This may have been due to PDA blockade of OFF bipolar cell or horizontal cell activity that normally reduces b-wave amplitude. However the result also could indicate blockade of inner retinal activity that in turned blocked the TTX effect on the b-wave in mice, originating from inner retina, as reported in rabbit (Dong and Hare, 2000). The prolonged nature of the response, particularly for strong stimuli where a second positive peak emerged, (Fig. 8), also is not easy to explain, although an ON bipolar cell origin, perhaps from a slowly peaking class would be a logical possibility, given the likely lack of other second, or third order neuronal activity after PDA injection.
PhNR
In macaque monkeys and humans, ganglion cell integrity is essential for generation of the negative wave, the PhNR, that occurs after the b-wave in the flash ERG (Rangaswamy et al., 2004; Viswanathan et al., 1999; Viswanathan et al., 2001). In fact it has been suggested that in monkeys the generator for the PhNR and the N95 of the pattern ERG are in one the same (Viswanathan et al., 2000). In rodents, a ganglion cell origin is less likely for the PhNR. One study in rat, following optic nerve section reported a loss of PhNR (Li et al., 2005), but another, using a different surgical approach, did not observe it (Mojumder et al., 2008). In the current study, PhNRs were small even in control eyes, and therefore not measured, and the rise in the tail of the b-wave that could be seen in eyes after ONC (Fig. 2A), was variable. The effects of TTX and PDA on the PhNR were easier to appreciate, particularly for the strongest stimuli; both agents elevated the tail of the b-wave, and eliminated the small PhNRs. Therefore it is likely that the PhNR in mice (and rats), unlike in primates, arises from spiking and perhaps nonspiking activity of amacrine cells, rather than ganglion cells. Perhaps this is due to the smaller population of ganglion cells in rodents than in primates.
Methodological issues
The pattern ERGs recorded in the present study using square wave gratings of 90% contrast were, on average, about 12 μV when P1N2 was measured. This compares favorably with results from other labs in mice (e.g. Porciatti, 2007), and with human and primate recordings (Viswanathan et al., 2000). The peak times of components in mice appeared earlier than recently described in young DBA2/J mice (Porciatti et al., 2007): differences in lab recording procedures may have produced these small differences, existing work does not allow us to resolve this.
In our experiments, the range of amplitudes and timing was relatively more variable than for flash ERGs recorded in the same session. The alignment of the eye with the pattern may have contributed to the variability. Whereas humans will fixate the pattern in a central position, and it is possible to align the fovea of an anesthetized primate using an indirect ophthalmoscope and rear projection (Viswanathan et al., 2000), for the mouse eye in this study, only the center of the artificial pupil was aligned. This less specific alignment of the eye could have introduced some variability in retinal stimulation. However, the mouse retina has less difference in cell density in central and peripheral regions than primates, probably making the imprecise alignment less deleterious than it would be in those species with a fovea.
Summary
The pattern ERG is an important noninvasive tool for documenting retinal ganglion cell function in normal and diseased retinas. This study has begun to identify the contributions of the different retinal pathways and spiking vs nonspiking neuronal responses to the pattern ERG in mouse, which is an increasingly important model for the study retinal pathology and potential treatment strategies. Further studies to gain a better understanding of the interesting differences in ON and OFF pathway contributions to the response across species, as well as other mechanisms that generate the response will further improve its value as a tool for study of the retina.
ACKNOWLEDGMENTS
This work was supported by National Eye Institute grants R01-Ey06671 and P30-EY07751, and a University of Houston Summer Undergraduate Research Fellowship (SURF) to KI.
Footnotes
Publisher's Disclaimer: This is a PDF file of an unedited manuscript that has been accepted for publication. As a service to our customers we are providing this early version of the manuscript. The manuscript will undergo copyediting, typesetting, and review of the resulting proof before it is published in its final citable form. Please note that during the production process errors may be discovered which could affect the content, and all legal disclaimers that apply to the journal pertain.
Financial disclosures: There are no financial disclosures.
Conflict of Interest: There are no conflicts to report.
REFERENCES
- Aldebasi YH, Drasdo N, Morgan JE, North RV. S-cone, L + M-cone, and pattern, electroretinograms in ocular hypertension and glaucoma. Vision Res. 2004;44:2749–2756. doi: 10.1016/j.visres.2004.06.015. [DOI] [PubMed] [Google Scholar]
- Anderson MG, Smith RS, Hawes NL, Zabaleta A, Chang B, Wiggs JL, John SW. Mutations in genes encoding melanosomal proteins cause pigmentary glaucoma in DBA/2J mice. Nat Genet. 2002;30:81–85. doi: 10.1038/ng794. [DOI] [PubMed] [Google Scholar]
- Arai M, Yoshimura N, Sakaue H, Chihara E, Honda Y. A 3-year follow-up study of ocular hypertension by pattern electroretinogram. Ophthalmologica. 1993;207:187–195. doi: 10.1159/000310431. [DOI] [PubMed] [Google Scholar]
- Bach M, Hiss P, Rover J. Check-size specific changes of pattern electroretinogram in patients with early open-angle glaucoma. Doc Ophthalmol. 1988;69:315–322. doi: 10.1007/BF00154412. [DOI] [PubMed] [Google Scholar]
- Bach M, Hoffmann MB. Update on the pattern electroretinogram in glaucoma. Optom Vis Sci. 2008;85:386–395. doi: 10.1097/OPX.0b013e318177ebf3. [DOI] [PubMed] [Google Scholar]
- Bach M, Unsoeld AS, Philippin H, Staubach F, Maier P, Walter HS, Bomer TG, Funk J. Pattern ERG as an early glaucoma indicator in ocular hypertension: a long-term, prospective study. Invest Ophthalmol Vis Sci. 2006;47:4881–4887. doi: 10.1167/iovs.05-0875. [DOI] [PubMed] [Google Scholar]
- Ben-Shlomo G, Bakalash S, Lambrou GN, Latour E, Dawson WW, Schwartz M, Ofri R. Pattern electroretinography in a rat model of ocular hypertension: functional evidence for early detection of inner retinal damage. Exp Eye Res. 2005;81:340–349. doi: 10.1016/j.exer.2005.02.006. [DOI] [PubMed] [Google Scholar]
- Berardi N, Domenici L, Gravina A, Maffei L. Pattern ERG in rats following section of the optic nerve. Exp Brain Res. 1990;79:539–546. doi: 10.1007/BF00229323. [DOI] [PubMed] [Google Scholar]
- Bui BV, Fortune B. Ganglion cell contributions to the rat full-field electroretinogram. J Physiol. 2004;555:153–173. doi: 10.1113/jphysiol.2003.052738. [DOI] [PMC free article] [PubMed] [Google Scholar]
- Bush RA, Sieving PA. A proximal retinal component in the primate photopic ERG a-wave. Invest Ophthalmol Vis Sci. 1994;35:635–645. [PubMed] [Google Scholar]
- Chang B, Hawes NL, Hurd RE, Wang J, Howell D, Davisson MT, Roderick TH, Nusinowitz S, Heckenlively JR. Mouse models of ocular diseases. Vis Neurosci. 2005;22:587–593. doi: 10.1017/S0952523805225075. [DOI] [PubMed] [Google Scholar]
- Cui J, Pan ZH. Two types of cone bipolar cells express voltage-gated Na+ channels in the rat retina. Vis Neurosci. 2008;25:635–645. doi: 10.1017/S0952523808080851. [DOI] [PMC free article] [PubMed] [Google Scholar]
- Dawson WW, Trick GL, Litzkow CA. Improved electrode for electroretinography. Invest Ophthalmol Vis Sci. 1979;18:988–991. [PubMed] [Google Scholar]
- Dong CJ, Hare WA. Contribution to the kinetics and amplitude of the electroretinogram b-wave by third-order retinal neurons in the rabbit retina. Vision Res. 2000;40:579–589. doi: 10.1016/s0042-6989(99)00203-5. [DOI] [PubMed] [Google Scholar]
- Drager UC, Olsen JF. Ganglion cell distribution in the retina of the mouse. Invest Ophthalmol Vis Sci. 1981;20:285–293. [PubMed] [Google Scholar]
- Frishman LJ. Electrogenesis of the ERG. In: Ryan SJ, editor. Retina. Elsevier/Mosby; St. Louis, MO: 2005. pp. 103–135. [Google Scholar]
- Harrison JM, O'Connor PS, Young RS, Kincaid M, Bentley R. The pattern ERG in man following surgical resection of the optic nerve. Invest Ophthalmol Vis Sci. 1987;28:492–499. [PubMed] [Google Scholar]
- Holder GE. Pattern electroretinography (PERG) and an integrated approach to visual pathway diagnosis. Prog Retin Eye Res. 2001;20:531–561. doi: 10.1016/s1350-9462(00)00030-6. [DOI] [PubMed] [Google Scholar]
- Holder GE, Brigell MG, Hawlina M, Meigen T, Vaegan, Bach M. ISCEV standard for clinical pattern electroretinography--2007 update. Doc Ophthalmol. 2007;114:111–116. doi: 10.1007/s10633-007-9053-1. [DOI] [PMC free article] [PubMed] [Google Scholar]
- Hood DC, Xu L, Thienprasiddhi P, Greenstein VC, Odel JG, Grippo TM, Liebmann JM, Ritch R. The pattern electroretinogram in glaucoma patients with confirmed visual field deficits. Invest Ophthalmol Vis Sci. 2005;46:2411–2418. doi: 10.1167/iovs.05-0238. [DOI] [PubMed] [Google Scholar]
- Ichinose T, Lukasiewicz PD. Inner and outer retinal pathways both contribute to surround inhibition of salamander ganglion cells. J Physiol. 2005;565:517–535. doi: 10.1113/jphysiol.2005.083436. [DOI] [PMC free article] [PubMed] [Google Scholar]
- Jacobs GH, Neitz J, Deegan JF., 2nd Retinal receptors in rodents maximally sensitive to ultraviolet light. Nature. 1991;353:655–656. doi: 10.1038/353655a0. [DOI] [PubMed] [Google Scholar]
- Jakobs TC, Libby RT, Ben Y, John SW, Masland RH. Retinal ganglion cell degeneration is topological but not cell type specific in DBA/2J mice. J Cell Biol. 2005;171:313–325. doi: 10.1083/jcb.200506099. [DOI] [PMC free article] [PubMed] [Google Scholar]
- Jeon CJ, Strettoi E, Masland RH. The major cell populations of the mouse retina. J Neurosci. 1998;18:8936–8946. doi: 10.1523/JNEUROSCI.18-21-08936.1998. [DOI] [PMC free article] [PubMed] [Google Scholar]
- John SW, Smith RS, Savinova OV, Hawes NL, Chang B, Turnbull D, Davisson M, Roderick TH, Heckenlively JR. Essential iris atrophy, pigment dispersion, and glaucoma in DBA/2J mice. Invest Ophthalmol Vis Sci. 1998;39:951–962. [PubMed] [Google Scholar]
- Johnson MA, Drum BA, Quigley HA, Sanchez RM, Dunkelberger GR. Pattern-evoked potentials and optic nerve fiber loss in monocular laser-induced glaucoma. Invest Ophthalmol Vis Sci. 1989;30:897–907. [PubMed] [Google Scholar]
- Kaneko M, Maeda H, Frishman LJ. Effects of prolonged light adaptation on the amplitude of the a-wave of the flash ERG of the mouse. ARVO. 2006 E-Abstracts, #3095. [Google Scholar]
- Kao YH, Sterling P. Displaced GAD65 amacrine cells of the guinea pig retina are morphologically diverse. Vis Neurosci. 2006;23:931–939. doi: 10.1017/S0952523806230293. [DOI] [PubMed] [Google Scholar]
- Koyasu T, Kondo M, Miyata K, Ueno S, Miyata T, Nishizawa Y, Terasaki H. Photopic electroretinograms of mGluR6-deficient mice. Curr Eye Res. 2008;33:91–99. doi: 10.1080/02713680701823232. [DOI] [PubMed] [Google Scholar]
- Li B, Barnes GE, Holt WF. The decline of the photopic negative response (PhNR) in the rat after optic nerve transection. Doc Ophthalmol. 2005;111:23–31. doi: 10.1007/s10633-005-2629-8. [DOI] [PubMed] [Google Scholar]
- Li Y, Schlamp CL, Nickells RW. Experimental induction of retinal ganglion cell death in adult mice. Invest Ophthalmol Vis Sci. 1999;40:1004–1008. [PubMed] [Google Scholar]
- Lyubarsky AL, Falsini B, Pennesi ME, Valentini P, Pugh EN., Jr. UV- and midwave-sensitive cone-driven retinal responses of the mouse: a possible phenotype for coexpression of cone photopigments. J Neurosci. 1999;19:442–455. doi: 10.1523/JNEUROSCI.19-01-00442.1999. [DOI] [PMC free article] [PubMed] [Google Scholar]
- Ma YP, Cui J, Pan ZH. Heterogeneous expression of voltage-dependent Na+ and K+ channels in mammalian retinal bipolar cells. Vis Neurosci. 2005;22:119–133. doi: 10.1017/S0952523805222010. [DOI] [PubMed] [Google Scholar]
- Maffei L, Fiorentini A. Electroretinographic responses to alternating gratings in the cat. Exp Brain Res. 1982;48:327–334. doi: 10.1007/BF00238608. [DOI] [PubMed] [Google Scholar]
- Maffei L, Fiorentini A, Bisti S, Hollander H. Pattern ERG in the monkey after section of the optic nerve. Exp Brain Res. 1985;59:423–425. doi: 10.1007/BF00230925. [DOI] [PubMed] [Google Scholar]
- Miguel-Hidalgo JJ, Snider CJ, Angelides KJ, Chalupa LM. Voltage-dependent sodium channel alpha subunit immunoreactivity is expressed by distinct cell types of the cat and monkey retina. Vis Neurosci. 1994;11:219–228. doi: 10.1017/s0952523800001589. [DOI] [PubMed] [Google Scholar]
- Mojumder DK, Frishman LJ, Otteson DC, Sherry DM. Voltage-gated sodium channel alpha-subunits Na(v)1.1, Na(v)1.2, and Na(v)1.6 in the distal mammalian retina. Mol Vis. 2007;13:2163–2182. [PubMed] [Google Scholar]
- Mojumder DK, Sherry DM, Frishman LJ. Contribution of voltage-gated sodium channels to the b-wave of the mammalian flash electroretinogram. J Physiol. 2008;586:2551–2580. doi: 10.1113/jphysiol.2008.150755. [DOI] [PMC free article] [PubMed] [Google Scholar]
- Moon J. Changes in retinal neuronal populations in the DBA/2J mouse. Cell Tissue Res. 2005;320:51–59. doi: 10.1007/s00441-004-1062-8. [DOI] [PubMed] [Google Scholar]
- Ohtoshi A, Wang SW, Maeda H, Saszik SM, Frishman LJ, Klein WH, Behringer RR. Regulation of retinal cone bipolar cell differentiation and photopic vision by the CVC homeobox gene Vsx1. Curr Biol. 2004;14:530–536. doi: 10.1016/j.cub.2004.02.027. [DOI] [PubMed] [Google Scholar]
- Pan ZH, Hu HJ. Voltage-dependent Na(+) currents in mammalian retinal cone bipolar cells. J Neurophysiol. 2000;84:2564–2571. doi: 10.1152/jn.2000.84.5.2564. [DOI] [PubMed] [Google Scholar]
- Peachey NS, Ball SL. Electrophysiological analysis of visual function in mutant mice. Doc Ophthalmol. 2003;107:13–36. doi: 10.1023/a:1024448314608. [DOI] [PubMed] [Google Scholar]
- Perez De Sevilla Muller L, Shelley J, Weiler R. Displaced amacrine cells of the mouse retina. J Comp Neurol. 2007;505:177–189. doi: 10.1002/cne.21487. [DOI] [PubMed] [Google Scholar]
- Pfeiffer N, Tillmon B, Bach M. Predictive value of the pattern electroretinogram in high-risk ocular hypertension. Invest Ophthalmol Vis Sci. 1993;34:1710–1715. [PubMed] [Google Scholar]
- Porciatti V. The mouse pattern electroretinogram. Doc Ophthalmol. 2007;115:145–153. doi: 10.1007/s10633-007-9059-8. [DOI] [PMC free article] [PubMed] [Google Scholar]
- Porciatti V, Pizzorusso T, Cenni MC, Maffei L. The visual response of retinal ganglion cells is not altered by optic nerve transection in transgenic mice overexpressing Bcl-2. Proc Natl Acad Sci U S A. 1996;93:14955–14959. doi: 10.1073/pnas.93.25.14955. [DOI] [PMC free article] [PubMed] [Google Scholar]
- Porciatti V, Saleh M, Nagaraju M. The pattern electroretinogram as a tool to monitor progressive retinal ganglion cell dysfunction in the DBA/2J mouse model of glaucoma. Invest Ophthalmol Vis Sci. 2007;48:745–751. doi: 10.1167/iovs.06-0733. [DOI] [PMC free article] [PubMed] [Google Scholar]
- Pugh ENJ, Falsini B, Lyubarsky AL. Photostasis and Related Phenomena. Plenum Press; New York: 1998. The origin of the major rod-and cone-driven components of the rodent electroretinogram and the effect of age and light-rearing history on the magnitude of these components; pp. 98–128. [Google Scholar]
- Rangaswamy NV, Frishman LJ, Dorotheo EU, Schiffman JS, Bahrani HM, Tang RA. Photopic ERGs in patients with optic neuropathies: comparison with primate ERGs after pharmacologic blockade of inner retina. Invest Ophthalmol Vis Sci. 2004;45:3827–3837. doi: 10.1167/iovs.04-0458. [DOI] [PubMed] [Google Scholar]
- Riggs LA, Johnson EP, Schick AM. Electrical Responses of the Human Eye to Moving Stimulus Patterns. Science. 1964;144:567. doi: 10.1126/science.144.3618.567. [DOI] [PubMed] [Google Scholar]
- Robson JG, Frishman LJ. Response linearity and kinetics of the cat retina: the bipolar cell component of the dark-adapted electroretinogram. Vis Neurosci. 1995;12:837–850. doi: 10.1017/s0952523800009408. [DOI] [PubMed] [Google Scholar]
- Robson JG, Saszik SM, Ahmed J, Frishman LJ. Rod and cone contributions to the a-wave of the electroretinogram of the macaque. J Physiol. 2003;547:509–530. doi: 10.1113/jphysiol.2002.030304. [DOI] [PMC free article] [PubMed] [Google Scholar]
- Saszik SM, Robson JG, Frishman LJ. The scotopic threshold response of the dark-adapted electroretinogram of the mouse. J Physiol. 2002;543:899–916. doi: 10.1113/jphysiol.2002.019703. [DOI] [PMC free article] [PubMed] [Google Scholar]
- Sharma S, Ball SL, Peachey NS. Pharmacological studies of the mouse cone electroretinogram. Vis Neurosci. 2005;22:631–636. doi: 10.1017/S0952523805225129. [DOI] [PubMed] [Google Scholar]
- Sherry DM, Heidelberger R. Distribution of proteins associated with synaptic vesicle endocytosis in the mouse and goldfish retina. J Comp Neurol. 2005;484:440–457. doi: 10.1002/cne.20504. [DOI] [PubMed] [Google Scholar]
- Sherry DM, Wang MM, Frishman LJ. Differential distribution of vesicle associated membrane protein isoforms in the mouse retina. Mol Vis. 2003;9:673–688. [PubMed] [Google Scholar]
- Shirato S, Maeda H, Miura G, Frishman LJ. Postreceptoral contributions to the light-adapted ERG of mice lacking b-waves. Exp Eye Res. 2008;86:914–928. doi: 10.1016/j.exer.2008.03.008. [DOI] [PMC free article] [PubMed] [Google Scholar]
- Sieving PA, Murayama K, Naarendorp F. Push-pull model of the primate photopic electroretinogram: a role for hyperpolarizing neurons in shaping the b-wave. Vis Neurosci. 1994;11:519–532. doi: 10.1017/s0952523800002431. [DOI] [PubMed] [Google Scholar]
- Slaughter MM, Miller RF. 2-amino-4-phosphonobutyric acid: a new pharmacological tool for retina research. Science. 1981;211:182–185. doi: 10.1126/science.6255566. [DOI] [PubMed] [Google Scholar]
- Slaughter MM, Miller RF. An excitatory amino acid antagonist blocks cone input to sign-conserving second-order retinal neurons. Science. 1983;219:1230–1232. doi: 10.1126/science.6131536. [DOI] [PubMed] [Google Scholar]
- Trimarchi C, Biral G, Domenici L, Porciatti V, Bisti S. The flash- and pattarn-electroretinogram generators in the cat: a pharmacological approach. Clin Vis Sci. 1990;6:19–24. [Google Scholar]
- Ventura LM, Porciatti V, Ishida K, Feuer WJ, Parrish RK., 2nd Pattern electroretinogram abnormality and glaucoma. Ophthalmology. 2005;112:10–19. doi: 10.1016/j.ophtha.2004.07.018. [DOI] [PMC free article] [PubMed] [Google Scholar]
- Viswanathan S, Frishman LJ, Robson JG. The uniform field and pattern ERG in macaques with experimental glaucoma: removal of spiking activity. Invest Ophthalmol Vis Sci. 2000;41:2797–2810. [PubMed] [Google Scholar]
- Viswanathan S, Frishman LJ, Robson JG, Harwerth RS, Smith EL., 3rd The photopic negative response of the macaque electroretinogram: reduction by experimental glaucoma. Invest Ophthalmol Vis Sci. 1999;40:1124–1136. [PubMed] [Google Scholar]
- Viswanathan S, Frishman LJ, Robson JG, Walters JW. The photopic negative response of the flash electroretinogram in primary open angle glaucoma. Invest Ophthalmol Vis Sci. 2001;42:514–522. [PubMed] [Google Scholar]
- Wachtmeister L. Oscillatory potentials in the retina: what do they reveal. Prog Retin Eye Res. 1998;17:485–521. doi: 10.1016/s1350-9462(98)00006-8. [DOI] [PubMed] [Google Scholar]
- Wang MM, Janz R, Belizaire R, Frishman LJ, Sherry DM. Differential distribution and developmental expression of synaptic vesicle protein 2 isoforms in the mouse retina. J Comp Neurol. 2003;460:106–122. doi: 10.1002/cne.10636. [DOI] [PubMed] [Google Scholar]
- Wassle H, Chun MH, Muller F. Amacrine cells in the ganglion cell layer of the cat retina. J Comp Neurol. 1987;265:391–408. doi: 10.1002/cne.902650308. [DOI] [PubMed] [Google Scholar]
- Xiang M, Zhou L, Macke JP, Yoshioka T, Hendry SH, Eddy RL, Shows TB, Nathans J. The Brn-3 family of POU-domain factors: primary structure, binding specificity, and expression in subsets of retinal ganglion cells and somatosensory neurons. J Neurosci. 1995;15:4762–4785. doi: 10.1523/JNEUROSCI.15-07-04762.1995. [DOI] [PMC free article] [PubMed] [Google Scholar]
- Xu L, Ball SL, Alexander KR, Peachey NS. Pharmacological analysis of the rat cone electroretinogram. Vis Neurosci. 2003;20:297–306. doi: 10.1017/s0952523803203084. [DOI] [PubMed] [Google Scholar]
- Zenisek D, Henry D, Studholme K, Yazulla S, Matthews G. Voltage-dependent sodium channels are expressed in nonspiking retinal bipolar neurons. J Neurosci. 2001;21:4543–4550. doi: 10.1523/JNEUROSCI.21-13-04543.2001. [DOI] [PMC free article] [PubMed] [Google Scholar]