

Abstract
Single-molecule force measurement opens a new door for investigating detailed biomolecular interactions and their thermodynamic properties by pulling molecules apart while monitoring the force exerted on them. Recent advances in the nonequilibrium work theorem allows one to determine the free energy landscapes of these events. Such information is valuable for understanding processes such as protein and RNA folding and receptor-ligand binding. Here we used force as a physical parameter under the traditional chemical and temperature denaturing environment, to alter the protein folding energy landscape and compared the change in unfolding free energy barrier of the I27 domain of human cardiac titin. We found that the trends in protein unfolding free energy barriers are consistent for single-molecule force measurements and bulk chemical and temperature studies. The results suggest that the information from single-molecule pulling experiments are meaningful and useful for understanding the mechanism of folding of titin I27.
Introduction
Single-molecule manipulation and force measurement allows us to investigate interaction on a molecular basis. The development of this manipulation technique has made a quantum leap on the events that can be examined in detail.1-11 For example, mechanical properties of molecules can be studied with stretch-release cycle at the single-molecule level, 12-14 and the reaction rates of receptor-ligand binding.15,16 and protein folding17 are increased to allow one to observe the event at laboratory time scales. Protein misfolding, in particular, has been linked to diseases such as Alzheimer's disease and Parkinson's disease.18,19 The technique made it possible for us not only to observe the beginning and the end states, but also to follow the entire trajectory, which provides much needed information about the detailed mechanisms of these complex biomolecular processes.
A detailed study by Cao and Li on protein mechanical unfolding in solution containing chemical denaturants has demonstrated that combining chemical and mechanical unfolding provides important additional information about the folding/unfolding process. 20 They have observed a softening effect of the chemical denaturant on the resistance to mechanical unfolding of a small protein GB1, and denaturant does not change the distance between the folded and transition states. The rich information contained in chemical, thermal, and mechanical unfolding has just begun to be explored, and the interplay among these different chemical and physical effects on protein folding offers great opportunity to explore the complex protein folding landscape 21-23 from a different viewpoint. One question is how to compare the results from different studies. The measured values in single-molecule manipulation techniques are usually expressed as force versus distance, which has obvious meanings in systems such as molecular motors and muscle proteins. However, the end-to-end distance is not a typical order parameter for reactions such as protein folding. 24,25 Free energy surfaces as a function of end-to-end distance of molecules have been reconstructed from force measurements.7,26-31 However, the lowest free energy pathway, usually determined by chemical or temperature perturbations,32-35 is simply defined using the reactant and the product in the reaction coordinate. Here we investigate the mechanical unfolding of the I27 domain from human cardiac titin under thermal and chemical denaturing conditions. We compare the results from mechanical to chemical and thermal unfolding and found that similar trends exist. Such evidence suggests that mechanical and chemical unfolding of titin I27 follow a similar reaction coordinate.
Experimental Section
Titin I27 sample preparation
We used engineered recombinant protein chains of eight serial repeats of I27 domains of human cardiac titin (Athena ES, Baltimore, MD). Solution of 10 μl of protein at a concentration of 50-100 μg/ml was deposited on a fresh gold surface and incubated at room temperature for 10-20 min. The protein sample was rinsed with 1-2 ml phosphate buffered saline (PBS). For temperature dependent measurements, the protein sample was incubated for one hour at a given temperature between 25-37 °C. For measurements dependent on denaturant concentration, 100 μl of guanidinium hydrochloride (GdmCl) solution at concentrations ranging from 0.2-2.0 M was added to the protein sample.
Force Measurements
Protein stretching measurements were done using a Multimode atomic force microscope (AFM) with PicoForce option (Veeco Instruments, Santa Barbara, CA). The spring constant for MLCT cantilevers (Veeco Probes, Camarillo, CA), determined using equipartition theorem, was 0.05 N/m. Individual molecules were attached to the cantilever tip via a nonspecific binding interaction and stretched as the piezoelectric stage moved at constant velocity. Force-extension measurements were performed in solution, at pulling velocities of 0.30 and 1.00 μm/s. For temperature dependent measurements, the protein solution temperature was maintained within ± 0.1 °C using a temperature controller (Veeco Instruments, Santa Barbara, CA). For measurements dependent on denaturant concentration, molecules were stretched at room temperature and a pH of 7.4 ± 0.1.
Reconstructing free energy landscapes using Jarzynski's equality
Force-extension measurements were analyzed using Jarzynski's equality and previously described methods7 to determine equilibrium free energy surfaces for the unfolding of titin I27. We used an exact relationship derived by Hummer and Szabo27 that determines the free energy as a function of molecular end-to-end distance G(z) from force-time data. The unfolding free energy barrier, ΔG‡, was calculated using the reconstructed free energy landscape at the transition state, and an assumption based on Bell's model.36
Results and Discussion
To measure the force-induced unfolding of single molecules, we used AFM to stretch titin molecules containing 8 identical I27 domains, as illustrated in Figure 1a. Protein molecules were pulled under solutions at various temperatures and guanidinium hydrochloride (GdmCl) concentrations. Typical force-extension curves taken at various temperatures are shown in Figure 1b.
Figure 1. AFM experimental setup and force-extension curves.
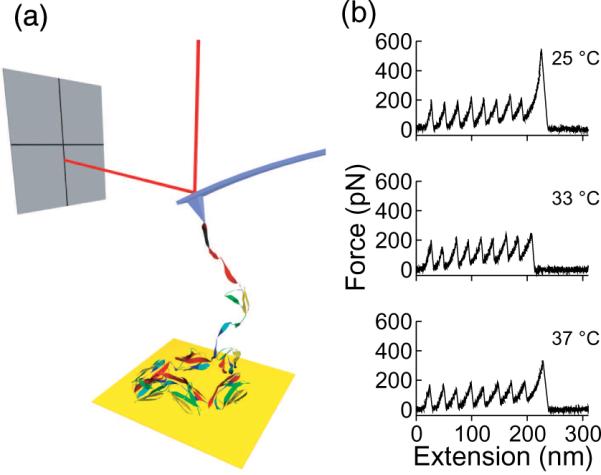
(a) An illustration of the AFM experimental setup. One end of the molecule is attached to the gold surface and the other end to the silicon nitride cantilever. The force on the molecule is measured by the laser displacement which is caused by the bending of the cantilever. (b) Representative force-extension curves of 8 serially linked titin I27, obtained at different temperatures. Each peak represents an unfolding event of an I27 domain, with the last peak resulting from detachment of the molecule from the cantilever. The force peak decreases with increasing temperature without altering its characteristics.
We determined the statistics of the peak force distribution as a function of temperature and chemical denaturant concentrations, as shown in Figure 2a. The distribution shifted to lower forces as the temperature increases, which is consistent with the expectation that the free energy barrier of protein unfolding is lower with increasing temperature. 37 The most probable unfolding force as a function of temperature, obtained at 0.3 μm/s and 1 μm/s pulling velocities, is displayed in Figure 2b. Both data sets show the force peaks decrease with temperature linearly, which agrees with the trend predicted by simulation,38 and observed experimentally in other proteins.39 We have observed a similar trend when adding chemical denaturant (GdmCl); the unfolding force decreases with increasing concentration linearly, which has been observed in another protein. 20
Figure 2. Unfolding force as a function of temperature.

(a) Unfolding force distribution of titin I27 at different temperatures. The peak of the distribution shifted from 200 pN at 25 °C to 180 pN at 37 °C. (b) The most probable unfolding force, determined by fitting the distribution in (a) with Gaussian distribution, is temperature dependent. The two lines represent the experiments done at two different pulling velocities. Circle: 1 μm/s; square: 0.3 μm/s. The error bars represent one standard error.
To compare the results with chemical unfolding quantitatively, we determined the free energy surface of unfolding as a function of molecular extension using Jarzynski's equality. The free energy barrier ΔG‡ of unfolding was obtained from the G curve.7,36 Figure 3 shows ΔG‡ as a function of denaturant concentration and temperature. Note that due to the nonequilibrium nature of the technique, the value of the force peak depends on pulling velocity, while the equilibrium free energy determined from Jarzynski's equality does not. This further verifies the method used and the consistency in trends that resulted from temperature dependent unfolding characteristics. Similar temperature dependence in kinetic rate has been observed in chemical unfolding kinetic studies. 37 Using ΔG‡ = ΔH‡ - TΔS‡, where ΔH‡ and ΔS‡ are the enthalpy and the entropy change from folded to transition states, we obtained ΔH‡ = 29 kcal/mol and ΔS‡ = 0.06 kcal/mol·T. These values are in general agreement with the free energy estimates derived from bulk kinetic rate studies. 37 Figure 3b shows ΔG‡ at GdmCl concentrations less than 2M, where most of the initial states are folded. Using ΔG‡ = ΔG‡(H2O) - m[M], we determined the m value from single-molecule pulling experiments to be 0.17 ± 0.07 kcal/mol·M. This compares favorably with m = 0.15 kcal/mol·M from ensemble measurements.40 In addition, using the unfolding rate ku determined from chemical denaturant studies and the free energy ΔG‡ from current single-molecule force measurement, we found that the prefactor k0 in ku = k0eΔG‡/kBT is on the order of 105 s-1, which is roughly constant with respect to temperature and chemical denaturant concentrations within the range studied. The prefactor is in good agreement with simulations41 (105 s-1) and falls within the range predicted by Kramers theory32 (104-107 s-1). Note that the numbers presented above may not be taken at their absolute values, since the uncertainty in the estimated distance between folded and transition states carries directly to that in the free energy estimate. However, assuming the chemical denaturants do not alter the distance,20 the change in the resulting m value will be linearly proportional to the change in distance, but not the direction, i. e. the sign of the slope, and we will focus on the general trends of unfolding free energy barrier as denaturant and temperature increase.
Figure 3. Change in free energies as a function of temperature and denaturant concentration.

(a) Change in ΔG‡ as a function of temperature. The two sets of data were done at two different pulling velocities. Circle: 1.0 μm/s; square: 0.3 μm/s. (b) Change in ΔG‡ as a function of denaturant concentration. The uncertainty in the data, calculated using the bootstrap method, is 0.7 kcal/mol.
The consistency in the trends from both the temperature and denaturant dependent studies indicate that the unfolding transition state from single-molecule force measurement is in the vicinity of that from chemical studies in the free energy landscape. Note that both techniques probe equilibrium properties, with force measurements determining the free energy ΔG‡ at equilibrium, i.e. zero force, and chemical denaturant extrapolating the kinetic rate constant ku to zero denaturant concentration. Assuming that the assumption for extrapolation is correct, the only difference is the reaction coordinate, where force measurement has the molecular end-to-end distance as a constraint. The similarity in trends from both temperature (seen in ΔS‡) and chemical (seen in m value) studies suggests that external perturbation tilted the free energy landscape by similar magnitude for both force and chemical reaction coordinates. Hence, the pathway for forced unfolding is expected to be close to that of the chemical unfolding, as illustrated in Figure 4. This is understandable since the size of the molecule, i.e. the radius of gyration, is often used to define the folded and unfolded state, and the size as well as the molecular end-to-end distance of the molecule generally increases monotonically from folded, transition, to unfolded state. As illustrated in Figure 4, these two processes likely pass over similar free energy surfaces through the transition state to the unfolded state.
Figure 4. Schematic representation of the free energy landscape of titin I27.

Solid line represents the free energy pathway probed by single-molecule force measurement and dashed line indicates the reaction coordinate followed by chemical denaturant. The chemical method results in unfolding through the lowest free energy pathway, but only probes the folded (F), transition (T), and compact unfolded states, while force measurement probes the entire pathway, including that from compact unfolded to stretched states (U). The pathway probed by force measurement may be slightly different from that of chemical denaturant because the constraint of molecular end-to-end distance, but is not expected to differ significantly because the change in free energy landscape shows similar trends for both methods.
Conclusion
In conclusion, we presented studies of temperature and chemical denaturant dependence of mechanical unfolding of titin I27. The unfolding free energy barrier decreases linearly with increasing temperature or chemical denaturant concentrations. This suggests that, at least for titin I27, the molecular end-to-end distance is a good reaction coordinate. Instead of being a passive observer who only sees the initial and final states of an individual event, single-molecule manipulation allows us to follow the entire trajectory and quantify the observables of the process. The values of free energies determined will allow theories and models to be tested. In addition, single-molecule manipulation enables one to determine the region of the free energy landscape that is not probed with bulk studies, hence it allows one to map the entire protein folding landscape, including the highly stretched form, which resemble the conformation of the molecules when first synthesized.
Acknowledgement
We thank NSF DMR-0505814, NIH training fellowships 1T90DK70121 and 5T32GM008362, and Welch Foundation No. C-1632 for support.
References
- (1).Fernandez JM, Chu S, Oberhauser AF. Science. 2001;292:653–654. doi: 10.1126/science.1060884. [DOI] [PubMed] [Google Scholar]
- (2).Danilowicz C, Coljee VW, Bouzigues C, Lubensky DK, Nelson DR, Prentiss M. Proc. Natl. Acad. Sci. USA. 2003;100:1694–1699. doi: 10.1073/pnas.262789199. [DOI] [PMC free article] [PubMed] [Google Scholar]
- (3).Cecconi C, Shank EA, Bustamante C, Marqusee S. Science. 2005;309:2057–2060. doi: 10.1126/science.1116702. [DOI] [PubMed] [Google Scholar]
- (4).Sotomayor M, Schulten K. Science. 2007;316:1144–1148. doi: 10.1126/science.1137591. [DOI] [PubMed] [Google Scholar]
- (5).Mickler M, Dima RI, Dietz H, Hyeon C, Thirumalai D, Rief M. Proc. Natl. Acad. Sci. USA. 2007;104:20268Ű–20273. doi: 10.1073/pnas.0705458104. [DOI] [PMC free article] [PubMed] [Google Scholar]
- (6).Greenleaf WJ, Frieda KL, Foster DAN, Woodside MT, Block SM. Science. 2008;319:630–633. doi: 10.1126/science.1151298. [DOI] [PMC free article] [PubMed] [Google Scholar]
- (7).Harris NC, Song Y, Kiang C-H. Phys. Rev. Lett. 2007;99:068101. doi: 10.1103/PhysRevLett.99.068101. [DOI] [PMC free article] [PubMed] [Google Scholar]
- (8).Storm AJ, Chen JH, Ling XS, Zandbergen HW, Dekker C. Nat. Mater. 2003;2:537–540. doi: 10.1038/nmat941. [DOI] [PubMed] [Google Scholar]
- (9).Zlatanova J, Lindsay SM, Leuba SH. Prog. Biophys. Mol. Biol. 2000;74:37–61. doi: 10.1016/s0079-6107(00)00014-6. [DOI] [PubMed] [Google Scholar]
- (10).Cocco S, Monasson R, Marko JF. Proc. Natl. Acad. Sci. USA. 2001;98:8608–8613. doi: 10.1073/pnas.151257598. [DOI] [PMC free article] [PubMed] [Google Scholar]
- (11).Cross SE, Jin Y-S, Rao J, Gimzewski JK. Nanotechnology. 2007;2:780–783. doi: 10.1038/nnano.2007.388. [DOI] [PubMed] [Google Scholar]
- (12).Lee G, Abdi K, Jiang Y, Michaely P, Bennett V, Marszalek PE. Nature. 2006;440:246–249. doi: 10.1038/nature04437. [DOI] [PubMed] [Google Scholar]
- (13).Gerland U, Bundschuh R, Hwa T. Biophys. J. 2003;84:2831–2840. doi: 10.1016/S0006-3495(03)70012-5. [DOI] [PMC free article] [PubMed] [Google Scholar]
- (14).Qian H. J. Phys. Chem. B. 2002;106:2065–2073. [Google Scholar]
- (15).Florin E-L, Moy VT, Gaub HE. Science. 1994;264:415–417. doi: 10.1126/science.8153628. [DOI] [PubMed] [Google Scholar]
- (16).Evans EA, Calderwood DA. Science. 2007;316:1148–1153. doi: 10.1126/science.1137592. [DOI] [PubMed] [Google Scholar]
- (17).Braun O, Hanke A, Seifert U. Phys. Rev. Lett. 2004;93:158105. doi: 10.1103/PhysRevLett.93.158105. [DOI] [PubMed] [Google Scholar]
- (18).Sawaya MR, Sambashivan S, Nelson R, Ivanova MI, Sievers SA, Apostol MI, Thompson MJ, Balbirnie M, Wiltzius JJW, McFarlane HT, Madsen AO, Riekel C, Eisenberg D. Nature. 2007;447:453–457. doi: 10.1038/nature05695. [DOI] [PubMed] [Google Scholar]
- (19).Baumketner A, Krone MG, Shea J-E. Proc. Natl. Acad. Sci. USA. 2008;105:6027–6032. doi: 10.1073/pnas.0708193105. [DOI] [PMC free article] [PubMed] [Google Scholar]
- (20).Cao Y, Li H. J. Mol. Biol. 2008;375:316–324. doi: 10.1016/j.jmb.2007.10.024. [DOI] [PubMed] [Google Scholar]
- (21).Frauenfelder H, McMahon BH, Austin RH, Chu K, Groves JT. Proc. Natl. Acad. Sci. USA. 2001;98:2370–2374. doi: 10.1073/pnas.041614298. [DOI] [PMC free article] [PubMed] [Google Scholar]
- (22).Plotkin SS, Onuchic JN. Q. Rev. Biophys. 2002;35:111–167. doi: 10.1017/s0033583502003761. [DOI] [PubMed] [Google Scholar]
- (23).Hu H, Lu Z, Parks JM, Burger SK, Yang W. J. Chem. Phys. 2008;128:034105-1–034105-18. doi: 10.1063/1.2816557. [DOI] [PubMed] [Google Scholar]
- (24).Socci ND, Onuchic JN, Wolynes PG. Proc. Natl. Acad. Sci. USA. 1999;96:2031–2035. doi: 10.1073/pnas.96.5.2031. [DOI] [PMC free article] [PubMed] [Google Scholar]
- (25).S̆ali A, Shakhnovich E, Karplus M. Nature. 1994;369:248–251. doi: 10.1038/369248a0. [DOI] [PubMed] [Google Scholar]
- (26).Jarzynski C. Phys. Rev. Lett. 1997;78:2690–2693. [Google Scholar]
- (27).Hummer G, Szabo A. Proc. Natl. Acad. Sci. USA. 2001;98:3658–3661. doi: 10.1073/pnas.071034098. [DOI] [PMC free article] [PubMed] [Google Scholar]
- (28).Liphardt J, Dumont S, Smith SB, Tinoco I, Jr., Bustamante C. Science. 2002;296:1832–1835. doi: 10.1126/science.1071152. [DOI] [PubMed] [Google Scholar]
- (29).Preiner J, Janovjak H, Rankl C, Knaus H, Cisneros DA, Kedrov A, Kienberger F, Müller DJ, Hinterdorfer P. Biophys. J. 2007;93:930–937. doi: 10.1529/biophysj.106.096982. [DOI] [PMC free article] [PubMed] [Google Scholar]
- (30).Nome RA, Zhao JM, Hoff WD, Scherer NF. Proc. Natl. Acad. Sci. USA. 2007;104:20799–20804. doi: 10.1073/pnas.0701281105. [DOI] [PMC free article] [PubMed] [Google Scholar]
- (31).Imparato A, Luccioli S, Torcini A. Phys. Rev. Lett. 2007;99:168101. doi: 10.1103/PhysRevLett.99.168101. [DOI] [PubMed] [Google Scholar]
- (32).Schuler B, Lipman EA, Eaton WA. Nature. 2002;419:743–747. doi: 10.1038/nature01060. [DOI] [PubMed] [Google Scholar]
- (33).Möglich A, Krieger F, Kiefhaber T. J. Mol. Biol. 2005;345:153–162. doi: 10.1016/j.jmb.2004.10.036. [DOI] [PubMed] [Google Scholar]
- (34).Meisner WK, Sosnick TR. Proc. Natl. Acad. Sci. USA. 2004;101:13478–13482. doi: 10.1073/pnas.0404057101. [DOI] [PMC free article] [PubMed] [Google Scholar]
- (35).Leeson DT, Gai F, Rodriguez HM, Gregoret LM, Dyer RB. Proc. Natl. Acad. Sci. USA. 2000;97:2527–2532. doi: 10.1073/pnas.040580397. [DOI] [PMC free article] [PubMed] [Google Scholar]
- (36).Harris NC, Song Y, Kiang C-H. Phys. Rev. Lett. 2008;100:019802. [Google Scholar]
- (37).Wright CF, Steward A, Clarke J. J. Mol. Biol. 2004;338:445–451. doi: 10.1016/j.jmb.2004.02.062. [DOI] [PubMed] [Google Scholar]
- (38).Cieplak M, Hoang TX, Robbins MO. Proteins: Struct. Funct. Bioinf. 2004;56:285–297. doi: 10.1002/prot.20081. [DOI] [PubMed] [Google Scholar]
- (39).Janovjak H, Kessler M, Oesterhelt D, Gaub H, Müller DJ. EMBO J. 2003;22:5220–5229. doi: 10.1093/emboj/cdg509. [DOI] [PMC free article] [PubMed] [Google Scholar]
- (40).Carrion-Vazquez M, Oberhauser AF, Fowler SB, Marszalek PE, Broedel SE, Clarke J, Fernandez JM. Proc. Natl. Acad. Sci. USA. 1999;96:3694–3699. doi: 10.1073/pnas.96.7.3694. [DOI] [PMC free article] [PubMed] [Google Scholar]
- (41).Li MS, Klimov DK, Thirumalai D. Polymer. 2004;45:573–579. [Google Scholar]