Abstract
Flow visualization is used to interrogate the wake structure produced by a rigid flat panel of aspect ratio (span/chord) 0.54 pitching in a free stream at a Strouhal number of 0.23. At such a low aspect ratio, the streamwise vorticity generated by the plate tends to dominate the formation of the wake. Nevertheless, the wake has the appearance of a three-dimensional von Kármán vortex street, as observed in a wide range of other experiments, and consists of horseshoe vortices of alternating sign shed twice per flapping cycle. The legs of each horseshoe interact with the two subsequent horseshoes in an opposite-sign, then like-sign interaction in which they become entrained. A detailed vortex skeleton model is proposed for the wake formation.
1. Introduction
The pitching and/or heaving of high-aspect-ratio airfoils has been shown to produce two or more spanwise vortices per flapping cycle (e.g. Koochesfahani 1989; Ohmi et al. 1990, 1991; Anderson et al. 1998). Similar structures have also been identified by Williamson & Roshko (1988) in the wakes of cylinders in cross-flow under forced lateral oscillations.
When the foil has a finite aspect ratio, spanwise vorticies shed from the body are connected to vorticies with a significant streamwise component. As the aspect ratio becomes smaller, the influence of the streamwise vorticity increases, and the proportion of spanwise vorticity diminishes. The dynamics of the streamwise vorticity and the wake structure produced by such finite-aspect-ratio bodies is not well-understood. Because the wings of birds and insects, and the fins of aquatic animals are of finite aspect ratio, understanding the wakes produced by these geometries may yield insight into the physical mechanisms of biological locomotion in fluids.
Flow visualization was used by von Ellenrieder, Parker & Soria (2003) to investigate the wake structure produced by a pitching and heaving wing with an aspect ratio 3.0 and a Strouhal number between 0.2 and 0.4. Here, the strouhal number St = f A/U, where f is the flapping frequency, A is the double-amplitude of the heave motion at the quarter-chord point, and U is the free-stream velocity. The chord Reynolds number was ReC = 164. Their wake model consisted of a pair of merged vortex rings – with origins at the leading and trailing edges of the wing – shed each half-cycle, and joined to form a zig-zag chain, sometimes with additional appendages. Guglielmini (2004) simulated this experiment for Strouhal numbers of 0.175 and 0.35, and represented the wake with isosurfaces of vorticity magnitude, pressure, and swirl according to the criterion proposed by Jeong & Hussain (1995). Her computations at St = 0.175 revealed a chain of simple vortex rings of alternating sign, but at St = 0.35 the wake was found to divide into two chains of vortical structures with an appearance very different from that observed in the experiments by von Ellenrieder et al. (2003). Dong et al. (2005) computed the flow field produced by a pitching and heaving foil of elliptical planform and cross-section at St = 0.6 with aspect ratios between 1.27 and 5.09 and chord Reynolds number between 100 and 400. Despite the significant variation in thrust production and efficiency within this range of parameters, the wake topology is quite robust, consisting of two trains of vortex rings expanding away from each other in the direction of transverse motion of the foil. Govardhan & Williamson (2005) recently examined the behaviour of a vibrating sphere in a freestream. They present three-dimensional renderings of wake structures assembled from planar digital particle image velocimetry (DPIV) measurements. The wakes consist of an alternating chain of hairpin loops oriented in the streamwise direction with maximum circulation near the tips.
Finite-aspect-ratio thrusters have also been studied in the context of swimming fish. For instance, Drucker & Lauder (1999) used DPIV to investigate the flow induced by oscillating pectoral fins of bluegill sunfish. Using planar vorticity fields in two orthogonal planes, they inferred a chain of vortex rings of alternating sign joined together to produce, in the mean, a jet that propels the fish forward. In a very different experiment, Perry & Chong (1987) produced a qualitatively similar structure with a steady laterally oscillated co-flowing jet.
The present work is distinguished from other studies of oscillating foils by two attributes. First, the flat plate used in this experiment is attached at its leading edge to the trailing edge of a stationary fairing, thus inhibiting generation of the dynamic stall vortex observed in the other cases. As a result, structures observed in the wake are shed primarily from the three remaining edges of the panel. Second, we examine a significantly lower aspect ratio than examined in previous studies of oscillating foils (S/C = 0.54). For such low-aspect-ratio cases, vorticity generated by the streamwise edges can dominate the evolution of the wake, and is dynamically more important than the spanwise vorticity.
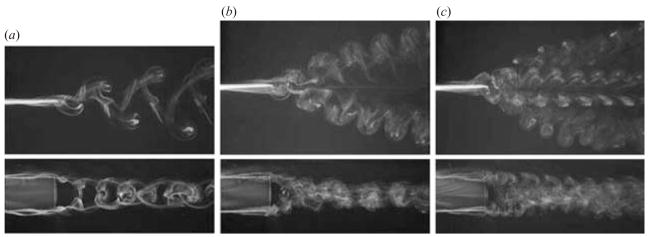
With increasing Strouhal number, two transitions in wake structure have so far been observed, which separate three notably different patterns in the wake, as illustrated in figure 1, from Buchholz & Smits (2005). In this case the length scale used in calculating the Strouhal number is the double-amplitude of the trailing edge. For a range of Strouhal numbers between approximately 0.20 and 0.25 a simple pattern resembling a three-dimensional von Kármán vortex street is observed. With increasing Strouhal number the wake divides, forming what appears to be two separate trains of vortex structures accompanied by an increased spanwise compression. There does not appear to be a distinct transition point, as the growth angle of the wake increases uniformly with increasing Strouhal number. For Strouhal numbers greater than approximately 0.5, some of the shed vorticity evolves into hairpins that convect outward in the spanwise direction under their own self-induction, making the wake appear much broader in the spanwise direction. Here we describe the vortical structure of the wake at St = 0.23 (figure 1a). While this pattern is only observed for a relatively narrow range of Strouhal numbers, it is important because of the resemblance it bears to other wakes generated in very different circumstances, and because it can be used to establish a paradigm by which we may be able to understand vortex evolution at higher Strouhal numbers.
Figure 1.
Top and side views of dye visualization of wakes at varying Strouhal numbers, ReC = 640. (a) St = 0.23, (b) St = 0.43, (c) St = 0.64. These images appear in Buchholz & Smits (2005), reproduced with permission of AIP and the authors. A colour version of this figure may be found at http://gasdyn.princeton.edu.
2. Experiments
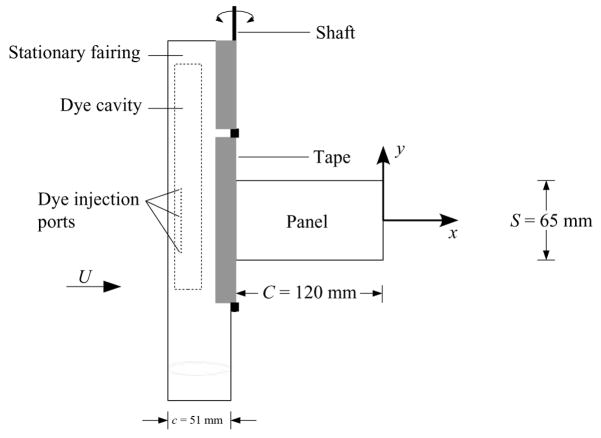
Experiments were conducted with a pitching rectangular acrylic panel of 120 mm chord C, 65 mm span S, and 2.5 mm thickness, giving an aspect ratio S/C = 0.54. The leading edge of the panel is fixed to a 3.2 mm diameter shaft adjacent to the trailing edge of a stationary fairing, as illustrated in figure 2. The shaft is driven in a periodic pitching motion by a four-bar linkage mechanism (ratio of connecting rod length to driving crank length of 58). The origin of the right-handed coordinate system is located at the middle of the trailing edge when the panel chord is parallel to the free stream.
Figure 2.
Geometry of panel and fairing assembly.
The fairing cross-section is a NACA 0020 airfoil of 54 mm chord with the trailing edge truncated at 51 mm. Two cavities in the fairing facilitate the introduction of dye on each side through fifteen 0.8 mm holes spaced at 3.2 mm intervals in a spanwise line 12.7 mm from the leading edge of the fairing. Sulforhodamine B dye (Sigma-Aldrich 230162) is injected through one set of holes and fluorescein (Sigma-Aldrich 166308) through the other. Both dyes have a concentration of 0.10 g in 2.00 l of water. A 2 mm gap between the trailing-edge of the fairing and the shaft is spanned by a strip of tape to prevent flow through the gap and to streamline the transistion between the fairing and the panel.
Experiments were conducted in a water channel of width 0.46 m and depth 0.29 m. A clear acrylic plate of dimensions 0.46 m × 0.61 m was mounted in contact with the water surface to eliminate image distortion caused by the free surface. The Strouhal number was 0.23, based on the double amplitude of the trailing-edge motion, A = 20 mm, and U = 5.3 mm s−1. The Reynolds number based on the chord of the panel was ReC = 640.
Three methods were used to illuminate the dye patterns produced by the pitching panel: white halogen light, a laser scanning apparatus capable of illuminating 20 successive parallel planes, and a single laser sheet formed using an optical fibre delivery system with a Powell lens (Oz Optics, Inc.). Photographs presented here were taken using the first two methods. Video and photographic data were obtained using a mini DV video camera (NTSC) and a Redlake HG-LE 8-bit monochrome CCD camera. Figure 3 illustrates the apparatus configured for white-light dye visualization. The positions of the camera and halogen lamp can be interchanged to visualize the flow from the top and the side.
Figure 3.
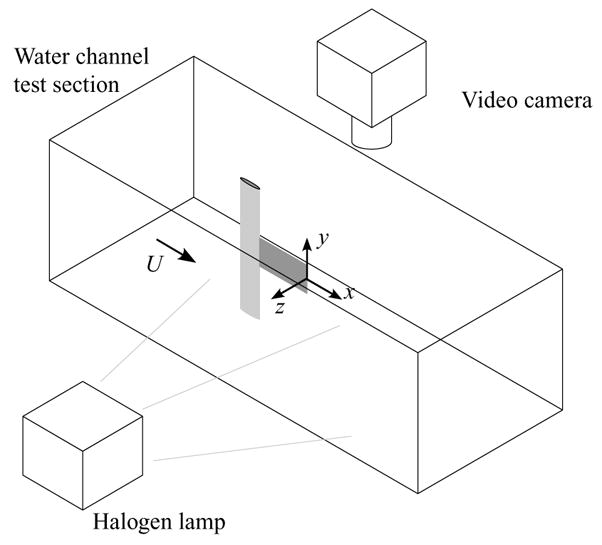
Experimental setup: white-light flow visualization.
The laser scanning system was developed by Delo, Kelso & Smits (2004). It consists of a drum with twenty faces and a mirror mounted at 45° to the normal of each face. A laser beam parallel to the drum axis impinges on each mirror as it passes by, sweeping the beam through a plane normal to the axis of rotation, as indicated in figure 4. The passage of each mirror triggers the electronic shutter of the CCD camera which has sufficient exposure time for the laser beam to sweep through the field of view. With each rotation of the drum, 20 images are acquired in a stack of parallel planes spaced 8 mm apart. A stepper motor drives the drum at 2.0 to 2.3 revolutions per second, resulting in data acquisition at 40 to 46 frames per second.
Figure 4.
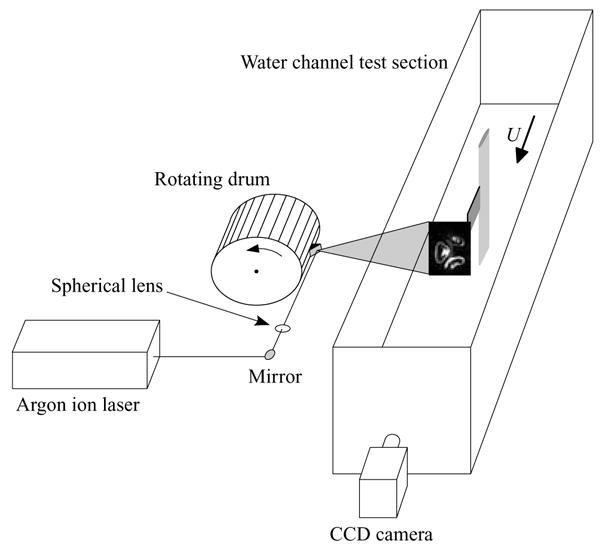
Data acquisition setup with scanning laser beam.
DPIV was used in the present case to support interpretation of the flow visualization data obtained by the rotating drum. DPIV data were obtained using a CCD camera with 2048 × 2048 × 12 bit resolution and a double-pulse Nd:YAG laser. The flow was seeded with 14 μm silver-coated hollow glass spheres, and cross-correlations were conducted with 64 × 64 and subsequently 32 × 32 pixel window sizes with 50 % overlap.
3. Wake structure
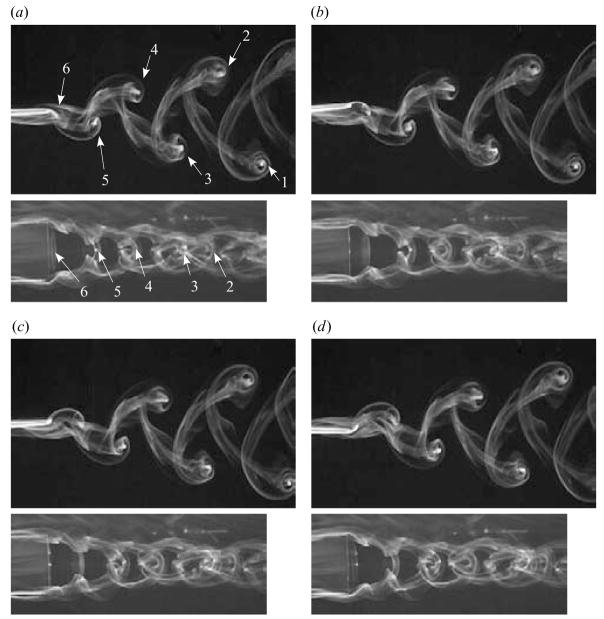
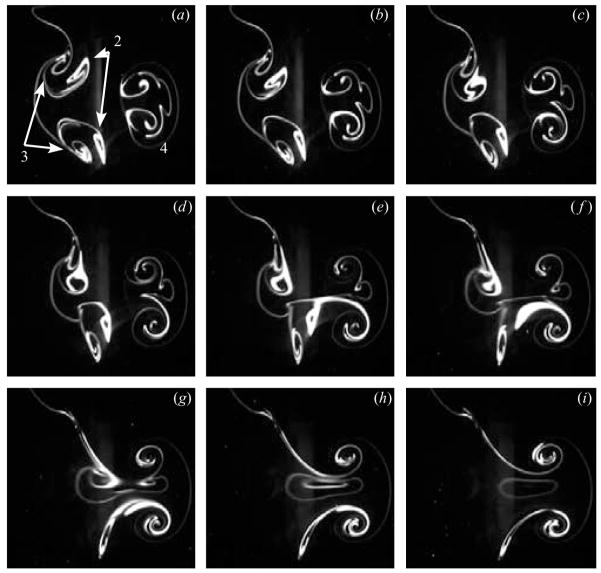
Figure 5 shows top and side views of the wake (obtained at different times) illuminated with white light. From the perspective of the top view, the phase angle φ is defined to be zero when the panel is in the neutral position (aligned parallel to the free stream) with the trailing edge moving upward (rotating counterclockwise). In figure 5(a) the panel is at φ = 22.5°. Twice per flapping cycle, vorticity shed from the three free edges of the panel forms a horseshoe vortex that is the main constituent of the wake. The tips of horseshoes visible in these images are labelled in the chronological order of their creation. From the top, the wake has the appearance of a von Kármán vortex street, whereas from the side it resembles a chain of linked vortex rings. The dye patterns did not reveal any flow separation at the leading edge of the panel.
Figure 5.
Top and side views at phases spanning one half-period of oscillation. Phases are (a) 22.5° with visible horseshoes labelled in the chronological order of their generation, (b) 82.5°, (c) 142.5°, and (d) 202.5°. In the side view, structures closer to the camera have slightly higher magnification and thus appear to have greater spacing between them. A colour version of this figure may be found at http://gasdyn.princeton.edu.
3.1. Vortex interactions
The video frames in figure 5 span half a flapping cycle. At φ = 22.5° (figure 5a), the shear layer shed from the panel has begun to roll up into a horseshoe. In figures 5(b) and 5(c), the spanwise tip has been released from the trailing edge and convects downstream, carrying with it the streamwise legs that, due to the no-slip condition, remain connected to the panel. In the side view, it is difficult to distinguish these structures from those of previous shedding events. In figure 5(d), which lags figure 5(a) by 180°, vorticity of the opposite sign is being shed. A similar development occurs in the second half of the cycle.
The lateral motion of the panel increases linearly with chordwise distance from the leading edge. Therefore, streamwise vortices shed by the panel have a circulation that increases in the streamwise direction and must be accompanied by a spanwise vortex sheet bridging the legs. The most recently created horseshoe that crosses any (y, z)-plane will therefore have the greatest circulation in that plane and will dominate local vortex interactions. As clearly illustrated by Govardhan & Williamson (2005) in the case of the vibrating sphere, the continuously varying lift force will also contribute to the continuous variation in the strength of the shed streamwise vortices.
Each horseshoe is significantly deformed by interactions with the two horseshoes that immediately follow. The first is an opposite-sign interaction where a section of each leg becomes entrained by the subsequent horseshoe. The second is a like-sign interaction with the second subsequent horseshoe. This interaction extends, in principle, back to the panel, so that at any point upstream of the beginning of this interaction the legs of the original horseshoe are merged into the more recently created vortices of the same sign and are virtually indistinguishable from them. Figure 5(a) illustrates both types of interactions occurring in the region between the tips of horseshoes 4 and 5. Near the tip of horseshoe 4, the legs of horseshoe 2 are sheared and engulfed by horseshoe 4 in a like-sign interaction. In the side view this interaction has the appearance of a chain link closing around the tip of horseshoe 4. Just upstream, an opposite-sign interaction occurs between horseshoes 3 and 4 in which a section of horseshoe 3 is sheared by the velocity field induced by horseshoe 4. In both cases, the kinematics are dominated by horseshoe 4. Further upstream, horseshoes 3 and 4 are drawn into horseshoe 5 in a similar manner.
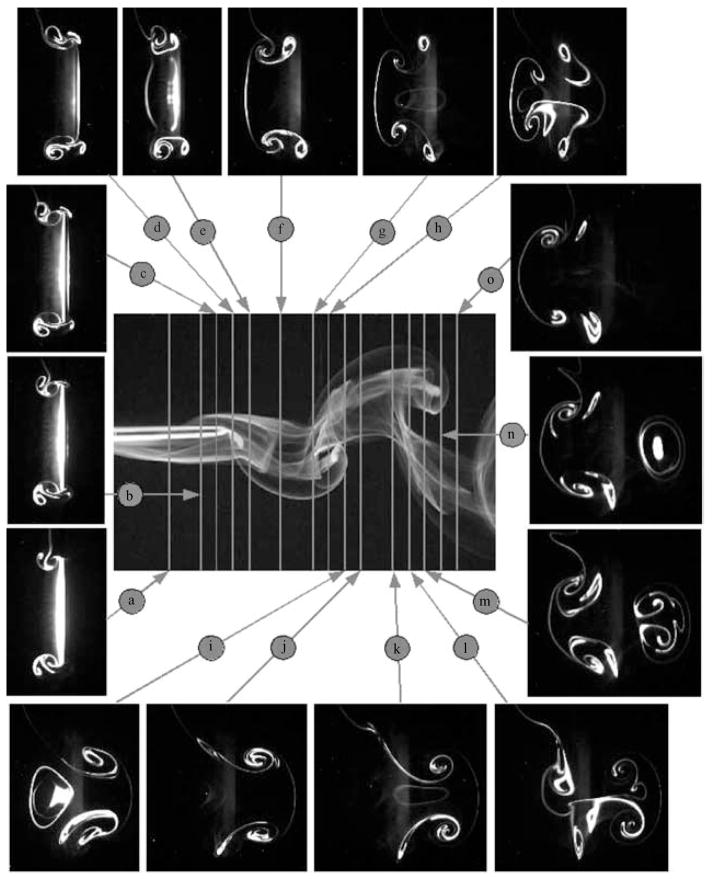
Within the first two periods after the creation of a horseshoe, the legs maintain a primarily streamwise orientation so it is useful to visualize this region looking upstream. Figure 6 contains images at several (y, z)-planes superimposed onto a top-view image at φ = 22.5°. This set of images was generated within one revolution of the laser scanning drum and provides a three-dimensional snapshot of the wake at an approximately fixed phase.
Figure 6.
Illuminated (y, z)-planes in the near wake revealing interactions of streamwise vorticity (φ = 22.5°). Vortex interactions occurring between horseshoes 5 and 6 in planes (a)–(d), horseshoes 4 and 5 in planes (e)–(g), horseshoes 3 and 4 in planes (i)–(k), and horseshoes 2 and 3 in planes (m)–(o). A colour version of this figure may be found at http://gasdyn.princeton.edu.
Planes (a)–(c) are upstream of the trailing edge. In planes (a)–(d), the streamwise legs of horseshoe 6 are visible adjacent to the left face of the panel. They form counter-rotating pairs with the weaker legs of horseshoe 5. The tip of horseshoe 6 is between planes (d) and (e) so it is not visible in any subsequent planes.
The legs of horseshoe 4 first appear on the right side of the panel in plane (b) and grow in size and strength with downstream distance. The interaction between horseshoes 4 (right) and 5 (left) is visible in planes (e)–(g). The arrangement resembles a leapfrog interaction between two vortex pairs except that the pairs are of opposite sign. At plane h, the bottom leg of horseshoe 3 emerges from horseshoe 5. Upstream of this point it is merged into the legs of the stronger horseshoe 5 which terminates between planes (h) and (i). In planes (i)–(m), horseshoe 4 has the greatest circulation. A similiar sequence occurs in planes (i)–(l) for vortices shed one half-cycle earlier than those in planes (e) through (h). The pattern begins to repeat in planes (m)–(o).
Figure 7 contains isocontours of vorticity, obtained using DPIV, at plane (f ) of figure 6 and at approximately the same phase. The image consists of 70 phase-averaged correlations required to distinguish the weak vortices from background noise and random errors. A strong pair is formed by the legs of horseshoe 5 while the much weaker pair of opposite sign is horseshoe 4. This is consistent with the interpretation of the corresponding flow visualization.
Figure 7.
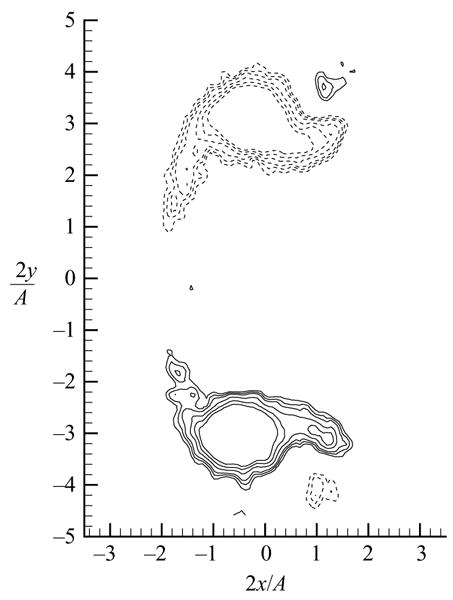
Isocontours of vorticity corresponding to plane (f ) of figure 6 at approximately the same phase. Contour levels are ± 0.1, 0.125, 0.15, 0.2, 0.25, and 0.3 s−1 (dashed lines denote negative values) and are generated from 70 phase-averaged cross-correlations.
3.2. Vortex merging and wake model
To obtain better streamwise resolution in the vicinity of the vortex interactions, images taken at plane (l) from consecutive revolutions of the laser scanning drum were used in conjunction with Taylor’s hypothesis. Taylor’s hypothesis is only approximately valid since the wake continues to evolve as it moves downstream in the vicinity of plane (l). The result is given in figure 8, where image (f ) is the original plane (l) from figure 6. There is a delay of 0.43 s between consecutive images in figure 8 which corresponds to a displacement of approximately 2 mm upstream between images.
Figure 8.
Consecutive images (Δt = 0.43 s) at plane (l) of figure 6 yielding a streamwise interpolation of figure 6. The weak distant legs of horseshoe 2 are initially entrained by the stronger vortices of horseshoe 3 (images a–e). Further upstream (images f–i), horseshoe 4 dominates the interaction, entraining horseshoe 2 and entraining horseshoe 3. Asymmetry results in a stronger interaction between horseshoes 2 and 3 at the top of the wake, and between horseshoes 2 and 4 at the bottom.
Figure 8(b) corresponds approximately to plane m in figure 6. In figure 8(a–c), the tip of horseshoe 4 has just penetrated the image plane, and horseshoe 3 continues to entrain horseshoe 2. In figure 8(d–i), which by Taylor’s hypothesis correspond to increasingly upstream locations, horseshoe 4 dominates the motion of horseshoe 2 until horseshoe 2 (and probably part of horseshoe 3) is ultimately engulfed. Within the interaction region illustrated in figure 8, vertical asymmetry is apparent. This is also the case for the interaction of plane (h) in figure 6.
Further downstream it is apparent from the images of figure 5 that the like- and opposite-sign interactions become localized at the tips of the horseshoe vortices. This is particularly evident at the tip of horseshoe 1 which draws the legs of the downstream horseshoes toward the symmetry plane, and into an orbit about its spanwise core. When the legs of the preceding horseshoe are compressed in this manner, their mutual induction propels them upstream relative to the tips. This effect, and the action of the spanwise tips, causes the legs to deform into arcs that sweep across the wake joining the horseshoe tips.
An illustration of the evolution of the wake and its ultimate form is given in figure 9. The sense of the vorticity in each section is indicated by arrows, according to the right-hand rule. In the opposite-sign interaction, legs are pinched as they are stretched around the tip of the subsequent horseshoe, and thus re-emerge and continue upstream. In the like-sign interaction, the legs become integrated into the legs of the newer horseshoe. Due to the high level of shearing and proximity of the leg vorticity in these interaction regions, it is expected that there is some reconnection of vorticity, but to the level of detail in which the wake was examined, this does not appear to have an important effect on the development of the wake.
Figure 9.
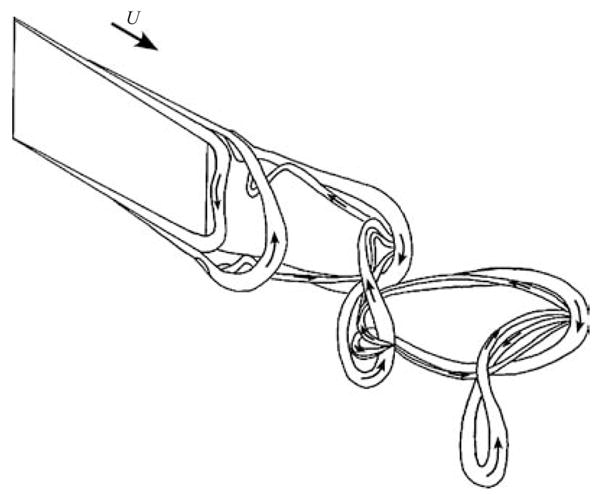
Vortex skeleton model of the wake.
The model of figure 9 is an idealization. The interactions described are not necessarily complete: the weaker vortex may be sheared apart, with one portion becoming entrained by the stronger one while the other portion remains distinct. The constant shearing also tends to introduce large eccentricities into the streamwise cores as visualizations in figures 6 and 8 reveal.
4. Discussion and conclusions
The wake of this particular geometry can be described in terms of the evolution of horseshoe vortices shed from the sides and trailing edge of the panel. The model presented in figure 9 represents the flow well for approximately 0.20 < St < 0.25. Experiments not presented here indicate that the wake patterns and vortex skeleton model of figures 1 and 9 are quite robust with respect to changes in Reynolds number, aspect ratio, and amplitude, with some modification to the Strouhal number at which the transitions occur.
The variation in strength of the legs of each horseshoe implies that the degree of overlap of the structures is important to vortex dynamics in the wake. In this context it is perhaps more useful to characterize the wake in terms of the reduced frequency k = f C/U which is useful for low-aspect-ratio foils because it provides an indication of the degree of overlap of vortical structures shed in consecutive half-cycles. For the three cases in figure 1, k = 1.4, 2.6, and 3.9, respectively. At k = 1.4, the case examined in detail here, each horseshoe undergoes two interactions with subsequently shed horseshoes before it is completely entrained. Likewise, because the horseshoes have a greater degree of overlap at higher reduced frequency, the interacting vortices would have more equal strengths. This has two forseeable effects. First, the streamwise counter-rotating pairs formed by consecutive horseshoes will have a more persistent mutual induction in the spanwise direction, which manifests itself in the spanwise compression observed in the side view of figure 1(b). Secondly, with more similar strengths, the horseshoes will be less inclined to merge. Therefore, a more complex structure will result, such as the one presented in figure 1(b).
Considering the variations with reduced frequency or Strouhal number described above, the present work yields a wake structure that is completely consistent with that of Guglielmini (2004). At low non-dimensional frequencies both wakes take the form of a von Kármán vortex street, whereas at higher frequencies the wakes split. The lack of a leading-edge vortex in the present case does not qualitatively alter the appearance of the wake in comparison to Guglielmini’s computations because the leading-edge vortex becomes intertwined with the trailing-edge vortex of the subsequent cycle. The wake visualizations of Dong et al. (2005) are also consistent with figure 1(b) and the computations of Guglielmini. On the other hand, von Ellenrieder et al. (2003) observe a wake structure in which a portion of the trailing-edge vortex separates from an otherwise simple chain of vortex rings of alternating sign. This wake may represent a transitional state between the two patterns observed in figures 1(a) and 1(b) and by Guglielmini (2004).
A striking similarity, however, exists between the present wake model and the rendering of Govardhan & Williamson (2005) for the wake of a vibrating sphere. This is an excellent example of the ubiquity of this type of wake structure despite great differences in geometry.
Acknowledgments
Thanks to Richard Clark, Juan Jiménez, and Frank Fish for many useful discussions. This work was supported in part by the National Institutes of Health CRCNS grant 1RO1NS054271.
References
- Anderson JM, Streitlien K, Barrett DS, Truantafyllou MS. Oscillating foils of high propulsive efficiency. J Fluid Mech. 1998;360:41–72. [Google Scholar]
- Buchholz JHJ, Smits AJ. The wake of a low aspect ratio pitching plate. Phys Fluids. 2005;17(9) to appear in Gallery of Fluid Motion. [Google Scholar]
- Delo CJ, Kelso RM, Smits AJ. Three dimensional structure of a low-Reynolds-number turbulent boundry layer. J Fluids Mech. 2004;512:47–83. [Google Scholar]
- Dong H, Mittal R, Bozkurttas M, Najjar F. Wake structure and performance of finite aspect-ratio flapping foils. AIAA Paper. 2005:0081. [Google Scholar]
- Drucker EG, Lauder GV. Locomotor forces on a swimming fish: Three-dimensional vortex wake dynamics quantified using particle image velocimetry. J Expl Biol. 1999;202:2393–2412. doi: 10.1242/jeb.202.18.2393. [DOI] [PubMed] [Google Scholar]
- von Ellenrieder KD, Parker K, Soria J. Flow structures behind a heaving and pitching finite-span wing. J Fluids Mech. 2003;490:129–138. [Google Scholar]
- Govardhan R, Williamson CHK. Votex-induced vibration of a sphere. J Fluid Mech. 2005;531:11–47. [Google Scholar]
- Guglielmini L. PhD thesis. University of Genoa; 2004. Modeling of thrust generating foils. [Google Scholar]
- Jeong J, Hussain F. On the identification of a vortex. J Fluid Mech. 1995;285:69–94. [Google Scholar]
- Koochesfahani MM. Vortical patterns in the wake of an oscillating airfoil. AIAA J. 1989;27:1200–1205. [Google Scholar]
- Ohmi K, Coutanceau M, Daube O, Loc TP. Further experiments on vortex formation around an oscillating and translating airfoil at large incidences. J Fluid Mech. 1991;225:607–630. [Google Scholar]
- Ohmi K, Coutanceau M, Loc TP, Dulieu A. Vortex formation around an oscillating and translating airfoil at large incedences. J Fluid Mech. 1990;211:37–60. [Google Scholar]
- Perry AE, Chong MS. A description of eddying motions and flow patterns using critical-point concepts. Annu Rev Fluid Mech. 1987;19:125–155. [Google Scholar]
- Williamson CHK, Roshko A. Vortex formation in the wake of an oscillating cylinder. J Fluid Struct. 1988;2:355–381. [Google Scholar]


