

Abstract
The fundamental role of cholesterol in the regulation of eukaryotic membrane structure is well-established. However the manner in which atomic level interactions between cholesterol and lipids, with varying degrees of chain unsaturation and polar groups, affect the overall structure and organization of the bilayer is only beginning to be understood. In this paper we describe a series of Molecular Dynamics simulations designed to provide new insights into lipid—cholesterol interactions as a function of chain unsaturation. We have run simulations of varying concentrations of cholesterol in dipalmitoyl phosphatidylcholine (DPPC), palmitoyl-oleyol phosphatidylcholine (POPC), and dioleyol phosphatidylcholine (DOPC) bilayers. Structural analysis of the simulations reveals both atomistic and systemic details of the interactions and are presented here. In particular, we find that the minimum partial molecular area of cholesterol occurs in POPC—Chol mixtures implying the most favorable packing. Physically, this appears to be related to the fact that the two faces of the cholesterol molecule are different from each other and that the steric cross section of cholesterol molecules drops sharply near the small chain tails.
Introduction
Eukaryotic cellular life depends on cholesterol.1,2 Cholesterol comprises approximately 40 mol % of the lipid portion of the eukaryotic plasma membrane and is generally responsible for the modulation of the physicochemical properties required for viability and cell proliferation.1,2 It is known that cholesterol reduces the passive permeability of membranes, increases membrane mechanical strength, and modulates membrane enzymes.3 Among other biological roles, cholesterol is involved in the formation of membrane “rafts”—domains in which cholesterol, saturated long-chained lipids, and specific proteins are concentrated.4 The particular contribution cholesterol makes in the structure of rafts is to facilitate the formation and maintenance of a liquid-ordered (Lo) membrane domain.5,6
While the majority of experimental studies have involved dipalmitoyl or dimyristoyl phosphatidylcholine (DPPC or DMPC)7-10 there are also experimental studies on the effect of cholesterol on palmitoyl-oleyol phosphatidylcholine (POPC).11-18 Hyslop et al. 11 utilized fluorescence depolarization to estimate that cholesterol molecules in a 1:1 POPC:cholesterol bilayer remain separated with a minimum separation distance of ∼10 Å. They concluded that POPC and cholesterol exist at this concentration in an ordered lattice arrangement. Evidence that POPC and DPPC or DMPC interact differently with cholesterol and other sterols is also contained in studies of Urbina et al.12 They utilize NMR spectroscopy to comparatively study POPC, DPPC, and DMPC bilayers containing, separately, cholesterol, ergosterol, and lanosterol at sterol concentrations between 10% and 50%. They conclude that the sterols have a less marked effect on POPC than they have on DPPC.
In small-angle X-ray scattering experiments, Rappolt et al.14 varied the pressure to locate phase transitions in POPC—cholesterol mixtures over a range of cholesterol concentrations from 0 to 20%, and at temperatures of 5 and 20 °C. The data indicate that bilayer fluidity increases as cholesterol concentration varies from 0% to 8% but decreases as cholesterol concentration increases above this point. The data are consistent with the onset, at about 8% cholesterol, of liquid-ordered regions in the bilayer. This result is consistent with a partial POPC—cholesterol phase diagram proposed by de Almeida et al.15 This diagram has the same general shape as the corresponding region of the DPPC—cholesterol diagram of Vist and Davis,19 but the region of proposed coexistence between fluid and liquid ordered regions extends from about 10% cholesterol to nearly 40% cholesterol, while the same region in the DPPC—cholesterol diagram extends from about 10% cholesterol to about 25% cholesterol. This suggests that the ability of cholesterol to order a POPC bilayer allows for an extended region of heterogeneous lateral organization, compared to the situation in a DPPC bilayer.
POPC has also been investigated as part of ternary bilayer mixtures with sphingomeylin and cholesterol8,20,21 or ceramide.22 Heerklotz and co-workers used calorimetry to compare the interactions of cholesterol with large unilamellar vesicles of POPC plus 30% cholesterol, sphingomyelin plus 30% cholesterol, and 1:1 sphingomyelin:POPC plus 30% cholesterol.20 They find that sphingomyelin—cholesterol interactions are favored by 7 kJ/m in sphingomyelin—cholesterol mixtures and by 13 kJ/m in 1:1 sphingomyelin—POPC mixtures over pure POPC—cholesterol mixtures. Zhao et al.8 find using flourescence imaging that ternary mixtues of POPC, sphingomyelin, and cholesterol are qualitatively different from mixtures of DOPC, sphingomyelin,and cholesterol. POPC-based ternary mixtures do not exhibit the same micrometer scale domains over a wide range of concentrations, compared to DOPC-based mixtures. Zhao et al. conclude that POPC mixtures are close to phase separation sufficiently critical in their thermodynamical state that phase separation can be induced by a “perturbation” such as increased pressure (as in Rappolt et al.14), reduced temperature, or perhaps by membrane proteins. Castro et al.22 use multiple flourescent probes to study ternary mixtures of POPC, sphingomyelin, and ceramide. The latter lipid acts very similarly to cholesterol to order lipid bilayers, at least at low concentrations.23 Castro et al. construct a ternary phase diagram for POPC—palmitoyl sphingomyelin and palmitoyl ceramide. This diagram has a relatively rich set of coexisting phase regions. Interestingly, the region of the diagram where POPC is the dominant component consists largely of coexisting domains rich in POPC and of fluid structure, coexisting with domains rich in ceramide, and of an ordered structure.
Simulations can add atomic level insight into microscopic interactions between lipids, cholesterol, and water.24-28 A computational study of the effect of chain unsaturation on cholesterol—lipid interactions was performed by Chiu et al.29 They simulated hydrated lipid bilayer consisting of DPPC and cholesterol and of POPC and cholesterol at low (∼6%) cholesterol concentration where they found that certain properties of the bilayers are indistinguishable from cholesterol-free bilayers, including lateral diffusion and electron density. A large scale set of simulations of ternary mixtures of POPC, sphingomyelin, and cholesterol was run by Niemelaˇ et al.30 These simulations involved 1064 lipids with the composition ratios of POPC:palmitoyl sphingomyelin:CHOL at 1:1:1, 2:1:1, and 62:1:1 plus hydration waters. The simulations were run for 100 ns. An interesting result is that lateral pressure profiles in the simulated membranes are strongly dependent on the compositions and in all cases differ substantially from lateral pressure profiles in single-component phospholipid bilayers.
A broader biological context for physical chemistry studies of cholesterol interactions with chains of differing saturations is the question of what types of lipids tend to form rafts, as evidenced by the composition of cholesterol-rich detergent-resistant domains. It is well-established that, among biological lipids, such domains are enriched in sphingolipids, which have saturated chains. It is inferred that this enrichment is due to a preference of cholesterol to pack well with saturated chains.31 However, while enriched in sphingolipids relative to the overall membrane lipid composition, rafts also have substantial amounts of unsaturated chain lipids.32
In this paper we compare the effect of chain unsaturation on lipid—cholesterol interactions in binary mixtures, thus providing insight into possible lipid preferences in formation of “raft”-like domains. We report results of MD simulations of DOPC, POPC, and DPPC over a range of cholesterol concentrations. As part of this effort we have improved force field parameters for each of the three lipids under study. In the following we first describe the changes made in force fields, and compare simulations with experimental X-ray form factors. We then describe a systematic study of each lipid at cholesterol concentrations ranging from 10% to 30%. The relative solubility of cholesterol (Chol) in each lipid is determined from the partial molecular area of Chol.
Methods
Molecular Dynamics (MD) simulations were performed on hydrated DOPC, and DPPC bilayers along with their mixtures with Chol at 10%, 20%, 25%, and 33%. We also used trajectories of POPC, cholesterol mixture from our previous work.23 All the simulations were performed using the GROMACS package.33,34 The LINCS algorithm was used to constrain all the bonds in the system35 allowing an integration time step of 4 fs. In an separate unpublished simulation we verified that this time step was not so large that it led to artifacts in the water properties. Periodic boundary conditions were applied in all three dimensions, and long-range electrostatics were calculated using the SPME algorithm36 with a real space cutoff of 9.5 Å. A cutoff of 18 Å was employed for van der Waals interactions. The simulations with DOPC and DPPC were performed at 303 and 323 K, respectively, using the Nose-Hoover scheme. This particular choice of temperatures was due to availability of the experimental data for these lipids. Relative to the respective lipid melting temperatures, the reduced temperatures ((T - TM)/TM) are 0.13, 0.20, and 0.03 for DOPC, POPC (also run at 303 K 23), and DPPC, respectively. All three lipids are above the phase transition temperatures with only DPPC closer to its TM. The systems were simulated in an NPT ensemble using the Parrinello—Rahman pressure coupling scheme37,38 at a constant pressure of 1 atm.
Initial configurations for all the mixture systems were generated by random placement of 100 mixture molecules per leaflet in appropriate proportion such that the phosphorus atoms of the headgroups were at the z = 25 Å and z =-25 Å planes and the hydrocarbon chains were pointing toward the z = 0 plane. Two slabs of 5000 SPCE water were placed above and below the constructed bilayers. The systems were energy minimized to remove bad contacts. A 200 ps MD simulation was performed on each system at 500 K. This was done to ensure proper disordering of the hydrocarbon chains. Then the temperatures were brought down to their respective target temperatures in steps of 50 K. At each temperature step a small 100 ps MD simulation was performed on each system. All the systems were simulated for 2 ns of MD with regeneration of velocities from a Maxwellian distribution at 303 K (323 K) for DOPC (DPPC) mixtures after every 100 ps. Then 3 ns of continuous MD simulations were performed on each system. At this point the velocities were regenerated as before and continuous 20 ns simulations were performed on all the systems. Throughout the simulations we monitored the dimensions of the simulation cells.
Force Field Parameters
Whenever possible, the force field parameters from GROMOS96 43A1 parameter set39 were adopted. Our van der Waals (VDW) parameters were determined using the general method perfected by several groups.40,41 Generally in this method, VDW parameters for the atom types of model molecules (for example, alkanes for saturated hydrocarbon chains) are optimized to reproduce the experimental densities and heats of vaporization of these model compounds within MD simulations.
Torsional parameters were determined using the procedure outlined by Reiling et al.42 In general, in this method, a potential energy profile as a function of the dihedral angle is computed at the ab initio level. Then torsional parameters are fitted to obtain the same profile for the molecular mechanical potential energy (up to an additive constant). In particular, in this work, we used GAUSSIAN0343 for ab initio calculations at the B3LYP/6-31G(d,p) level with all other geometrical parameters optimized. The standard GROMOS96 dihedral energy functional form
was used, where Kφ, δ, m, and φ are the force constant, phase shift, multiplicity, and dihedral angle, respectively. For the hydrocarbon chains, the united atom dihedral requires a dihedral potential with multiplicity up to m=5. Hence, instead of a regular dihedral potential, the well-known Ryckaert—Bellemans44 and Kuwajima45 potential functions were used.
Note that both of these torsional functions are computed with one to four nonbonded interactions. In general, the torsional parameters can be derived with or without one to four interactions. Further details of force field parameters and the complete list of parameters are presented in our up coming publication (Chiu et al. preprint).
Results and Discussion
Hydrated Bilayers and Verification of Model Parameters
Before studying the mixing properties of cholesterol in DPPC, POPC, and DOPC, we validated force field parameters described in previous section for lipids by computing key structural properties such as volume and area per lipid, X-ray form factors, and NMR order parameters.
Table 1 shows various structural properties of the bilayers. The total volume per lipid (Vl) is computed by summing up the headgroup + gycerol backbone volume (VHG) and the hydrocarbon volume (Vc). These volumes are in turn computed by the method proposed by Petrache et al.46 In this method the system is divided into ns slabs and the partial specific volumes of the atom types (vi) in the system are obtained by imposing conservation of total volume for each slice element through minimization of the function
| (1) |
over vi, where ni(zj) is the number density of ith type in slice zj. The computed volumes of DPPC, POPC, and DOPC headgroups, hydrocarbon cores, and total lipid volumes agree well with the experimental data.47 In all the cases the difference is less than the volume of one water molecule. The area per lipid in the table is computed from the hydrocarbon volume Vcusing the relation
| (2) |
where Dcis the thickness of the hydrocarbon core.48 In the simulations the hydrocarbon thickness, Dc, is calculated by determining the half-value of the probability distribution of the hydrocarbon core.48 The hydrocarbon thickness determined by this method is in good agreement with the experimental values (See Table 1).
Table 1. Structural Quantities for Hydrated DPPC, POPC, and DOPC Bilayers.
| DPPC |
POPC |
DOPC |
||||
|---|---|---|---|---|---|---|
| MD | expt | MD23 | expt47 | MD | expt47 | |
| temperature (K) | 323 | 323 | 303 | 303 | 303 | 303 |
| Vl (Å 3) | 1212.8 | 1228.5 | 1241.8 | 1256 | 1269.7 | 1303 |
| Vc (Å 3) | 869.0 | 895.6a | 911.4 | 924.2 | 949.3 | 971 |
| VHG (Å 3) | 343.8 | 332.9a | 330.4 | 331 | 320.4 | 331 |
| VCH2 (Å 3) | 27.24 | 27.18a | 27.6 | 27.01 | 27.6 | |
| VCH3 (Å 3) | 53.2 | 53.35a | 53.6 | 53.3 | 53.6 | |
| VCH=CH (Å 3) | 43.46a | 44.2 | 43.2 | 44.2 | ||
| VH2O (Å 3) | 30.55 | 30.54 | 30.54 | |||
| 2Dc (Å) | 27.0 | 27.9 | 27.4 | 27.1 | 27.6 | 26.8 |
| DHH (Å) | 36.7 | 37.8 | 36.6 | 37.0 | 37.2 | 36.7 |
| Al (Å 2) | 64.3 | 64.2 | 66.5 | 68.3 | 68.8 | 72.5 |
| Alg (Å 2) | 61.9 | 63.0 | 64.0 | |||
Due to overlapping densities of CH=CH and CH2 in the POPC molecule,the method used to compute component volumes (see eq 1) develops numerical instabilities. Hence ratios VCH3/VCH2 and VCH=CH/VCH2 from DPPC and DOPC simulations are used to compute these values.
As reported in our previous work the area per lipid based on division of cross sectional area of box, denoted as “geometric area” (Alg = Abox/((1/2)Nlipids)),23 is different from the area per lipid calculated from hydrocarbon volume. From Table 1 we note that the discrepancy in these two areas for DPPC, POPC, and DOPC is ∼4%, ∼6%, and ∼7.5% respectively. Possible sources of the difference are as follows:
Finite size effects. Wohlert and Edholm49 found that the “geometric” area per molecule increased with the size of the simulation. This increase was quite small for simulations in which PME was used for electrostatics but does represent a systematic error present, presumably, in all simulations.
Undulations or protrusions could introduce errors into the calculation of the projected area, thereby producing a lower value for the geometrical area.50 Due to the small size of the simulation boxes and periodic boundaries large undulations are suppressed so that likely contributors in the reduced projected areas are molecular protrusions in the bilayer. Lindahl and Edholm51 have observed in simulations of DPPC that peristaltic (i.e., protrusion) fluctuations dominate bilayer undulation fluctuations at small wavelength and they relate the suppression of larger wavelength undulatory fluctuations to the increase in molecular area with simulation size discussed above.
In Table 1 we report both the volumetric and the geometric area values for completeness.
A commonly studied structural property of the bilayer is its electron density profile. In experiments, the form factor of the bilayer is obtained from the X-ray diffraction pattern. Then the electron density profile is deduced from the form factor. In simulations, we calculate the electron density by dividing the simulation cell into slabs and counting the number of electrons corresponding to the atoms in each slab. We then calculate the form factors from the electron densities using
| (3) |
where D is the average length of the simulation cell in the z direction, ρe(z) is the symmetrized electron density of the system, and ρebulk water is the electron density of the bulk water. Figure 1 shows the calculated X-ray form factors for DPPC, POPC, and DOPC in comparison with the experimental data.47 We note that in all three cases agreement with simulated form factors is very good for the first two lobes of corresponding X-ray form factors. As summarized in Table 1, the molecular volume, the form factor, and the electron density obtained from these pure simulations are in good agreement with experiments. Therefore, use of eq 2 for computation of lipid area Alin simulations is consistent with the experimental procedure.
Figure 1.

Comparison of form factors computed in simulations and X-ray scattering experiments: (a) pure DPPC bilayer at 323 K; (b) pure POPC bilayer at 303 K; (c) pure DOPC bilayer at 303 K.47,52
Mixtures of Cholesterol with DPPC, POPC, and DOPC
Turning now to the structural properties of mixed bilayers, we first computed the partial volumes of the constituents. To this end we expressed the total volume of the simulation cell as
| (4) |
where Nw, Vw, Vl, Vch, and x are the number of waters, volume of a water molecule, volume of a lipid molecule, volume of a cholesterol, and number fraction of cholesterol in the mixture, given by Nch/(Nl + Nch), respectively. For each system we calculated the volume of a water molecule using eq 1 (results are given in Table 1) and computed the volume of the lipid in the bilayer at each concentration x by
Figure 2 shows the volumes v(x) as a function of x for all the simulated systems. These data are of interest because Greenwood et al.52 have published experimental values of v(x) for various cholesterol mixtures with DPPC, POPC, and DOPC. Figure 2 shows that the simulated systems with POPC and DOPC exhibit a linear form for v(x), where as DPPC requires two linear fits in different regions of cholesterol concentrations. This phenomenon is also reported in the experimental paper of Greenwood et al.52 The computed partial molecular volumes obtained from this figure, along with the experimental volumes reported by Greenwood et al.,52 are reported in Table 2. These volumes show very good agreement with the experimental data. This agreement gives us confidence in not only our lipid force field parameters but also our cholesterol force field parameters.
Figure 2.

Plot of total volume per lipid molecule of the simulated systems as function of concentrations of cholesterol for DPPC, POPC, and DOPC mixtures.
Table 2. Partial Molecular Volumes and Areas Calculated from Figures 2 and 3.
| DPPC |
POPC |
DOPC |
||||
|---|---|---|---|---|---|---|
| MD | expt | MD23 | expt52 | MD | expt52 | |
| temperature (K) | 323 | 323 | 303 | 303 | 303 | 303 |
| Vl (Å 3) | 1213.9 (x < 0.25) | 1228.6 (x < 0.25) | 1239.5 | 1255.5 | 1269.4 | 1300.1 |
| 1197.3 (x ≥ 0.25) | 1207.6 (x ≥ 0.25) | |||||
| Vch (Å 3) | 594.4 (x < 0.25) | 573.8 (x < 0.25) | 608.0 | 622.6 | 606.8 | 632.9 |
| 644.9 (x ≥ 0.25) | 637.1 (x ≥ 0.25) | |||||
| Al (Å 2) | 54.07 | 61.50 | 61.50 | |||
| Ach (Å 2) | 23.84 | 12.42 | 20.84 | |||
Using the notion of partial molecular area, introduced by Edholm and Nagle,53 we then computed the molecular areas
Figure 3 shows plots of a(x)/(1 - x) as a function of x/(1 - x) for all the simulations. The partial molecular area of a cholesterol at a particular concentration is the slope of the curves in Figure 3 at that concentration. Unlike the volume curves (Figure 2), the area curves are not linear. In fact for cholesterol concentrations close to 10%, in all the simulations, the partial molecular area of a cholesterol is negative. Negative partial molecular areas are interpreted by Edholm and Nagle53 as a manifestation of the condensation effect of cholesterol on surrounding lipids. The curves in Figure 3 are approximately linear above 20% cholesterol concentration for DPPC—, POPC—, and DOPC—cholesterol bilayers. The partial molecular areas of cholesterol and lipids obtained by extrapolation of the linear portions of the curves are listed in Table 2. The computed cholesterol partial molecular area is largest in saturated DPPC and smallest in POPC where one chain is saturated and the other chain is unsaturated. For DOPC, with two unsaturated chains, the area per cholesterol is higher than that of cholesterol in POPC but somewhat lower that that for cholesterol in DPPC. The greatly reduced partial molecular area of cholesterol in POPC, compared to DPPC and DOPC, is the main new result of this paper. The implication is that in POPC the cholesterol occupies smaller effective area by closer packing with neighboring lipids, compared to both DPPC and DOPC.
Figure 3.

Plot of the a(x)/(1 - x) of simulated system versus concentrations of cholesterol (solid line). Light dashed lines represent linear fits to data for nonzero cholesterol. The slope of the fitted lines correspond to the partial molecular areas of the cholesterol and the y-intercept gives the partial molecular area of DPPC, POPC, and DOPC.
To understand the special packing of POPC chains around cholesterol, we examined the structure of POPC chains in comparison with those of DPPC and DOPC. One important structural property for hydrocarbon chains is the NMR order parameter profile. The order parameter tensor, S, is defined as
| (5) |
where θais the angle made by the ath molecular axis with the bilayer normal and †abis the Kronecker delta. In the simulations, with the united atom force field, the order parameter for saturated and unsaturated carbons SCDcan be determined using the following relations
| (6) |
| (7) |
respectively (See Douliez et al.54 for the derivation and assumptions behind these expressions). In united atom simulations, the components of the order parameter tensors must be obtained from the relative positions of the neighboring carbons in hydrocarbon chain. Figures 4 and 5 show the calculated order parameters for the Sn-1 chains of POPC, DPPC and the Sn-2 chains of POPC, DOPC respectively. The systems with DPPC and POPC are simulated at different temperatures, so we first compare the pure systems and observe (see Figure 4a) that the DPPC and POPC Sn-1 order parameters are the same within error bars. Similarly, the unsaturated Sn-2 chain of POPC has the same order parameter profile as both DOPC unsaturated chains (Figure 5a). Differences in the profiles as the cholesterol concentration is raised, Figures 4b-d and 5b-d, are therefore reflections of differences in the effect of cholesterol on the membranes.
Figure 4.

Order parameter profiles for Sn-1 chains of POPC (open squares) and DPPC (filled squares) at different cholesterol concentrations.
Figure 5.
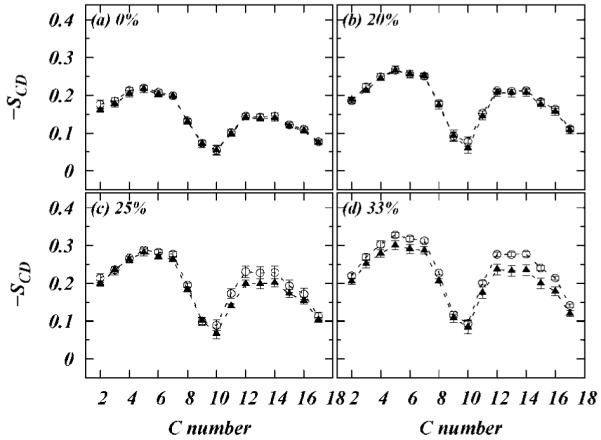
Order parameter profiles for Sn-2 chains of POPC (open squares) and DOPC (filled squares) at different cholesterol concentrations.
From parts b and c of Figure 4, we observe that the saturated chain of POPC is ordered to the same extent by cholesterol as that of the saturated chain of DPPC, with the least effect observed at 20% cholesterol. On the other hand, from Figure 5 we observe that the saturated part of unsaturated chain of POPC (carbons other than C9 and C10) is more ordered by cholesterol than the corresponding saturated carbons of DOPC. We also note that the unsaturated carbons (C9 and C10) of POPC and DOPC are largely unaffected by cholesterol. On the basis of these observations, we hypothesized that, due to the presence of both saturated and unsaturated chains in POPC, the POPC bilayer provides a special type of packing for cholesterol in which the α-face (smooth side) of cholesterol packs around the saturated chain and the β-face (methylated side) packs well around the unsaturated chain. Indeed the calculated molecular distributions of cholesterol methyl groups and the carbons in CH=CH of unsaturated chains show complete overlap (see Figure 6). This level of correlation is necessary but not sufficient to establish the above hypothesis. In our previous work,55 a similar hypothesis was supported by computing a two-dimensional correlation function dependent on radial distance and the azimuthal angle between cholesterol and lipid chain. This two-dimensional analysis required a large quantity of sample points which were available in previous work (250 ns of simulation time). In the present case the smaller simulation time means that 2D radial distribution functions are sufficiently noisy that any clear correlations are within the error bars. However, we calculated number of unsaturated carbons (C9) in unsaturated chains that are within 10 Å of β-methyl atoms of Chol (see Figure 6b) and that neighbor α and β faces of cholesterol, respectively. We found that the there are 5% more saturated chains neighboring the α-face compared to the β-face. The unsaturated chains showed very little (∼1%) preference for β-face. These results provide support for the hypothesis. In Figure 7 we show results of a test of our hypothesis from the computation of a purely radial distribution function (rdf) of the CH=CH group of Sn-2 chains around the CH3 group of β-face of cholesterol. Figure 7a shows these rdf’s for POPC and DOPC molecules. We observe that there are two peak in each rdf. The first peak is around ∼4.5 Å from the methyl group and the second peak is around ∼7 Å from the methyl group. As illustrated in Figure 7b these two peaks correspond to two closest positions for the CH=CH group along β- and α-faces, respectively. From Figure 7a we note that in the DOPC case both the peaks are approximately the same height but for POPC the first peak is taller than the second peak. This clearly implies higher correlation of POPC CH=CH group with the β-face of cholesterol.
Figure 6.

(a) Mass densities of C9 atom of POPC and β-methyl atom of cholesterol. (b) Snapshot pictures of cholesterol and POPC illustrating position of CH=CH bond and the methyl groups forming the β-face of cholesterol.
Figure 7.

(a) Radial distribution functions between lipid CH=CH and the central CH3 group on the β face of cholesterols for POPC (red) and DOPC (green). (b) Snapshot illustrating the juxtapositions of the lipid double bonded carbons with the smooth α and methylated β faces of cholesterol. Portions of four unsaturated chains are shown surrounding a cholesterol. More distant carbons are displayed in smaller perspective. The closest member of an unsaturated chain is shown in the foreground in close proximity to a cholesterol methyl on the beta side. None of the other unsaturated carbon atoms approach the cholesterol this closely. The snapshot also suggests that the carbons below the double bond can indeed fold under the ring portion of the cholesterol as discussed in the text.
In 1972 Rothman and Engleman56 published a simple model measurement of the cross sectional area profile of a cholesterol molecule by using a CPK space-filling model with internal spaces filled with plasticine. Then by simply lowering the model into water gradually they extracted a minimal steric cross sectional area profile along the length of the cholesterol molecule. In this profile the cross section varies, as is to be expected, along the length of the molecule. It is maximum near the protuding methyls on the fused rings, with area between 25 and 28 Å2. The area then rapidly drops as the tail is approached, reaching values as low as ≈10 Å2. The point at which the steric cross section is smallest is about the location of the 9-10 double bond on oleyic chains. The implication is that chains with a double bond between carbons 9 and 10 have an opportunity to fit into a van der Waals area pocket. While this packing would work for the oleyl chain of POPC or both chains of DOPC, both chains of DOPC cannot be accommodated, and the saturated chain of POPC may better pack around the remainder of the cholesterol, or neighboring lipids. This simple model is consistent with the rdf’s presented in Figure 7, where cholesterol has a stronger initial peak than POPC. It also is consistent with our observed lower partial specific area for cholesterol in POPC, compared to DPPC and DOPC.
Niu and Litman57 performed a series of studies of partitioning for cholesterol into phospholipids and sphingolipids of varying states of chain length and saturation and headgroup composition. Relative to POPC, they find that the ΔG for partitioning of cholesterol into DOPC is about +243 kJ/m. The ΔG values increase with increases in chain unsaturation and if the phosphocholine headgroup of polar group of PC is replaced with ethanolamine (PE) but is reduced if it is replaced by serine (PS). No studies were reported for disaturated PC bilayers although as discussed below partitioning of cholesterol into disaturated sphingomyelin has a large negative ΔG compared to POPC.
The simulation data presented here reveal that cholesterol minimizes its partial molecular area in a bilayer consisting of monounsaturated lipids. The simulation data do not, however, provide quantitative thermodynamic data relative to the free energy of partitioning of cholesterol into various lipid bilayers. The minimal partial molecular area of cholesterol in POPC indicates relatively closer van der Waals contact between cholesterol and neighboring POPC molecules. While tight binding is indicative of lower energy, there will also be an associated entropic cost that is not calculated in the simulations. Estimates of the free energy are beyond the scope of the present simulations, but a series of umbrella sampling simulations are planned in the future to investigate this important issue.
It is of interest to note that comparative experimental20,57 and simulation58 studies show that the partitioning of cholesterol into sphingomyelin bilayers is strongly favored in terms of free energy over partitioning of cholesterol into POPC bilayers. Experiments find that the loss in entropy of POPC upon partitioning into sphingomyelin is offset by a larger loss in energy, resulting in a large negative Δ(ΔG) compared to partitioning of cholesterol into POPC. Our planned future simulations will compare free energies of partitioning of cholesterol into the three phospholipids, DPPC, POPC, and DOPC, that we have described in this paper.
In summary the main result of this paper is that observation of a significantly reduced partial molecular area for cholesterol in POPC, compared to cholesterol in either DPPC or DOPC. This observation implies that cholesterol packs more closely around POPC than DPPC or DOPC bilayers. We further suggest that a possible reason for such enhanced packing is of β-face for the unsaturated chain and α-face for the saturated chains that has both entropic and van der Waals energetic contributions. In POPC bilayer both types of chains are present to realize this special arrangement. This result also has implications for understanding distribution of lipids in rafts. Ternary mixtures of POPC, sphingomyelin, and cholesterol do not appear to separate as readily into microdomains as DOPC—sphingomyelin—cholesterol mixtures. This is also a possible consequence of the enhanced POPC—cholesterol interactions we observe. The implication for rafts remains speculative. In a biological context, rafts are probably nanoscopic and perhaps highly transient in structure. Our simulation results support a qualitative picture of rafts consisting of regions of high order, containing primariy sphingolipids, plus cholesterol, perhaps with accompanying POPC or a similar monounsaturated phospholipid, surrounded by more fluid seen of lipid and cholesterol in various states of packing interactions.
Another important achievement here is the force field parameters for lipids. So far no other lipid force field parameters have produced simulations so consistent with the experiments. We are planning to develop these parameters further into a very accurate lipid simulation system.
Acknowledgment
We thank Professor John Nagle for valuable discussion and providing us with X-ray data on pure DPPC, POPC, and DOPC bilayers. The author A.Y.G. is supported by the National Science Foundation Grant No. DMR 0427540. Authors E.J. and H.L.S. are supported by NIH Grant UIUC/NIH 2006-139-1.
LA8004135
References
- (1).Miao L, Nielsen M, Thewalt J, Ipsen JH, Bloom M, Zuckermann MJ, Mouritsen OG. Biophys. J. 2002;82:1429–1444. doi: 10.1016/S0006-3495(02)75497-0. [DOI] [PMC free article] [PubMed] [Google Scholar]
- (2).Ohvo-Rekil̈ a H, Ramstedt B, Leppim̈ aki P, Slotte JP. Prog. Lip. Res. 2002;41:66–97. doi: 10.1016/s0163-7827(01)00020-0. [DOI] [PubMed] [Google Scholar]
- (3).Yeagle PL. The biophysics and cell biology of cholesterol: an hypothesis for the essential role of cholesterol in mammalian cells. In: Finegold L, editor. Cholesterol in Membrane Models. CRC Press; Boca Raton, FL: 1993. pp. 1–12. [Google Scholar]
- (4).Simons K, Ikonen E. Nature. 1997;387:569–572. doi: 10.1038/42408. [DOI] [PubMed] [Google Scholar]
- (5).Xu X, London E. Biochemistry. 2000;39:843–849. doi: 10.1021/bi992543v. [DOI] [PubMed] [Google Scholar]
- (6).Silvius JR. Biochim. Biophys. Acta. 2003;1610:174–183. doi: 10.1016/s0005-2736(03)00016-6. [DOI] [PubMed] [Google Scholar]
- (7).Ramstedt B, Slotte P. Biochim. Biophys. Acta. 2007;1758:1945–1956. doi: 10.1016/j.bbamem.2006.05.020. [DOI] [PubMed] [Google Scholar]
- (8).Zhao J, Wu J, Shao H, Kong F, Jain N, Hunt G, Feigenson G. Biochim. Biophys. Acta. 2007;1768:2777–2786. doi: 10.1016/j.bbamem.2007.07.009. [DOI] [PMC free article] [PubMed] [Google Scholar]
- (9).Cicuta P, Keller SL, Veatch SL. J. Phys. Chem. B. 2007;111:3328–3331. doi: 10.1021/jp0702088. [DOI] [PubMed] [Google Scholar]
- (10).Collins MD, Keller SL. Proc. Natl. Acad. Sci. U.S.A. 2007;105:124–128. doi: 10.1073/pnas.0702970105. [DOI] [PMC free article] [PubMed] [Google Scholar]
- (11).Hyslop PA, Morel B, Sauerheber RD. Biochemistry. 1990;29:1025–1038. doi: 10.1021/bi00456a027. [DOI] [PubMed] [Google Scholar]
- (12).Urbina JA, Pekerar S, Patterson H.-b. J., Montez B, Oldfield E. Biochim. Biophys. Acta. 1995;1238:163–176. doi: 10.1016/0005-2736(95)00117-l. [DOI] [PubMed] [Google Scholar]
- (13).Morrison C, Bloom M. J. Chem. Phys. 1992;101:749–763. [Google Scholar]
- (14).Rappolt M, Vidal Fernandez M, Kriechbaum M, Steinhardt M, Amenitsch H, Bernstorff S, Laggner P. Eur. Biophys. J. 2003;31:575–585. doi: 10.1007/s00249-002-0253-z. [DOI] [PubMed] [Google Scholar]
- (15).deAlmeida RFM, Federov A, Prieto M. Biophys. J. 2003;85:2406–2416. doi: 10.1016/s0006-3495(03)74664-5. [DOI] [PMC free article] [PubMed] [Google Scholar]
- (16).Heerklotz H, Tsamaloukas A. Biophys. J. 2006;91:600–607. doi: 10.1529/biophysj.106.082669. [DOI] [PMC free article] [PubMed] [Google Scholar]
- (17).Zhang L, McQuaw CM, Ewing AG, Winograd N. J. Am. Chem. Soc. 2007;129:15730–15731. doi: 10.1021/ja0741675. [DOI] [PMC free article] [PubMed] [Google Scholar]
- (18).Feigenson G. Annu. Rev. Biophys. Biomol. Struct. 2007:63–77. doi: 10.1146/annurev.biophys.36.040306.132721. [DOI] [PMC free article] [PubMed] [Google Scholar]
- (19).Vist MR, Davis JH. Biochemistry. 1990;29:451–464. doi: 10.1021/bi00454a021. [DOI] [PubMed] [Google Scholar]
- (20).Tsamaloukas A, Szadkowska S, Heerklotz H. Biophys. J. 2006;90:4479–4487. doi: 10.1529/biophysj.105.080127. [DOI] [PMC free article] [PubMed] [Google Scholar]
- (21).Silva L, de Almedia RFM, Fedorov A, Matos APA, Prieto M. Mol. Membr. Biol. 2006;23:137–148. doi: 10.1080/09687860500439474. [DOI] [PubMed] [Google Scholar]
- (22).Castro BM, de Almeida RFM, Silva LC, Fedorov A, Prieto M. Biophys. J. 2007;93:1639–1650. doi: 10.1529/biophysj.107.107714. [DOI] [PMC free article] [PubMed] [Google Scholar]
- (23).Pandit S, Chiu S-W, Jakobsson E, Grama A, Scott HL. Biophys. J. 2007;92:920–927. doi: 10.1529/biophysj.106.095034. [DOI] [PMC free article] [PubMed] [Google Scholar]
- (24).Tu K, Klein ML, Tobias DJ. Biophys. J. 1998;75:2147–2156. doi: 10.1016/S0006-3495(98)77657-X. [DOI] [PMC free article] [PubMed] [Google Scholar]
- (25).Smondyrev AM, Berkowitz ML. Biophys. J. 1999;77:2075–2089. doi: 10.1016/S0006-3495(99)77049-9. [DOI] [PMC free article] [PubMed] [Google Scholar]
- (26).Pasenkiewicz-Gierula M, R’og T, Kitamura K, Kusumi A. Biophys. J. 2000;78:1376–1389. doi: 10.1016/S0006-3495(00)76691-4. [DOI] [PMC free article] [PubMed] [Google Scholar]
- (27).Scott HL. Curr. Opin. Struct. Biol. 2002;12:495–502. doi: 10.1016/s0959-440x(02)00353-6. [DOI] [PubMed] [Google Scholar]
- (28).Pandit SA, Bostick DL, Berkowitz ML. Biophys. J. 2004;86:1345–1356. doi: 10.1016/S0006-3495(04)74206-X. [DOI] [PMC free article] [PubMed] [Google Scholar]
- (29).Chiu S-W, Jakobsson E, Scott HL. Biophys. J. 2001;80:1104–1114. doi: 10.1016/S0006-3495(01)76088-2. [DOI] [PMC free article] [PubMed] [Google Scholar]
- (30).Niemelā PS, Ollila S, Hyvōjnen M, Kartunen M, Vattulainen I. PLoS Comput. Biol. 2007;3:0304–0312. doi: 10.1371/journal.pcbi.0030034. [DOI] [PMC free article] [PubMed] [Google Scholar]
- (31).Simons K, Ehehalt R. J. Clin. Invest. 2002;110:597–603. doi: 10.1172/JCI16390. [DOI] [PMC free article] [PubMed] [Google Scholar]
- (32).Pike L. J. Lipid Res. 2003;44:655–667. doi: 10.1194/jlr.R200021-JLR200. [DOI] [PubMed] [Google Scholar]
- (33).Berendsen H, van der Spoel D, van Drunen R. Comput. Phys. Commun. 1995;91:43–56. [Google Scholar]
- (34).Lindahl E, Hess B, van der Spoel D. J. Mol. Model. 2001;7:306–317. [Google Scholar]
- (35).Hess B, Bekker H, Berendsen HJC, Fraaige JGEM. J. Comput. Chem. 1997;18:1463–1472. [Google Scholar]
- (36).Essmann U, Perera L, Berkowitz ML, Darden T, Lee H, Pedersen LG. J. Chem. Phys. 1995;103:8577–8593. [Google Scholar]
- (37).Nose S, Klein ML. Mol. Phys. 1983;50:1055–1076. [Google Scholar]
- (38).Parrinello M, Rahman A. J. Appl. Phys. 1981;52:182–7190. [Google Scholar]
- (39).van Gunsteren WF, Billeter SR, Eising RA, Ḧ unenberger PH, Kr̈ uger P, Mark AE, Scott WRP, Tironi IG. Biomolecular Simulation: The GROMOS96 Manual and User Guide. vdf Hochschulverlag AG an der ETH Zurich; Zurich: 1996. [Google Scholar]
- (40).Chiu S-W, Clark MM, Jakobsson E, Subramaniam S, Scott HL. J. Phys. Chem. B. 1999;103:6323–6327. [Google Scholar]
- (41).Berger O, Edholm O, Jähnig F. Biophys. J. 1997;72:2002–2013. doi: 10.1016/S0006-3495(97)78845-3. [DOI] [PMC free article] [PubMed] [Google Scholar]
- (42).Reiling M,S, Schlenkrich; Brickmann J. J. Comput. Chem. 1996;17:450–468. [Google Scholar]
- (43).Frisch MJ, Trucks GW, Schlegel HB, Scuseria GE, Robb MA, Cheeseman JR, Zakrzewski VG, Montgomery JA, Jr., Stratmann RE, Burant JC, Dapprich S, Millam JM, Daniels AD, Kudin KN, Strain MC, Farkas O, Tomasi J, Barone V, Cossi M, Cammi R, Mennucci B, Pomelli C, Adamo C, Clifford S, Ochterski J, Petersson GA, Ayala PY, Cui Q, Morokuma K, Malick DK, Rabuck AD, Raghavachari K, Foresman JB, Cioslowski J, Ortiz JV, Stefanov BB, Liu G, Liashenko A, Piskorz P, Komaromi I, Gomperts R, Martin RL, Fox DJ, Keith T, Al-Laham MA, Peng CY, Nanayakkara A, Gonzalez C, Challacombe M, Gill PMW, Johnson BG, Chen W, Wong MW, Andres JL, Head-Gordon M, Replogle ES, Pople JA. Gaussian 98 (Revision A.7) Gaussian, Inc.; Pittsburgh, PA: 1998. [Google Scholar]
- (44).Ryckaert J-P, Bellemans A. Faraday Discuss. Chem. Soc. 1978:95. [Google Scholar]
- (45).Kuwajima S, Noma H, Akasaka T. Proc. Symp. Comp. Chem., 4th; 1994. [Google Scholar]
- (46).Petrache HI, Feller SE, Nagle JF. Biophys. J. 1997;70:2237–2242. doi: 10.1016/S0006-3495(97)78867-2. [DOI] [PMC free article] [PubMed] [Google Scholar]
- (47).Kucerka N, Tristram-Nagle S, Nagle JF. J. Membr. Biol. 2005;208:193–202. doi: 10.1007/s00232-005-7006-8. [DOI] [PubMed] [Google Scholar]
- (48).Nagle JF, Tristram-Nagle S. Biochim. Biophys. Acta. 2000;1469:159–195. doi: 10.1016/s0304-4157(00)00016-2. [DOI] [PMC free article] [PubMed] [Google Scholar]
- (49).Wohlert J, Edholm O. Biophys. J. 2004;87:2433–2445. doi: 10.1529/biophysj.104.044222. [DOI] [PMC free article] [PubMed] [Google Scholar]
- (50).Marrink S-J, Mark AE. J. Phys. Chem. B. 2001;105:6122–6127. [Google Scholar]
- (51).Lindahl E, Edholm O. Biophys. J. 2000;79:426–433. doi: 10.1016/S0006-3495(00)76304-1. [DOI] [PMC free article] [PubMed] [Google Scholar]
- (52).Greenwood AI, Tristram-Nagle S, Nagle JF. Chem. Phys. Lipids. 2006;143:1–10. doi: 10.1016/j.chemphyslip.2006.04.002. [DOI] [PMC free article] [PubMed] [Google Scholar]
- (53).Edholm O, Nagle JF. Biophys. J. 2005;89:1827–1832. doi: 10.1529/biophysj.105.064329. [DOI] [PMC free article] [PubMed] [Google Scholar]
- (54).Douliez J-P, L’eonard A, Dufourc EJ. Biophys. J. 1995;68:1727–1739. doi: 10.1016/S0006-3495(95)80350-4. [DOI] [PMC free article] [PubMed] [Google Scholar]
- (55).Pandit SA, Bostick D, Berkowitz ML. Biophys. J. 2003;86:3743–3750. doi: 10.1016/S0006-3495(03)75102-9. [DOI] [PMC free article] [PubMed] [Google Scholar]
- (56).Rothman JE, Engelman DM. Nature. 1972;237:42–44. doi: 10.1038/newbio237042a0. [DOI] [PubMed] [Google Scholar]
- (57).Niu S-L, Litman BJ. Biophys. J. 2002;83:3408–3415. doi: 10.1016/S0006-3495(02)75340-X. [DOI] [PMC free article] [PubMed] [Google Scholar]
- (58).Bhide SY, Zhang Z, Berkowitz ML. Biophys. J. 2008;92:1284–1295. doi: 10.1529/biophysj.106.096214. [DOI] [PMC free article] [PubMed] [Google Scholar]