

Abstract
Resonance energy transfer (RET) is typically limited to distances below 60 Å, which can be too short for some biomedical assays. We examined a new method for increasing the RET distances by placing donor- and acceptor-labeled DNA oligomers between two slides coated with metallic silver particles. A N,N′-(dipropyl)-tetramethylindocarbocyanine donor and a N,N′-(dipropyl)-tetramethylindodicarbocyanine acceptor were covalently bound to opposite 5′ ends of complementary 23 base pair DNA oligomers. The transfer efficiency was 25% in the absence of silver particles or if only one slide was silvered, and it increased to an average value near 64% between two silvered slides. The average value of the Forster distance increased from 58 to 77 Å. The energy transfer data were analyzed with a model assuming two populations of donor–acceptor pairs: unaffected and affected by silver island films. In an affected fraction of about 28%, the apparent energy transfer efficiency is near 87% and the Forster distance increases to 119 Å. These results suggest the use of metallic silver particles to increase the distances over which RET occurs in biomedical and biotechnology assays.
Keywords: N,N′-(dipropyl)-tetramethylindocarbocyanine; N,N′-(dipropyl)-tetramethylindodicarbocyanine; resonance energy transfer; silver island films
Introduction
Fluorescence resonance energy transfer (RET) is the result of a through-space interaction between the oscillating dipoles of fluorescent donors (D) and absorbing acceptors (A). RET is a useful phenomenon because it occurs over relatively large distances of up to about 60 and up to 90 Å for some lanthanide donor–acceptor (D–A) pairs.1–4 An advantage of RET is that it is mostly independent of the solvent or biomolecule between the D–A pair. Additionally, the Forster distances (R0) can be calculated on first principles from the emission spectrum and quantum yield of the donor and the absorption spectrum of the acceptor.5,6 If the D–A distance is comparable or shorter than R0, then RET will occur. Although in principle the transfer rate depends on the donor and acceptor orientation, in practice the orientation factor infrequently distorts the measured distance.5,6
A disadvantage of RET is that 60 Å is a small distance relative to the size of long DNA oligomers or large protein complexes such as antigen–antibody complexes. At present, RET over longer distances is not used because it does not occur. If RET could occur over longer distances, then we believe applications could be developed. In the present report we examined the effects of metallic silver particles on long-range energy transfer. We found that placing the D–A pairs between two slides coated with metallic silver particles results in a dramatic increase in the apparent Forster distances, which agrees with earlier theoretical predictions.7,8
Materials and Methods
DNA Oligomers
The structure and sequence of the labeled and unlabeled DNA oligomers are shown in Scheme 1. The donor and acceptor labeled 23-mers were obtained from Synthetic Genetics (San Diego, CA) and contained N,N′-(dipropyl)-tetramethylindocarbocyanine (Cy3) or N,N′-(dipropyl)-tetramethylindodicarbocyanine (Cy5) on the 5′ ends. Complementary unlabeled oligonucleotides were obtained from the Biopolymer Core Facility at the University of Maryland, School of Medicine.
SCHEME 1.
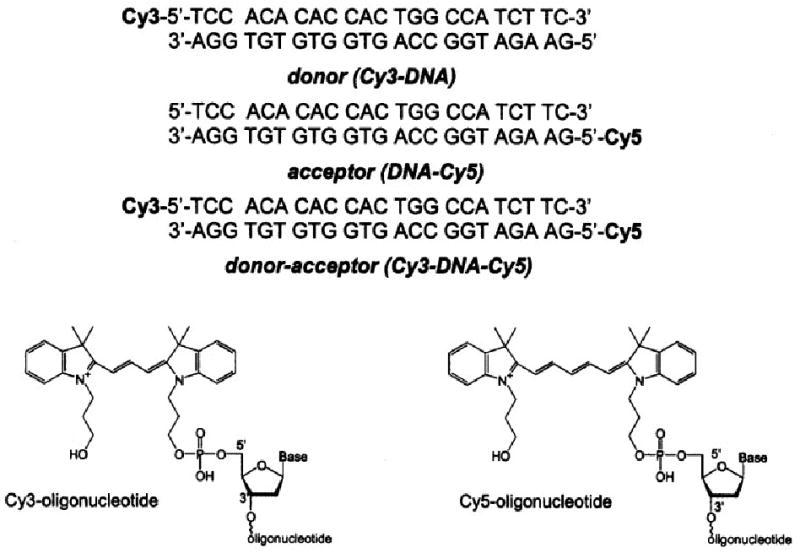
The chemical structures of the labeled and unlabeled DNA oligomers.
All studies were performed with double stranded (ds) DNA. The ds-DNA samples (Cy3-DNA, DNA-Cy5, and Cy3-DNA-Cy5, Scheme 1) were prepared by mixing the complementary oligonucleotides in 5 mM HEPES (pH 7.5), 0.2M KCl, and 0.25 mM EDTA to a final concentration of 20 μM, followed by heating to 70°C for 2 min and then slow cooling. The concentrations were determined using extinction coefficients (ε; at 548 nm) = 150,000 M−1 cm−1 for Cy3 and ε (648 nm) = 215,000 M−1 cm−1 for Cy5. At the excitation wavelength of 514 nm, these were taken as ε = 85,700 M−1 cm−1 for Cy3 and ε = 3400 M−1 cm−1 for Cy5. The quantum yield of Cy3-DNA was found to be 0.24 and the quantum yield of DNA-Cy5 was found to be 0.20 using rhodamine B in water (Q = 0.48) as a reference. The R0 value was calculated to be 54.2 Å.
Procedure for Making Silver Nanoparticle Films
Silver islands were formed on quartz microscope slides as described previously.9,10 Briefly, silver was deposited by d-glucose reduction of silver nitrate onto the quartz surfaces. This procedure resulted in about 20% surface coverage. An atomic force microscopy image revealed particle sizes from 100 to 500 Å and a height of about 70 Å (not shown). We believe the larger particles are aggregates of smaller particles. The silver island films (SIFs) displayed the characteristic surface plasmon resonance with an absorption maximum near 460-470 nm.
Fluorescence Measurements
The emission spectra were obtained using a SLM 8000 spectrofluorometer with 514-nm excitation. Intensity decays were measured in the frequency domain using instrumentation described previously.11 The excitation wavelength of 514 nm was obtained from a mode-locked argon ion laser with an approximate 120-ps pulse width and 76-MHz repetition rate. The Cy3 emission was observed through a 565-nm interference filter. The frequency-domain intensity decay measurements were performed using magic-angle polarized conditions.
The frequency-domain intensity decays were analyzed in terms of the multiexponential model:
| (1) |
where τi are the lifetimes with amplitudes αi and Σ αi = 1.0. The fitting to the multiexponential model was performed as described previously.12 The contribution of each component to the steady-state intensity is given by
| (2) |
The mean decay time is given by
| (3) |
The amplitude-weighted lifetime is given by
| (4) |
The transfer efficiency can be calculated from the amplitude-weighted lifetime of the donor alone (〈τD〉) and of the donor in the D–A pair (〈τDA〉) using
| (5) |
The use of the amplitude-weighted lifetime in Eq. (5) can be understood by recalling that the relative quantum yield of a fluorophore is given by the area under the intensity decay, which is proportional to the sum of the αiτi products.
The intensity decays of the donors in the D–A oligomers were also analyzed in terms of a distribution of D to A distances.13,14 The distance distribution was assumed to be described by a Gaussian
| (6) |
where r̄ is the mean distance and σ is the standard deviation that is related to the full width at half-maximum (hw) by 2.354σ. The half-width of the recovered distributions in the absence of silver particles reflects the flexibility of the donor and acceptor on the ends of the double helical oligomer. The transfer efficiency (E) was calculated from the time-integrated intensity decays of the donor alone [ID(t)] and the donor in the D–A pair [IDA(t)].15
| (7) |
Additional details of the distance distribution analysis can be found in Chung et al.14
In the present experiment the labeled oligomers were placed in an approximate 1 μm thick space between two SIFs, thus being present at a range of distances from the metallic particles. For control measurements the sample was placed between two unsilvered quartz plates. These plates were the other half of the SIF plates, which were not covered with silver islands. The experimental resolution is not adequate to recover the details of the spatial distribution of the effects of silver particles on the Forster distance. Hence, for analysis of the donor decay in the presence of RET [IDA(t)], we assumed the presence of two populations of oligomers, those unaffected by the metal particles with a Forster distance R01 and those strongly affected by the metal with a distance R02. The intensity decay of the samples is then given by
| (8) |
where F1 and F2 are the fractional intensities of each population (F1 + F2 = 1.0) and IDA1(t) and IDA2(t) are the intensity decays resulting from a Gaussian distribution of D to A distances and the values of R01 and R02, respectively. We assumed the D to A distance distribution was the same between quartz plates and between SIFs.
Results
Figure 1 shows emission and absorption spectra, which were recorded in a common square cuvette, of the labeled double helical oligomer with donor only (Cy3-DNA) and the absorption spectrum of the double helical DNA with acceptor only (DNA-Cy5). The donor–acceptor overlap and the donor quantum yield (Q = 0.24) results in a calculated R0 value of 54.2 Å. Favorable features of this D–A pair are the high extinction coefficient of Cy3-DNA at the 514-nm excitation wavelength and the approximately 25-fold lower extinction coefficient of the acceptor DNA-Cy5 at this wavelength. This difference results in a weak direct excitation of the acceptor at the donor excitation wavelength.
FIGURE 1.

The (---) absorption and (· · ·) emission spectra of the Cy3-DNA donor in the cuvette. Also shown is the absorption spectrum of the (—) DNA-Cy5 acceptor and (shadowed area) spectral overlap, R0 = 54.2 Å.
The emission spectra of the donor-alone Cy3-DNA, acceptor-alone DNA-Cy5, and the D–A pair (Cy3-DNA-Cy5), all with 514-nm excitation, are shown in Figure 2 as observed in a square cuvette without SIFs. The extent of energy transfer is small (a few percent) as seen from the small change in the donor intensity and weak acceptor emission in the D–A pair. In the absence of donor the acceptor emission is severalfold less, showing the minimal amount of directly excited acceptor emission. These spectra are roughly consistent with the low transfer efficiency expected for the R0 value of 54.2 Å and the expected D to A distance near 75.4 Å, as calculated from 3.3 Å per base pair.
FIGURE 2.

The emission spectra of the (—) Cy3-DNA donor, (---) Cy3-DNA-Cy5 donor–acceptor pair, and (· · ·) DNA-Cy5 acceptor at 514-nm excitation. All concentrations are 0.5 μM.
We next examined the D–A pair between two SIFs, as shown in the insert in Figure 3. Such a “sandwich“ geometry has been used in our earlier studies, including fluorescence enhancements of Cy dyes.16 The sample thickness is about 1 μm, and we expect only a fraction of the volume to be affected by the silver islands. The emission spectra of Cy3-DNA-Cy5 show a dramatic increase in the acceptor emissions, suggesting increased energy transfer for the sample between SIFs. These spectra are normalized at the donor emission maximum because accurate intensity measurements are difficult using our experimental geometries. The extent of RET in Figure 3 is somewhat ambiguous because the silver islands affect the intensity of both Cy3-DNA and DNA-Cy5, so that only a fraction of the acceptor emission may be due to RET.
FIGURE 3.
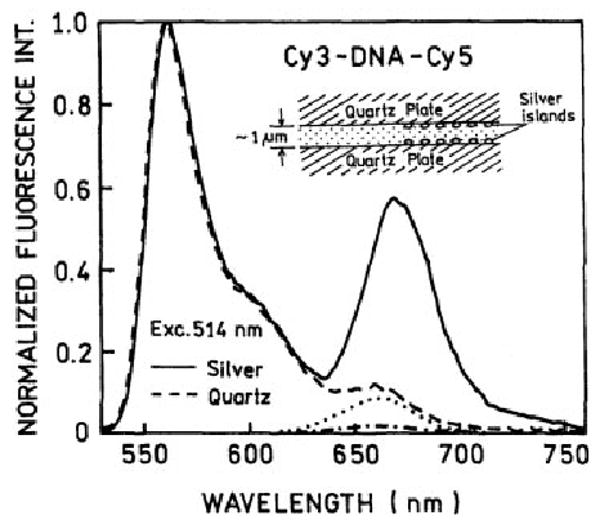
The emission spectra of the Cy3-DNA-Cy5 donor–acceptor between (---) quartz and (—) silver island films at 514-nm excitation. Also shown is the emission of the acceptor-alone DNA-Cy5 on (- • - •) quartz and (· · ·) silver island films under the same experimental conditions.
The problems with comparing the emission intensities measured between quartz plates or SIFs and the possible effects of the SIFs on the emission intensities10,16 make the interpretation of the transfer efficiency of the donor intensities more difficult. However, intensity decay measurements are mostly independent of the total intensity. We first examined the intensity decays of the donor-alone Cy3-DNA and the D–A pair Cy3-DNA-Cy5 in a cuvette (Fig. 4). Using Eq. (5) and the amplitude-weighted lifetimes (Table I) results in a calculated transfer efficiency of 18%. The donor intensity decays were mostly a single exponential for both samples (Table I). For the D–A pair a single exponential donor decay implies a single D to A distance. We analyzed the frequency-domain intensity decays in terms of a distribution of D to A distances. The donor intensity decay could be fit to RET with a distance of 70 Å (Table II) or to the distance distribution model with a 10 Å half-width [Eq. (6)], which reflects a reasonable width for fluorophores attached by a flexible linker to the ends of DNA. This analysis yields a transfer efficiency of 18%.
FIGURE 4.

The frequency-domain intensity decays of Cy3 in the donor-alone Cy3-DNA and in the Cy3-DNA-Cy5 donor–acceptor pair at 514-nm excitation and 565-nm observation.
Table I. Multiexponential Analysis of Cy3-DNA Donor-Only and Cy3-DNA-Cy5 Donor–Acceptor.
| Compound/Condition | τ̄ (ns) | 〈τ〉 (ns) | α1 | f1 | τ1 (ns) | α2 | f2 | τ2 (ns) | α3 | f3 | τ3 (ns) | χR2 |
|---|---|---|---|---|---|---|---|---|---|---|---|---|
| Cy3-DNA, cuvette | 0.87a | 0.66b | 0.924 | 0.773 | 0.55 | 0.076 | 0.227 | 1.96 | — | — | — | 1.8(34.3)c |
| Cy3-DNA-Cy5, cuvette | 0.74 | 0.54 | 0.948 | 0.809 | 0.46 | 0.052 | 0.191 | 1.98 | — | — | — | 1.7(39.0) |
| Cy3-DNA, quartz | 1.73 | 1.36 | 0.589 | 0.329 | 0.76 | 0.411 | 0.671 | 2.22 | — | — | — | 1.3 (64.3) |
| Cy3-DNA-Cy5, quartz | 1.33 | 1.01 | 0.497 | 0.217 | 0.44 | 0.503 | 0.783 | 1.57 | — | — | — | 1.4(129.7) |
| Cy3-DNA, 1 SIF | 1.10 | 0.141 | 0.876 | 0.156 | 0.025 | 0.061 | 0.163 | 0.38 | 0.063 | 0.681 | 1.52 | 1.8(3221) |
| Cy3-DNA-Cy5, 1 SIF | 0.84 | 0.117 | 0.869 | 0.155 | 0.019 | 0.066 | 0.151 | 0.25 | 0.065 | 0.694 | 1.16 | 1.7(3023) |
| Cy3-DNA, 2 SIFs | 0.461 | 0.026 | 0.973 | 0.534 | 0.015 | 0.022 | 0.193 | 0.24 | 0.005 | 0.273 | 1.49 | 2.8 (1247) |
| Cy3-DNA-Cy5, 2 SIFs | 0.284 | 0.017 | 0.974 | 0.627 | 0.011 | 0.023 | 0.162 | 0.12 | 0.003 | 0.211 | 1.20 | 3.8 (588) |
The excitation is 514 nm and the observation is at 565 nm.
value for one-exponential fit.
Table II. Energy Transfer Analysis for Cy3-DNA-Cy5.
| 1 R0 Model | 2 R0 Model | ||||||||||
|---|---|---|---|---|---|---|---|---|---|---|---|
| R0 (Å) | r̄ (Å) | hw (Å) | R01 (Å) | R02 (Å) | r̄ (Å) | hw (Å) | F1a | χR2 | |||
| Cuvette | 〈54.2〉 | 70.0 | 〈0〉 | 1.8 | |||||||
| Cuvette | 〈54.2〉 | 70.6 | 〈10〉 | 1.9 | |||||||
| Quartz | 58.3 | 〈70〉 | 〈0〉 | 8.1 | |||||||
| Quartz | 58.4 | 〈70.6〉 | 〈10〉 | 7.1 | |||||||
| 1 SIF | 57.8 | 〈70〉 | 〈0〉 | 3.0 | |||||||
| 1 SIF | 57.9 | 〈70.6〉 | 〈10〉 | 3.0 | |||||||
| 2 SIFs | 77.2 | 〈70〉 | 〈0〉 | 41.8 | 〈58.3〉 | 118.8 | 〈70〉 | 〈0〉 | 0.72 | 5.6 | |
| 2 SIFs | 78.6 | 〈70.6〉 | 〈10〉 | 39.8 | 〈58.4〉 | 122.1 | 〈70.6〉 | 〈10〉 | 0.72 | 5.8 | |
〈 〉, fixed parameter in analysis; SIF, silver island film.
F2 = 1 − F1
From previous studies16 we knew that the silver particles would affect the donor decays, even in the absence of RET. In addition, it is necessary to know the donor intensity decay in the absence of the acceptor in order to perform the RET analysis.6 Thus, we measured the intensity decay of Cy3 alone between the silver films. The intensity decay of Cy3-DNA was dramatically shortened by the silver islands (Fig. 5). The change in the frequency response was due to short decay time components for the sample near the silver islands (Table I). The intensity decay between silver islands is strongly heterogeneous, which we attribute to at least two donor populations, those close to the silver particles and those distant from the silver particles. The shorter decay time components, which we attribute to the closer donors, account for 73% of the emission (Table I).
FIGURE 5.

The frequency-domain intensity decays of the Cy3-DNA donor between (a) quartz and (b) silver island films. The intensity of the Cy3-DNA donor emission on silver is about twofold higher between silver particles than between quartz plates.
In the next step we examined the donor intensity decays in Cy3-DNA-Cy5 between unsilvered (Fig. 6) and silvered (Fig. 7) quartz plates. The D–A pair was examined between the unsilvered plates to provide the closest possible comparison in the absence and presence of silver particles. The intensity decay of Cy3-DNA remains mostly a single exponential between quartz plates. However, the decay time is longer than in a cuvette (Table I). We do not know the reason for the longer decay time of the donor. The donor decay in Cy3-DNA-Cy5 was analyzed holding the D to A distance as a fixed parameter (Table II). This analysis resulted in a Forster distance of 58.3 Å and a transfer efficiency of 25%. Therefore, the unsilvered quartz plates have only a minor effect on the Forster distance.
FIGURE 6.

The frequency-domain intensity decay of the Cy3-DNA-Cy5 donor–acceptor on quartz. We assumed a donor–acceptor distance (r) of 70.0 Å, which resulted in an apparent Forster distance of 58.4 Å.
FIGURE 7.

The frequency-domain intensity decay of the Cy3-DNA-Cy5 donor–acceptor on silver island film. 64% of energy transfer results in an apparent R0 of 77.2 Å with an assumed donor–acceptor distance (r) of 70 Å. (—) The fit to the data is poor.
We examined the donor decay of Cy3-DNA-Cy5 when placed between SIFs (Fig. 7). The mean decay time of the donor in the D–A pair decreased in the presence of silver islands (Table I). We analyzed these data in terms of the distance distribution model. This analysis yielded an increase in the transfer efficiency to 64% and an apparent Forster distance of 77.2 Å. However, the fit was poor (Fig. 7), suggesting that this distance distribution model was not adequate.
The donor decay in the D–A pair was further analyzed using a model with two Forster distances R01 and R02 [Eq. (8)]. We reasoned that the effect of the silver islands on the energy transfer could be interpreted in terms of different R0 values. At least two R0 values are needed because of the range of distances of the D–A pairs from the silver islands. For this analysis we fixed one value of R0 at the value found between quartz slides, which accounts for the fraction of the molecules unaffected by the silver islands. This analysis yielded an excellent fit to the data (Fig. 8) and a sevenfold decrease in the goodness of fit parameter ; Table II). The second value of R0 was a variable parameter during the least squares analysis. The transfer efficiency was found to be 87%, over a threefold increase as compared to the unsilvered quartz slide. Remarkably, this analysis yielded a second R0 value of 119 Å, which is twofold larger than the unaffected value. In addition, the analysis indicated that 30% of the observed emission was due to the fraction of molecules that were affected by the silver islands. In the interpretation of these data it is important to remember the spatial distribution of fluorophores at various distances from the silver particles. The effect of these particles is thought to extend about 200 Å from ellipsoidal colloids,17 which means only 2–4% of our 1 μm thick samples would be in the active volume. The 30% fraction of the strongly affected D–A pairs disagrees with the estimated 2–4% volume of the sample that is close to the silver particles. To clarify this discrepancy we repeated our experiments with a different sample geometry by using one SIF instead of two SIFs. That is, one side of the sandwich was an SIF and the other an unsilvered quartz plate. This was accomplished by coating different slides with one-third or two-thirds of the area with silver, so that there were regions of the sample between two quartz plates, between one quartz and one SIF, or between two SIFs (Fig. 9, top insert). When there was only one SIF, we found no increase in energy transfer from either steady-state (Fig. 9, middle) or time-resolved data (Fig. 10, Table II). In fact, there appeared to be less energy transfer with one silver plate than with two quartz plates. Furthermore, we did not observe increased energy transfer when two SIFs were separated by over 15 μm, which was obtained using a Teflon spacer.
FIGURE 8.
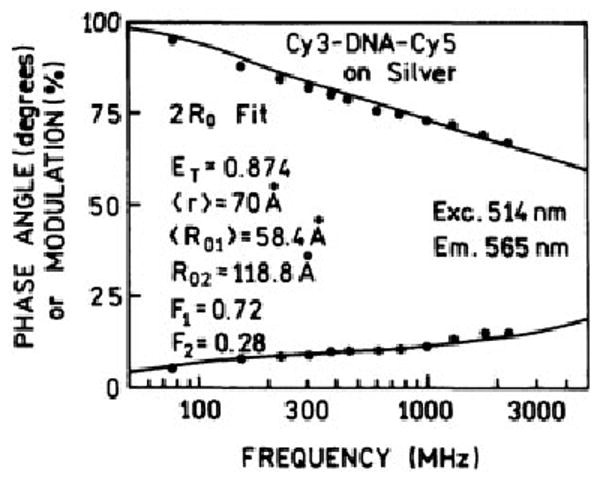
The fit of the frequency-domain intensity decay data of the Cy3-DNA-Cy5 donor–acceptor on silver island films to a model with two Forster distances.
FIGURE 9.

Emission spectra of Cy3-DNA-Cy5 between (a) two quartz plates, (b) one quartz plate and one silvered plate, and (c) between two silvered plates. (---) The emissions of the directly excited Cy5 acceptor in the DNA-Cy5 control sample.
FIGURE 10.

The frequency-domain intensity decay of Cy3-DNA-Cy5 between one silvered surface and one quartz plate.
The observation of increased energy transfer between two SIFs, and no change or less energy transfer near one SIF, suggests that microcavities may have a role in enhancing energy transfer. Increased energy transfer has been predicted theoretically in microactivities.18–21 We believe the increase in energy transfer that we observed between two SIFs is due to a system of microcavities created by the two closely spaced SIFs.
We did not know how many molecules bind to the quartz and SIF surfaces. We also did not know how close proximity to the islands affects energy transfer. Therefore, we covered the slides with Cy3-DNA-Cy5 solution for 24 h followed by extensive washing with the buffer. The sample showed about 10–15% of the original signal. The emission from the SIF showed a decrease rather than an increase in energy transfer efficiency. It appears that the close proximity of molecules to a single silver surface does not enhance the energy transfer efficiency. The increase of energy transfer is induced by a second silvered surface spaced by a micron or submicron distance.
Discussion
In the present experiment there is a spatial heterogeneity that is due to the range of distances of the molecules from the silver islands and molecules affected by one or two silver surfaces. It is interesting to speculate on the extent of RET on the R0 values in the strongly affected region. For the D–A pairs there is a range of distances from the silver surface. We could only recover an apparent value of R0, which was found to be near 120 Å. We believe this is an underestimate of the distances over which RET can occur in the optimum place in the cavity formed by two silvered slides. The intensity decay measurements are weighted by the relative intensities of the donor at each distance from the silver particles. The donor intensity will be increased by an increase in the radiative rate, decreased by energy transfer, and decreased at distances below 50 Å by quenching by the metal.22 For these reasons we do not know the maximum values of R0 that are possible for a D–A pair at the optimal distance from the SIF. Additional experimentation is required with a defined particle size and shape, a defined cavity geometry, a defined distance of the D–A pair from the surface, and a more accurate known separation of two silvered slides in order to obtain a better estimate of the maximal RET distance that can be obtained in a silver island microcavity.
We would like to avoid confusion concerning the fact that in two previous publications we reported an increase in energy transfer near silver particles.10,23 In these experiments the D–A pairs were between two SIFs. We now believe that the increases in energy transfer were attributable to the microcavity effects occurring near two (but not one) layers of SIFs.
Conclusion
We believe that the microcavity system created by two SIFs gives a unique opportunity for the control and manipulation of energy transfer. One can imagine an experimental system with precise motion control. The nanometer changes in the silvered plate distances can be revealed with piezo drivers or with an atomic force microscope. Such nanomechanical control of energy transfer can be used to adjust the R0 value of the system. Alternatively, one could design a flow cell in which the molecules pass through or near one or two silver island surfaces. The signal near one surface could be used to measure the amount of donor or acceptor, and the signal between two silver surfaces could be used to measure long-range metal-enhanced energy transfers.
What are the practical applications of metal-enhanced energy transfer? One obvious application is to measure the RET between donors and acceptors at larger distances on DNA. These distances could be the result of using larger DNA oligomers or using a sequence that hybridizes to separate donor-labeled and acceptor-labeled oligomers. We also expect the use of silver particles to increase the sensitivity of DNA detection, especially at the single molecule level. In these cases fluorophore detection is limited by photodecomposition. Even the most photostable fluorophores degrade after about 100,000 excitation– deexcitation cycles.24 However, the extent of degradation is typically proportional to the duration of the excited state. This implies that a combination of decreased lifetime and increased energy transfer will stabilize the donor against photobleaching. In addition, at high illumination levels, the maximal photon flux from a fluorophore is roughly proportional to the inverse lifetime. We believe the combination of increased photostability, increased maximal photon flux, and larger RET distances provide new opportunities for DNA analysis.
Acknowledgments
The authors acknowledge the support of this work by the NIH Human Genome Institute and the National Center for Research Resources. We thank Dr. Badri P. Maliwal for his help in the design of the oligomer sequences.
Contract grant sponsor: NIH National Center for Research Resources; contract grant numbers: RR-08119, HG-002655, EB-000682, EB-000981.
References
- 1.Wu P, Brand L. Anal Biochem. 1994;218:1–13. doi: 10.1006/abio.1994.1134. [DOI] [PubMed] [Google Scholar]
- 2.Dos Remedios CG, Moens PDJ. J Struct Biol. 1995;115:175–185. doi: 10.1006/jsbi.1995.1042. [DOI] [PubMed] [Google Scholar]
- 3.Selvin PR. IEEE J Selected Top Quantum Electron. 1996;2:1077–1087. [Google Scholar]
- 4.Mathis G. Clin Chem. 1993;39:1953–1959. [PubMed] [Google Scholar]
- 5.Clegg RM. Annu Rev Biochem. 1996;40:83–114. [Google Scholar]
- 6.Cheung HC. In: Topics in Fluorescence Spectroscopy. Lakowicz JR, editor. Vol. 2. Plenum; New York: pp. 127–176. Principles. [Google Scholar]
- 7.Hua XM, Gersten JI, Nitzan A. J Chem Phys. 1985;83:3650–3659. [Google Scholar]
- 8.Gersten JI, Nitzan A. Chem Phys Lett. 1984;104:31–37. [Google Scholar]
- 9.Ni F, Cotton TM. Anal Chem. 1986;58:3159–3163. doi: 10.1021/ac00127a053. [DOI] [PubMed] [Google Scholar]
- 10.Lakowicz JR, Shen Y, D'Auria S, Malicka J, Gryczynski Z, Gryczynski I. Anal Biochem. 2002;301:261–277. doi: 10.1006/abio.2001.5503. [DOI] [PMC free article] [PubMed] [Google Scholar]
- 11.Laczko G, Gryczynski I, Gryczynski Z, Wiczk W, Malak H, Lakowicz JR. Rev Sci Instrum. 1990;61:2331–2337. [Google Scholar]
- 12.Lakowicz JR, Laczko G, Cherek H, Gratton E, Limkeman M. Biophys J. 1994;46:463–477. doi: 10.1016/S0006-3495(84)84043-6. [DOI] [PMC free article] [PubMed] [Google Scholar]
- 13.Grinvald A, Haas E, Steinberg IA. Proc Natl Acad Sci. 1972;69:2273–2277. doi: 10.1073/pnas.69.8.2273. [DOI] [PMC free article] [PubMed] [Google Scholar]
- 14.Cheung HC, Wang CK, Gryczynski I, Wiczk W, Laczko G, Johnson ML, Lakowicz JR. Biochemistry. 1991;30:5238–5247. doi: 10.1021/bi00235a018. [DOI] [PMC free article] [PubMed] [Google Scholar]
- 15.Fung B, Stryer L. Biochemistry. 1978;17:5241–5248. doi: 10.1021/bi00617a025. [DOI] [PubMed] [Google Scholar]
- 16.Malicka J, Gryczynski I, Maliwal BP, Fang J, Lakowicz JR. Biopolym (Biospectrosc) 2003;72:96–104. doi: 10.1002/bip.10301. [DOI] [PubMed] [Google Scholar]
- 17.Gersten J, Nitzan A. J Chem Phys. 1981;75:1139–1152. [Google Scholar]
- 18.Andrew P, Barnes WL. Science. 2000;290:785–788. doi: 10.1126/science.290.5492.785. [DOI] [PubMed] [Google Scholar]
- 19.Kobayashi T, Zheng Q, Sekiguchi T. Phys Rev A. 1995;52:2835–2846. doi: 10.1103/physreva.52.2835. [DOI] [PubMed] [Google Scholar]
- 20.Kurizki G, Kofman AG, Yudson V. Phys Rev A. 1996;53:R35–R38. doi: 10.1103/physreva.53.r35. [DOI] [PubMed] [Google Scholar]
- 21.Agarwal GS, Gupta SD. Phys Rev A. 1998;57:667–670. [Google Scholar]
- 22.Lakowicz JR. Anal Biochem. 2001;298:1–24. doi: 10.1006/abio.2001.5377. [DOI] [PMC free article] [PubMed] [Google Scholar]
- 23.Malicka J, Gryczynski I, Kusba J, Shen Y, Lakowicz JR. Biochem Biophys Res Commun. 2002;294:886–892. doi: 10.1016/S0006-291X(02)00555-7. [DOI] [PMC free article] [PubMed] [Google Scholar]
- 24.Eggeling C, Widengren J, Rigler R, Seidel CAM. In: Applied Fluorescence in Chemistry, Biology and Medicine. Rettig W, Strehmel B, Schrader S, Seifert H, editors. Springer–Verlag; Berlin: 1999. pp. 193–240. [Google Scholar]