Abstract
Phenyl azides with powerful electron-donating substituents are known to deviate from the usual photochemical behavior of other phenyl azides. They do not undergo ring expansion, but form basic nitrenes that protonate to form nitrenium ions. The photochemistry of the widely used photoaffinity labeling system 4-amino-3-nitrophenyl azide, 5, has been studied by transient absorption spectroscopy from femtosecond to microsecond time domains and from a theoretical perspective. The nitrene generation from azide 5 occurs on the S2 surface, in violation of Kasha's rule. The resulting nitrene is a powerful base and abstracts protons extremely rapidly from a variety of sources to form a nitrenium ion. In methanol, this protonation occurs in about 5 ps, which is the fastest intermolecular protonation observed to date. Suitable proton sources include alcohols, amine salts, and even acidic C-H bonds such as acetonitrile. The resulting nitrenium ion is stabilized by the electron-donating 4-amino group to afford a diiminoquinone-like species that collapses relatively slowly to form the ultimate cross-linked product. In some cases in which the anion is a good hydride donor, cross-linking is replaced by reduction of the nitrenium ion to the corresponding amine.
Introduction
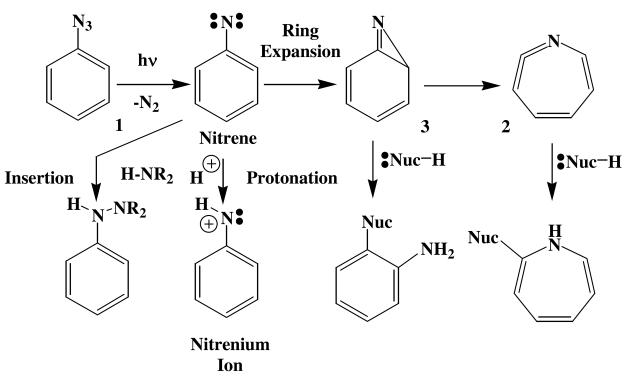
The photochemistry of aryl azides such as 1 has been studied extensively, and been found to be highly diverse. The most commonly encountered mode of reaction is ring expansion of the photochemically generated nitrenes to ketenimines (2) via azirines (3) both of which react rapidly with a wide variety of nucleophiles (Scheme 1).1 In highly acidic media or when substituted with powerful electron-donating groups, aryl nitrenes tend to protonate, thereby forming nitrenium ions,2 and when appropriately substituted with electron-withdrawing groups, aryl nitrenes will undergo insertion reactions into activated σ bonds.3.
Scheme 1.
Voskresenska et al.
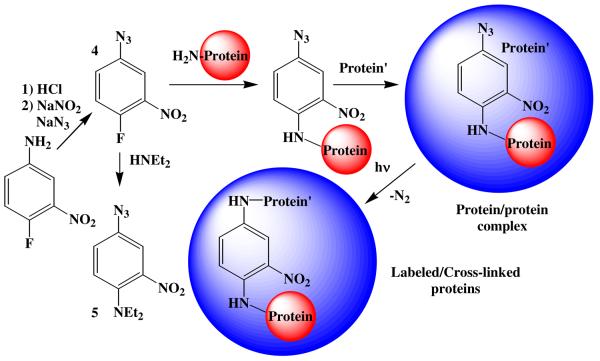
Thus, aryl azides are being widely applied as photoaffinity labeling (PAL) and photocross-linking (PCL) agents in the study of many types of biochemical interactions. The mechanism of action of these reagents is usually considered to be either direct nitrene insertion into protein residues,4 as shown in Scheme 2, or attack of a nucleophilic protein residue on one of the nitrene-derived intermediates related to 2 or 3. More specifically, the PAL/PCL activating agent 4-fluoro-3-nitrophenyl azide (4) has been applied extensively in such studies.5 The mode of action of this PAL/PCL agent has been assumed to be related to the chemistry outlined in Schemes 1 and 2, but no detailed mechanistic study has been conducted to establish its chemistry. In general, the azidederivatized biomolecules used in PAL/PCL studies represent a class of aryl azides in which the azide (nitrene) is in electronic communication with a powerful electron-donating group such as an amino nitrogen (5 in Schemes 2 and 3) or an ether oxygen. We have observed that aryl azides of this class deviate from the usual azirine/ketenimine pathway, (Scheme 1) in that they form the ring substitution products such as those formed from azide 5 shown in Scheme 3. Consequently, the photochemistry of this widely applied 4-amino-3-nitrophenyl azide PAL/PCL system6 has been studied in this work in the presence of nucleophiles using ultrafast pump-probe and theoretical techniques in an effort to better understand its mechanism of reaction. The results of those studies are presented below.
Scheme 2.
Voskresenska et al.
Scheme 3.
Voskresenska et al.
Experimental Section
Ultrafast transient absorption spectroscopy
The ultrafast transient absorption spectrometer used in this work is based on an amplified Ti:Sa laser system (Hurricane, Spectra Physics) that pumps two computer-controlled pump and probe TOPAS-C optical parametric amplifiers (Light Conversion Lt.).7,8 Pump-probe ultrafast transient experiments with azide 5 have been conducted in various solvents at excitation wavelengths of 420, 350, and 305 nm. The white-light continuum generated by focusing a small portion of the 800-nm amplified output into a 3-mm CaF2 window was used as a probe light source. Alternatively, for the 305 pump, the portion of the 800-nm amplified output was delivered to the TOPAS-C probe amplifier to produce UV-probe pulses tunable from 280 to 390 nm. In a typical ultrafast measurement, about 120 ΔA data points were collected at each position of the delay line, and this procedure was repeated about 10 times for averaging. All transient absorption (ΔA) spectra were corrected for the group velocity dispersion of the probe light with an accuracy of ± 30 fs by using the non-resonant or two-photon absorption signals from neat solvent.9 The excitation pulse energy was attenuated to ensure that the ΔA signal due to two- (excitation)-photon absorption by the solvent was minor compared with the single-photon ΔA signal of the azide at delay times equal to or longer than 100 fs.10 The sharp Gaussian transient absorption signal at time zero due to stimulated Raman scattering from solvent11 yielded the instrument response function (150 fs, fwhm). Linearity of the transient absorption signals from the azide was verified by attenuating the excitation light with neutral density filters up to one-fourth of the typically used pulse energy; the extrapolated line passed through the origin. Dissolved oxygen had no noticeable effect on the transient absorption spectra as verified by degassing the azide solution with argon (solvent, i-PrOH). The ΔA spectra (solvent, i-PrOH, 350-nm excitation) were found to be independent of azide concentration (up to 16 mM). Steady-state absorption spectra of the azide solutions measured before and after the pump-probe experiment indicated that the degree of the sample decomposition was always less than 10%. all measurements are performed at magic angle polarization conditions and 22 °C.8
The temporal evolution observed was globally fitted12 to a sum of exponential functions with the time constants , where λ is the probe wavelength, τi are the resulting time constants, and εi are the decay-associated spectra reconstructed from the resulting τi values based on the assumption of a consecutive reaction mechanism. A decay-associated spectrum defines the absorption, which contributes to the recorded ΔA spectra, and which is characteristic of a specific decay component obtained by a global fit. A global fit assumes that the absorption of products species changes only in their strength, not band shape, which may affect the resulting time constants (τi) up to several picoseconds. For each excitation wavelength used, a global fit was performed on 512 kinetic traces within the 274-nm bandwidth of the white-light continuum probe. The region from −125 fs to 125 fs was not used in the global fit because of the solvent contribution to the measured ΔA spectra.
Computational Details
All of the calculations are performed using Turbomole-5.9113 at the Ohio Supercomputer Center, with the exception of the transitions state calculations for formation of adducts 13 and 14, which were carried out using Spartan,14 The azide 5 was optimized using Becke's three-parameter hybrid exchange functional with Lee-Yang-Parr correlation functional (B3LYP)15 methodology and using second-order couple cluster method with resolution-of-identity approximation (RI-CC2)16 with triple-zeta valence polarized (TZVP) basis sets as developed by Ahlrichs and co-workers.17 Other than the azide 5, all of the other species were optimized at the B3LYP/TZVP level. Vertical excitations were obtained at these geometries using time-dependent density functional theory (TD-DFT).18 The open-shell and closed-shell nitrenes were optimized at the CASSCF(4,4)/6-31G(d) level using the Gaussian 0319 program. However, further CASSCF optimizations and CASPT2 single-point energies of open-shell and closed-shell nitrenes using larger active space and more active electrons, i.e., CASSCF(10,10), were performed using MOLCAS 6.2.20 These CASPT2//CASSCF computations were accomplished using the pVDZ basis set of Pierloot, et al.21
Results and Discussion
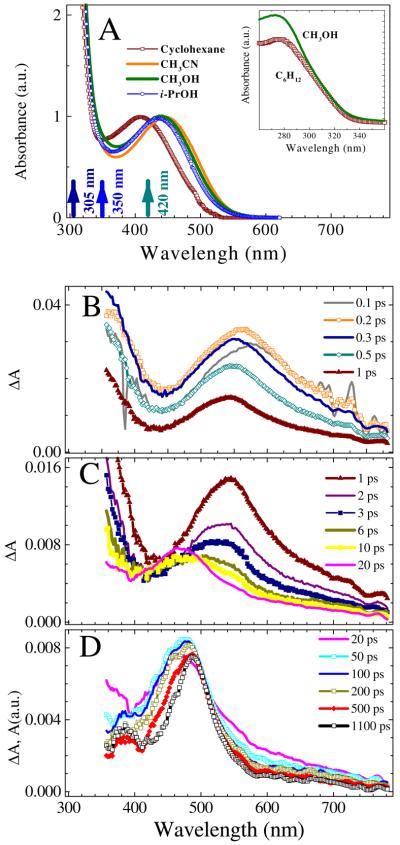
The UV-vis absorption spectrum of azide 5 in i-PROH consists of two broad structureless bands, a weaker one located at 450 nm, and stronger one at about 280 nm (Fig. 1A). The absorption spectra in polar protic and aprotic solvent are similar with ε (445 nm) = 1390 M−1 cm−1 in CH3CN. In non-polar solvents such as cyclohexane, a blue shift (1000-2000 cm−1) of the spectrum is observed. Calculations (TD-B3LYP) suggest the lowest energy transition, S0 → S1, is centered at λmax = 477 nm (f = 0.0042). The S0 → S2 transition is centered at λmax = 353 nm, but it carries no oscillator strength (f = 0.0000). At the same time, the RI-CC2 calculations locate the 352 nm transition (f = 0.0062), but do not show the 477 nm band. Finally, it should be noted that azide 5 did not exhibit any noticeable fluorescence in polar or non-polar solvents (excitation 280-360 nm).
Figure 1.
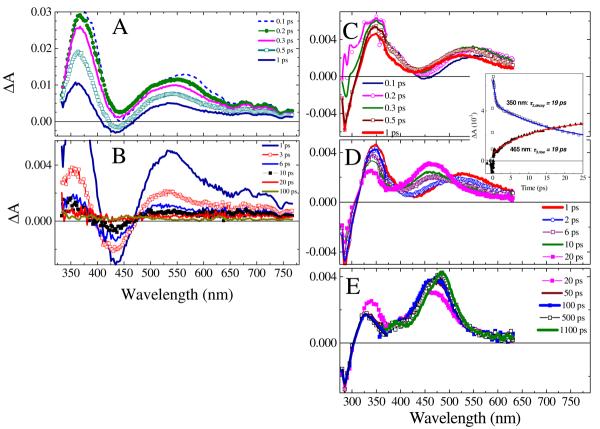
A: The UV-Vis absorption spectra of azide 5 in several solvents (ε(445) = 1390 M−1 cm−1 in CH3CN) normalized to unity at the visible absorption maximum. The UV-part of the spectrum is shown in the inset. The arrows indicate the excitation wavelengths used in the current study. B-D: Transient absorption (ΔA) spectra of a 16 mM solution of azide 5 in i-PrOH shown for various delay times between the 350 nm pump and probe pulses. The solution was flowed through a 0.5-mm flow cell and excited with 4 μJ pulses. The delay times in picoseconds are shown in the frame legends: B (short times, 0.1-1 ps), C (intermediate times, 1-20 ps), and D (long times, 20-1100 ps). Data in D represent smoothed spectra by adjacent-averaging (bandwidth, 3.5 nm). The solvent contribution to the ΔA spectra is minor at delay times equal to or longer than 100 fs, except for the 388.9-nm feature that corresponding to stimulated Raman scattering from i-PrOH and yields11 the instrument response function, 150 fs (fwhm).
Product studies
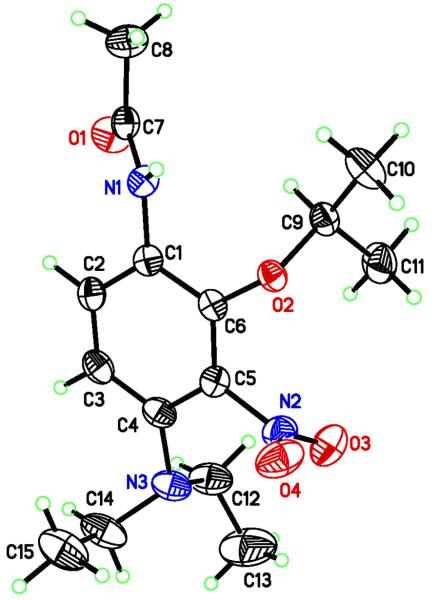
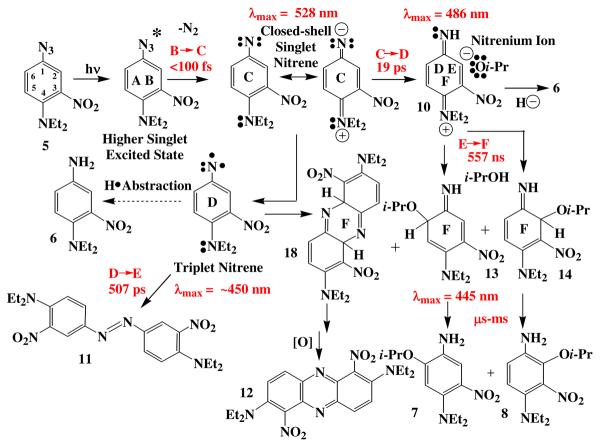
Azide 5 was prepared as indicated in Scheme 2,6 and upon irradiation in i-PrOH, found to undergo photochemical reduction to amine 6 and ring substitution to form 7 and 8, Scheme 3. Surprisingly, the regiochemistry of this substitution reaction favors the formation of the more hindered isomer 8 rather than 7, which can be isolated in only trace amounts. The regiochemistry of this addition has been confirmed by an x-ray crystal structure determination of the acetate 9 (Fig. 2). Initial studies with a variety of nucleophilic solvents under both high and low intensity irradiation conditions gave the reduction/substitution ratios shown in Table 1.
Figure 2.
X-Ray crystal structure of acetylated isopropyl alcohol adduct 9.
Table 1.
Reduction to addition ratio for photoreaction of 5 with various nucleophiles.
| Nucleophiles | Product Ratiosa,b | |
|---|---|---|
| Reduction | Substitution (8)c | |
| MeOH | 10 (2) | 90 (98) |
| i-PrOH | 5 (4) | 95 (96) [7:8 = 4:92] |
| n-BuOH | 7 (5) | 93 (95) |
| t-BuOH | (14) | (86) |
| HOCH2CO2CH3 | − (100) | − (0) |
| HOCH(CH3)CO2C2H5 | 100 (100) | 0 (0) |
| 1,4-HOC6H4OH | 100 (100) | 0 (0) |
| (CH3)2NH2+Cl− | 10 (5) | 90 (95) |
| C6H5OH | 3 (2) | 97 (98) |
Determined by mass spectrometry of photoproducts from laser transient studies.
Determined from preparative runs using a Rayonet Photochemical Reactor in parentheses.
All substitution products are 2-substituted (8) rather than 6-substituted (7) unless noted otherwise
Ultrafast Transient Absorption Spectra
Fig. 1B-D shows the typical ΔA absorption spectra of azide 5 measured in i-PrOH upon 350-nm excitation at time delays starting from 100 fs. The measurements of the ΔA spectra for neat i-PrOH using the identical excitation conditions indicate that significant solvent signals occur at short times −50 and 50 fs. At 100 fs following irradiation of 5 in i-PrOH at 350 nm, transient absorption (positive ΔA signal) is extensive and consists of a broad UV absorption (350-400 nm) and a bell-like visible absorption band centered at 580 nm (Fig. 1B). From 100 to 200 fs, the transient absorption signal rises, while undergoing a small blue-shift to 560 nm. At 300 fs, transient absorption starts decaying and shifts further to the blue. Between 300 fs and 1 ps, the blue-shift continues accompanied by narrowing (570 cm−1) and decay. As time progresses from 1 to 6 ps (Fig. 1C), the visible band blue-shifts even more with the formation of a broad absorption spectrum centered at about 495 nm, and the entire ΔA spectrum decays. From 6 to 20 ps, the visible absorption grows and sharpens to a peak at 470 nm that dominates the ΔA spectrum. The absorption changes from 50 ps to 1000 ps (Fig. 1D), slowly decaying in the 350-400 nm and 525-700 nm ranges, with formation of a narrowed, long-lived band centered at 486 nm with a broad shoulder at around 390 nm.22
The aforementioned transient behavior was compared with that upon excitation at a longer wavelength, 420 nm (Fig. 3A and B). The 100 and 200 fs ΔA spectra display bands at 550 nm and 360-380 nm, which resemble those observed upon 350-nm excitation in their shape, signal amplitude, and decay constants (major components, ca. 0.4 and 3 ps), albeit the 100-200 fs ΔA spectra upon 350-nm excitation are much broader indicating a larger excess of internal energy content of the contributing species, and possibly the formation of new species. With 420-nm excitation, no discernible ΔA signal is observed beyond 20 ps. Vanishing of both bleach (negative ΔA) and transient absorption signals beyond 20 ps indicates the quantitative reformation of the relaxed ground state of azide 5. Thus, a 420-nm photon delivers photoexcitation into the lowest energy band of the absorption spectrum of azide 5, most likely the S0→S1 electronic transition, and neither the 470-nm nor the long-lived 486-nm intermediates were observed.
Figure 3.
Transient absorption (ΔA) spectra of azide 5 (1.2 mM) in i-PrOH for various delay times (in picoseconds, shown in the legends) between the probe and pump pulses. A and B: The solution was flowed through a 0.5 mm flow cell and excited with a 420-nm, 3.5 μJ pulse. C, D, and E: The solution was flowed through a 0.2 mm flow cell and excited with a 305-nm, 3.8 μJ pulse. The solvent contribution to the ΔA spectra is minor at delay times ≥ 100 fs, see Fig. SM1 in Supporting Information. For 305 nm excitation, the UV region (280-375 nm) of the ΔA spectra was measured using the probe light generated by TOPAS ([azide 5] = 1.7 mM, 3.1 μJ pump pulse) and subsequently scaled to the visible (360-665 nm) ΔA spectra measured using the white-light continuum probe. The inset compares the ΔA kinetic traces recorded at probe wavelengths of 350 and 465 nm.
Excitation into to a higher-lying excited electronic state was achieved using 305-nm pump pulses (Fig. 3C-E). As in the case of 350-nm excitation, a ∼100 fs delayed rise of the 550-nm band is observed. However, the short-time ΔA spectra are dominated by the 350-nm product absorption band the formation of which occurs in <100 fs. The 350-nm band decays slightly over 1 ps and significantly over 50 ps (time constant, 19 ps) with a 900 cm−1 blue shift. Over the time that the 350-nm band has decayed by 50%, the 550-nm band vanished completely, indicating that these bands are not related to each other. In general, the short-time 200-fs ΔA spectra observed upon 305- and 350-nm excitation resemble each other (Fig. 1B and 3A), albeit the ΔA signal amplitude is much larger in the 350-nm spectrum. This indicates that 350-nm and 305-nm excitation leads to the formation of several species, which have similar absorption spectra, but that 305-excitation produces mainly the more weakly absorbing components of the 350-nm spectrum. These components ultimately decay to the same species exhibiting the narrow 487-nm band with the 390-nm shoulder that are dominant in the 350-nm ΔA spectra at the longest time delays (1100 ps in Fig. 1D and 3C).
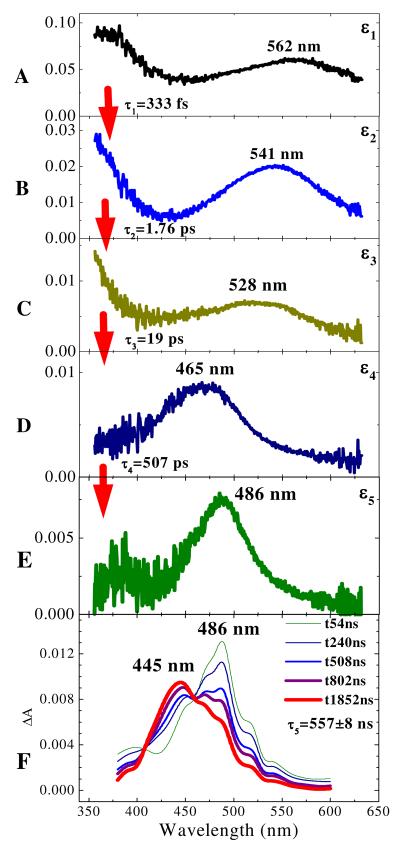
The 305- and 350-nm photoexcitation lead to a complicated spectral evolution, which exhibits several kinetically and spectrally different features, namely, sub-ps, and picosecond components, ∼350-nm and 465-nm bands, and a ∼490-nm product band. Fig. 4 illustrates a good-quality global fit using a sum of four exponential functions and an offset (permanent background spectrum) for azide 5 in i-PrOH excited at 350 nm. The validity of the fitting procedure is evident by comparison of the reconstructed decay-associated spectra maxima with the maxima observed in the time-evolving ΔA spectra (cf. Table 2, entry 7 vs. the maxima at 565, 539, 528, 469, and 486 nm in Fig. 1). Lower quality fits are obtained with a smaller number of time constants, while the increase of a number of time constants leads to no further improvement of χ2 values. It is particularly important to note that the decay of the 350-nm band correlates very well with growth of the ∼465-nm band in this model (see insert in Fig. 3). Only two time constants and a very small permanent background spectrum are required for a satisfactory global fit of the spectrum generated by 420-nm excitation. The resulting time constants are summarized in Table 2, together with the maximum absorption wavelengths (λmax) of the resolved component spectra.
Figure 4.
Reconstructed decay-associated spectra (εi) extracted from the ΔA transient absorption spectra of azide 5 in i-PrOH irradiated with 350 nm laser pulses. The time constants (τi) obtained from a least-square global fit of the 512 ΔA kinetic traces to a sum of four exponential functions and a permanent offset are shown in the insets. A: absorption of excited electronic state of azide 5; B: hot ground state of 5 following internal conversion; C: hot singlet nitrene and probably residual hot ground state of azide 5 at 528 nm; D: triplet nitrene and nitrenium ion 10; E: nitrenium ion 10; F: ns/ μs decay of the nitrenium ion 10 (486 nm) and formation of the adduct 14 (445 nm).
Table 2.
Transient cascade characteristics observed upon irradiation of azide 5 in various solvents. Frames A-E refer to the corresponding time frames in Fig. 4, their associated λmax's and time constants for the solvents indicated.
| Solvent | Pump λ (nm) |
Frame A λmax (nm) |
τ1 (fs) |
Frame B λmax (nm) |
τ2 (ps) |
Frame C λmax (nm) |
τ3 (ps) |
Frame D λmax (nm) |
τ4 (ps) |
Frame E λmax (nm)c |
τ5 (ns) |
|
|---|---|---|---|---|---|---|---|---|---|---|---|---|
| 1 | CH3OH | 350 | 568 | 275 | 547 | 0.904 | 503 | 4.8 | 488 | 446 | 501 | |
| 2 | CH3OD | 350 | 556 | 316 | 543 | 1.07 | 502 | 6.7 | 484 | 430 | 497 | |
| 3 | CD3OD | 350 | 562 | 329 | 547 | 1.21 | 510 | 7.2 | 486 | 481 | 490 | |
| 4 | CH3CH2OH | 350 | 567 | 310 | 539 | 1.4 | 513 | 9.5 | 470 | 394 | 488 | 325 |
| 5 | n-C4H9OH | 350 | 555 | 286 | 544 | 1.28 | 522 | 12.4 | 460 | 275 | 485 | 389 |
| 6 | n-C8H17OH | 350 | 566 | 329 | 539 | 2.05 | 501 | 23.4 | 462 | 435 | 484 | |
| 7 | (CH3)2CHOHa | 350 | 562 | 333 | 541 | 1.76 | 528 | 19 | 465 | 507 | 486 | 557 |
| 8 | (CH3)2CHOHb | 305 | 580-620 | 564 | 540 | 5.46 | 531 | 20.5 | 460 | 833 | 484 | |
| 9 | (CH3)2CHOD | 350 | 562 | 304 | 541 | 1.83 | 528 | 16.4 | 465 | 289 | 486 | - |
| 10 | (CH3)2CHOH | 420 | 559 | 378 | 538 | 2.81 | - | - | - | - | - | - |
| 11 | (CH3)3COH | 350 | 554 | 266 | 539 | 1.28 | 535 | 12.8 | 470 | 833 | 485 | 1260 |
| 12 | HOCH2CO2Et | 350 | 562 | 525 | 535 | 3.28 | 476 | 12.8 | 474 | 1923 | 490 | - |
| 13 | CH3CN (dry)c,d | 350 | 559 | 247 | 523 | 0.71 | 482 | 9.6 | 484 | 238 | 489 | - |
| 14 | CH3CN + 2 M PhOH |
350 | 547 | 231 | 548 | 0.94 | 533 | 11.8 | 479 | 204 | 487 | - |
| 15 | C6H12 | 350 | 550±10 | 422±88 | 522±5 | 3.6± 0.3 |
488±3 | 80±29 | 452±4 | 666 | - | - |
| 16 | C6H12 | 420 | 570 | 430 | 517 | 6.26 | - | - | - | - | - | - |
| 17 | C6H12 + 2M PhOH |
350 | 562 | 276 | 540 | 1.8 | 476 | 17.8 | 456 | 183 | 466 | - |
| 18 | C6H5CH3 | 350 | 569 | 686 | 514 | 23.8 | 543 | 314.5 | 492 | c | - | - |
Plotted in Fig. 4.
S1 absorption is difficult to measure at this exciting wavelength.
Persists to the limit of the time window (1.2 ns) of ultrafast transient absorption experiments.
Well fitted by three exponentials, but these listed data are for four exponentials in order to compare with other data that requires four exponentials for a satisfactory fit.
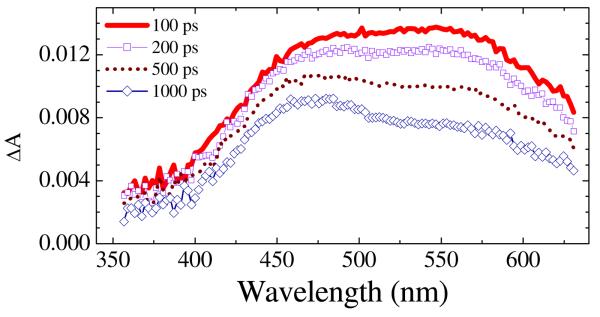
These observations have been extended to longer times using nanosecond spectroscopy (Fig. 4F),8 which for i-PrOH, initially displays the narrow red-shifted band of the 486 nm transient that decays relatively slowly (τ5 = 557±8 ns) to yet another intermediate absorbing at 445 nm. The decay of the 486 nm band matches the growth of the 445 nm band (τ5 = 556±28 ns). The 445 nm transient eventually decays to baseline in the μs domain. This same general pattern is repeated for most other alcohols, amines, ammonium salts, and some carbon compounds with acidic hydrogens such as dimethyl malonate and even acetonitrile (vide infra). In non-acidic solvents, such as toluene (Table 2, entry 18), the sub-ps absorption is very broad extending beyond 700 nm. The ensuing broad transients occur at 514, 543, and 492 nm. The latter 492 nm transient persists beyond a time delay of 1 ns (Fig. 5), and the longer-lived 465, 486, and 445 nm bands usually observed never develop (Table 2, entry 18, and Fig. 4D-F). The full range of transients is observed when the azide 5 is irradiated at 350 nm in acetonitrile (Table 2, entry 13), but irradiation at 420 nm in acetonitrile leads only to the initial transients similar to those observed at this wavelength in i-PrOH (Table 2, entry 10).
Figure 5.
Long-time transient absorption (μA) spectra of azide 5 in toluene upon 350-nm excitation. The solution (16 mM) was circulated through a 0.5-mm pathlength flow cell.
A detailed analysis of the formation of nitrenes that undergo aromatic ring expansion, including ortho- and para-biphenylyl azide and 1-naphthyl azide, has recently been reported.23 Comparing the transient spectra observed in this work with these literature data, we note that the initial absorption spectrum, presumably that of the singlet excited state of 5, occurs at significantly longer wavelength. Thus, in the case of 5 in i-PrOH, an initial broad absorption band centered at 562 nm (τ1 = 333 fs, Table 2, entry 7 and Fig. 4A) is observed in contrast with the previously observed singlet excited state of para-biphenylyl azide, which has an absorption maximum at 480 nm (τ ∼ 100 fs).23 In general, the lifetimes of aryl azide excited singlet states fall between 100 and 600 fs. Consequently, the 333 fs lifetime of the 562 nm species observed in this system is consistent with the singlet excited state of the azide 5. However, this absorption is assigned to the lowest excited singlet state of azide 5 (S1), which does not afford the nitrene (vide infra and Table 2, entry 10).
Theoretical considerations
Active excited state and nitrene formation
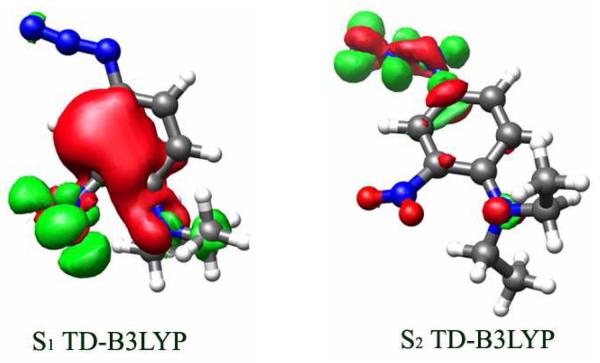
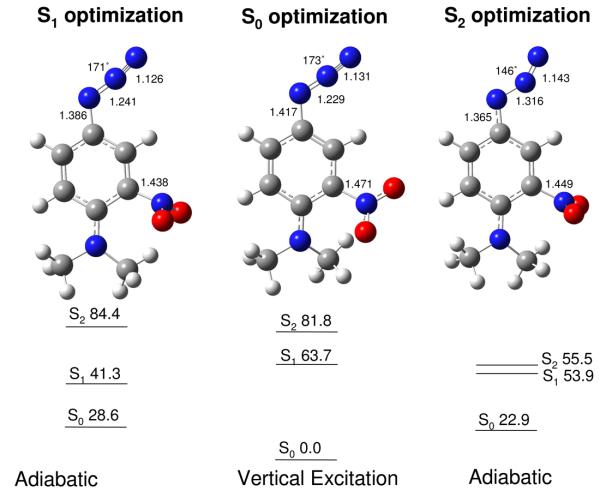
Detailed calculations have been conducted on the azide 5 and its associated nitrene. The first question to be addressed was that of the excited state behavior of the azide 5 in an effort to determine which of the several low-lying excited states would be most likely to produce nitrogen extrusion (Fig. 6). The lowest excited state, S1, is (π,π*) with a shift of electron density from the aromatic ring and the amino group ortho to the nitro group at the TD-B3LYP level of theory, λmax = 477 nm. On the other hand, the second excited state, S2, (π,π*in-plane), is localized on the azide group with a significant loss of electron density between the first and second nitrogen atoms of the azide moiety (TD-B3LYP), λmax = 353 nm (f = 0.0000), Fig. 6, and suggests subsequent elongation of the –N—N2 bond. Furthermore, TD-B3LYP optimization of the S0, S1, and S2 states of the di-N-methyl analog of 5 indicates that the –N—N2 bond lengthens appropriately for the loss of nitrogen and formation of the nitrene in the S2 excited state, but not in the S1 excited state, Fig.7. These correlations clearly indicate that S1 is not an effective precursor state for loss of nitrogen and formation of the nitrene. Consequently, S2 or higher excited states, but not S1, seem to be ideal candidates for the extrusion of nitrogen and formation of the nitrene.
Figure 6.
Electron density redistribution in the (a) S1 and (b) S2 states of 5 calculated at the TD-B3LYP/TZVP level of theory. The green contours depict the accumulation of electron density in the excited state, and the red contours illustrate the loss of electron density from the S0 ground state. The contour values are ±0.005 a.u.
Figure 7.
Excited state energies (kcal/mol) and bond lengths for the optimized geometries (TD-B3LYP) of the ground state, and the first and second excited states of the N,N-dimethyl analog of azide 5.
These calculated energy relationships correlate very nicely with the observed transient behavior of 5. Thus, irradiation of 5 at 420 nm might selectively populate S1 but not S2 (calc. λ(S0→S1) = 477 nm, calc. λ(S0→S2) = 353 nm). The transient cascades outlined in Table 2 indicate that irradiation at 420 nm (entry 10) leads to a broad absorption ca. 559 nm that forms within 400 fs and returns to baseline a few ps later. In contrast, irradiation with 350 nm light (entry 7), which should populate S2 or higher excited states, leads to the complete cascade of transients out into the μs domain. The simplest interpretation of these observations is that 420 nm excitation populates S1 and that this intensely absorbing species returns to the ground state, S0, without loss of molecular nitrogen or nitrene formation. In contrast, 350-nm excitation populates both S1 and S2, since similar initial transient spectra are observed, but the transient cascade extends beyond the decay of S1 with a stream of intermediates arising from the loss of nitrogen and nitrene formation. In this interpretation, the source of the spectra in Fig. 4A is excited state absorption from S1 and S2 or higher. Both of these excited states may de-energize to hot S0 within 1 ps followed by vibrational relaxation (Fig. 4B), but S2 also extrudes N2 within this same time frame leading to formation of the nitrene, which is the spectrum in Fig. 4C (possibly with a small contribution from the 528-nm band of moderately hot S0 of azide 5), and is a precursor for the spectra in Fig. 4D and E. Comparison of the τ1 entries in Table 2 for 420- and 350-nm excitation shows that the short-time constants are not affected; therefore, it seems likely that the S2 lifetime is significantly shorter than the S1 lifetime.
Nitrene electronic configuration
The electronic configuration of the nitrene derived from azide 5 becomes quite important in interpreting the chemistry of this species. This nitrene might exist in any of three electronic configurations: the triplet, the open-shell singlet, or the closed-shell singlet. Considering the time frame of the chemistry occurring in the aforementioned transient section (Fig. 4A-C), the triplet configuration can be excluded, since singlet aryl nitrenes usually require about 100 ps to 10 ns to reach singlet-triplet equilibrium,1a,24 and in the systems studied here, the singlet nitrene (Fig. 4C) proceeds to the next intermediate (Fig. 4D) in < 20 ps.
Therefore, the remaining questions are whether the configuration of the ground state singlet nitrene is closed-shell or open-shell, and which of these is the reactive intermediate in the chemistry to follow. Extensive CASSCF calculations using large electron/orbital sets (CASSCF(10,8)/6-311+G(3df,3pd)//CASSCF(4,4)/6-31G(d)), indicate that the open-shell (OS) singlet is about 6.6 kcal/mol lower in energy than the closed-shell (CS) singlet, and that ΔECS-OS is definitely <10 kcal/mol. Therefore, one can say with a fairly high degree of certainty that the open-shell singlet is the ground singlet state of the nitrene.
However, both ultrafast femto/picosecond and conventional nanosecond spectroscopy, as well as the products observed in the photochemistry of azide 5 seem to be more consistent with the chemistry of a closed-shell nitrene intermediate than an open-shell nitrene intermediate. Intuitively, one expects open-shell singlet nitrenes to engage in single-electron radical or diradical chemistry; in contrast, one expects closed-shell singlet nitrenes to engage in two-electron, acid/base or nucleophile/electrophile chemistry. This type of behavior has been observed by Sheridan25a-c and Tomioka25d for p-phenylenebis(chloromethylene), a bis open-shell dicarbene, and p-phenylenebis(fluoromethylene), a bis closed-shell dicarbene, which bears an intriguing resemblance to the nitrene under study in this work. It should be noted, however, that detailed studies on the differences in reactivity between an open-shell and closed-shell nitrene have not been performed, and so these predictions currently lack rigorous experimental validation.
In the photochemistry of 5, the amine 6 (Scheme 3) might conceivably arise via a radical process, but the substitution products 7 and 8 would be more expeditiously formed via two-electron, closed-shell nitrene chemistry, vide infra.26 Furthermore, the transient species observed in toluene, conditions under which the triplet nitrene and associated radical intermediates should be formed, are distinctly different from those formed under the conditions of the reaction in question (compare Fig. 3 and 4 with Fig. 5). Finally, the calculated C=N bond length for the S2 excited state of the azide 5 is 1.365 Å (Fig. 7), which is significantly closer to the calculated C=N bond length for the closed-shell nitrene, 1.364 Å, than to that calculated for the open-shell nitrene, 1.447 Å.8 Thus, theoretical calculations and experimental evidence can be reconciled if the Franck-Condon excited state of the azide leads directly to the closed-shell nitrene. Since interconversion between the closed- and open-shell singlet nitrene states is forbidden, and thus, a relatively slow process, relative rates of reaction, not singlet nitrene energies, might well determine the course of subsequent reactions.
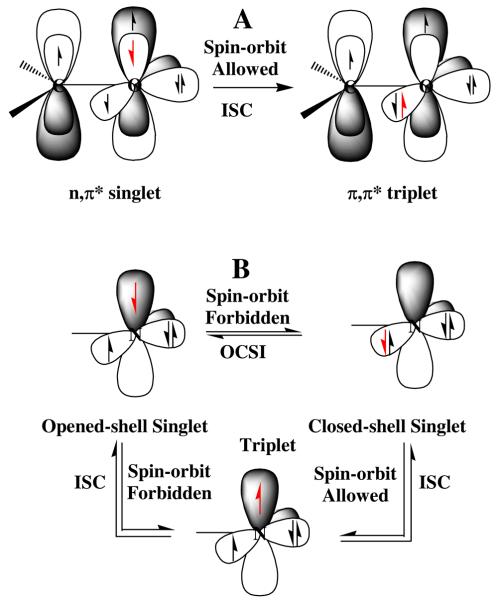
In support of this relative rate scenario, there is a straightforward correlation between singlet-triplet intersystem crossing (ISC) and closed-to-open-shell nitrene interconversion (COSI). An example of which is shown in Fig. 8A for the carbonyl (1n,π*)–(3π,π*) ISC. In this well understood system, ISC (effective rate < 109 s−1), only occurs rapidly if the change in electron spin angular momentum is balanced by a corresponding and opposite change in orbital angular momentum. Thus, the spin flip of the electron is coupled with the redistribution of electron density between orthogonal molecular orbitals. If orthogonal orbitals of similar energy are not available for the conservation of angular momentum, then the higher energy singlet excited state will not readily undergo ISC to the lower energy triplet state, and the singlet state can persist for hundreds of nanoseconds. This is the case with the singlet (π,π*) excited states of aromatic hydrocarbons.27 In Fig. 8B, the relationships between open- and closed-shell singlet and triplet nitrene states are shown. Thus, interconversion between open- and closed-shell singlet states (OCSI) is expected to be highly forbidden, since the change in orbital angular momentum can not be balanced by a corresponding change in electron spin angular momentum. Likewise, the ISC of the open-shell singlet to the corresponding triplet also should be highly forbidden, since the change in electron spin angular momentum can not be balanced by a change in orbital angular momentum. However, the closed-shell singlet nitrene should readily undergo ISC to the triplet nitrene, since this is a spin-orbit allowed process.28 Therefore, even though the closed-shell singlet nitrene may be at higher energy than the open-shell singlet nitrene, it can play a significant role in the chemistry of 5, if it is populated directly upon loss of molecular nitrogen from the singlet excited state of the azide 5, and if it reacts more rapidly than it undergoes interconversion to the open-shell singlet or ISC to the triplet state.
Figure 8.
A: conserved angular momentum in intersystem crossing (ISC) of carbonyl group. B: Relationships between ISC and open- to closed-shell singlet nitrene interconversion (OCSI).
Nitrene formation
On the basis of these calculations and the experimental data, nitrene formation arises from the second, S2, or higher excited singlet states of azide 5. The S1 singlet state decays back to the ground state without giving rise to any transients that survive longer than a few picoseconds (see Table 2 for excitation at 420 nm in i-PrOH, entry 10, and in cyclohexane, entry 16). The source of the spectra in time frames A and B (Table 2 and Fig. 4) is thought to be largely due to the lowest excited singlet S1 state of azide 5 and the vibrationally hot states of the S0 state formed upon internal conversion of S1. In contrast, irradiation at 350 and 305 nm leads to population of S1 and higher energy excited states (S1 + S2 + …), and a cascade of nitrene-derived intermediates extending into much longer time domains. For example, excitation of 5 in i-PrOH at 305 nm (Table 2, entry 8 and Fig. 3) leads to a new absorption at 580-620 nm and intense absorption at 350 nm (time delay, 100 fs) both of which decay over about 20 ps to a species absorbing at 460 nm that in turn decays over about 833 ps to a species absorbing at 484-486 nm. Nanosecond transient absorption spectroscopy shows that this 484-486 nm species slowly (τ5 = 557 ns) decays to the final species observed that absorbs at 445 nm. The nature of the 350 nm species (Fig. 3C-D) that is formed in <100 fs is of central importance. This absorption band is not due to hot S0. Indeed, 420 nm excitation produces 360 nm absorption band that is spectrally different, and also decays with two time constants, 380 fs and 2.8 ps, but leads to no further absorption bands. In contrast, the decay of this 350 nm band occurs with a time constant of 19 ps, and parallels the growth of the 465 nm band. During this evolution, the 350 nm band undergoes a blue shift to 340 nm and spectral narrowing, indicating that the species responsible for the 350 nm band are produced with excess vibrational energy. This 350-nm species is assigned to the hot closed-shell nitrene (Fig. 9 and Table 3). Excitation of 5 at 350 nm in cyclohexane (Table 2, entry 15) produces the same singlet nitrene that decays to the triplet nitrene (τ3 = 80 ps, λmax = 452 nm). When the proton source phenol is added to cyclohexane (Table 2, entry 17, also see Fig. 11C), a very conspicuous new transient is rapidly formed in the 452–480 nm region over ca. 18 ps, and survives for several hundred nanoseconds. These two experiments indicate that two processes compete for the closed-shell nitrene, and that both of these processes yield species absorbing in the 452-480 nm region. One of these is triplet nitrene formation and the other is a proton-dependent process, probably nitrenium ion formation (Table 3).
Figure 9.
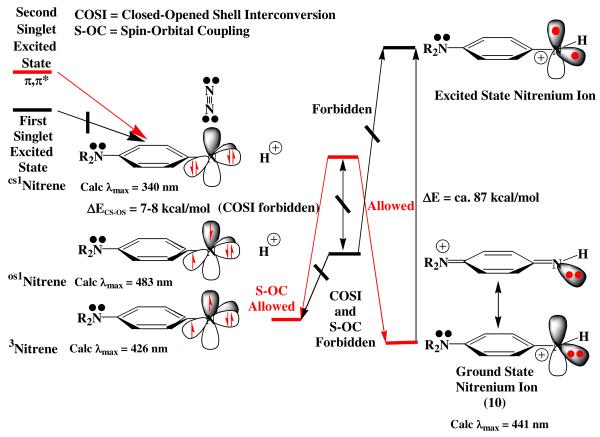
Possible reaction pathways connecting excited states of azide 5, nitrene states,and nitrenium ion (10) states. The vertical energy axis is not drawn to scale.
Table 3.
Vertical transitions and absorption properties of possible reactive species derived from the irradiation of azide 5 as calculated at the TD-B3LYP/TZVP level of theory.
| Species | λmax (nm) | Oscillator Strength (f) |
|---|---|---|
| Closed-shell singlet nitrene | 340 | 0.0065 |
| Open-shell singlet nitrene | 483 | 0.0323 |
| Triplet nitrene | 426 | 0.0828 |
| Nitrogen radical | 447 | 0.0978 |
| Nitrenium ion 10 | 441 | 0.0019 |
| Adduct 13 | 360 | 0.0443 |
| Adduct 14 | 409 | 0.0524 |
Figure 11.
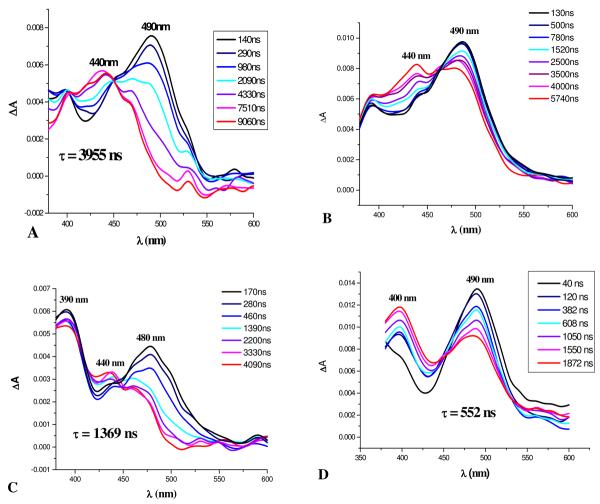
Spectroscopic properties in the ns-μs time domain of azide 5 in: A) dimethyl malonate, B) dimethylamine hydrochloride, C) phenol, and D) hydroquinone with the last three spectra acquired in acetonitrile.
The aforementioned fs-ps spectroscopic observations are correlated by the reaction scheme outlined in Fig. 9. Clearly the lowest excited singlet state of the azide 5 does not lead to nitrene formation, but higher (π,π*) excited states localized mainly on the azide unit, particularly the S2 state, do afford the nitrene. Since similar processes in carbene chemistry have been shown to produce both ground and excited carbene states,24b,29 it is quite possible that the excited closed-shell nitrene is formed initially upon loss of molecular nitrogen in this system. As indicated in the previous discussion, the closed- and open-shell singlet nitrenes should not be readily interconverted without some type of second-order vibronic coupling that is thought to be weak at best.28 Therefore, an initially formed closed-shell nitrene might survive long enough to initiate chemistry unique to its electronic configuration. In fact, the lifetime of this closed-shell nitrene may be governed by ISC to the triplet nitrene, which is a spin-orbit allowed process rather than by decay to the open-shell singlet nitrene, which is a spin-orbit forbidden process.24b,28 Finally, one plausible reaction pathway of the closed-shell nitrene might be protonation, which correlates with the ground state of the nitrenium ion 10. In contrast, protonation of the open-shell nitrene correlates with the excited state of 10 that is estimated to be approximately 87 kcal/mol above the nitrenium ion ground state. In this scenario, the nitrenium ion 10 would be the pivotal reactive intermediate leading to the substitution products 7 and 8, Scheme 3. Many alternative scenarios have been considered for the nitrene reaction cascade.8 For instance, insertion of the closed-shell singlet nitrene directly into the O–H bond of the solvent alcohol to form a hydroxylamine ether might be a possible alternative. While this possibility can not be rigorously excluded, we tend to discount it due to the lack of hydroxylamine ether products in any of the alcohol reaction mixtures. Another mechanistic possibility leading to the nitrenium ion intermediate that we can not rigorously exclude is that the observed nitrene is the lower-energy open-shell singlet state and that protonation occurs with a simultaneous change in electronic state (e.g. open-shell nitrene → closed-shell nitrenium ion). Since fundamental spectroscopic studies of the mechanism of protonation of nitrenes have not been performed, we cannot exclude this concerted mechanism as a possibility.
In the model outlined in Fig. 9, the closed-shell nitrene (Fig. 3B and Fig. 4C) undergoes nitrene protonation in competition with ISC to the triplet nitrene. If the triplet nitrene is generated in this cascade of intermediates, then one must take into consideration hydrogen atom abstraction to form the corresponding nitrogen radical, which is a reasonable precursor for the amine 6. TD-B3LYP calculations indicate that these possible intermediates all absorb in the 340-480 nm region as indicated in Table 3. Clearly, a combination of triplet nitrene, nitrogen radical, and/or nitrenium ion 10 might give rise to the transient spectrum observed in Fig. 3C, or Fig. 4D, which is a broad absorption band centered at 465 nm. This band narrows and shifts to longer wavelength, 486 nm, Fig. 3C or Fig. 4D and E. The band in frame E is also shifted to the red by polar solvents (compare λmax = 484-501 nm in polar solvents, Table 2, entries 1-9, 11, 12, and 14 with λmax = 466 nm in cyclohexane, entry 17). It is interesting to note that the calculated oscillator strengths of the triplet and radical are about 50 times larger that that calculated for the nitrenium ion 10 in Table 3. Consequently, any mixture of (triplet + radical)/nitrenium ion 10 of ca. 2/98 would give overlapping signals of approximately equal intensities as observed in Fig. 4D. While it may be a coincidence, this is about the same ratio that is observed for product formation, amine 6/nitrenium ion adducts 7 and 8 = 5-2/95-98 (Table 2). Apparently in neat protic solvents, the rate constant for nitrene singlet-triplet ISC (τISC−1) is significantly slower than that for protonation (τH−1 = kH). This is also indicated in Table 2, entry 15 in cyclohexane, where protonation is not possible, τ3 = tISC = ca. 80 ps, and entry 17 in cyclohexane/phenol where τ3 = τISC+H = ca. 18 ps. Similar time constants of 60-100 ps. have been observed for singlet-triplet ISC in p-amino-substituted aryl nitrenes.30 Apparently the short wavelength component of the 465 nm band in Fig. 4D is due to small amounts of the triplet nitrene. In support of this assignment, the amine radical was obtained by irradiation of azide 5 in toluene, Table 2, entry 18 and Fig. 5. Under these conditions, a broad band at 543 nm persists and slowly shifts to an intense and broad band centered at 492 nm over ca. 315 ps. In addition, the benzylamine corresponding to benzylation of the nitrene nitrogen was isolated as the main product of this reaction in toluene.8 Therefore, the source of this 492 nm band is most reasonably attributed to the nitrogen radical. These considerations indicate that ISC to the triplet and hydrogen atom abstraction to form the nitrogen radical are relatively slow processes compared to the process shown in Fig. 4C and D, and that the nitrene triplet would be expected to absorb on the short wavelength shoulder of the nitrenium ion absorption band (Table 3). Finally, additional confirmation of the presence of the nitrene triplet in these reactions has been obtained via the isolation of the typical triplet azo dimer 11,1a as well as the unusual oxidized alternative dimer 12,31 Scheme 4, from reactions in non-alcoholic solvents such as acetonitrile. Therefore, the observed rate constant coupling frames C and D is the sum of the rate constants for the two branches of singlet nitrene reactions, kISC + kH, shown in Fig. 9. However, so long as the singlet-triplet ISC branch develops much more slowly, 2h this composite rate constant will largely reflect the much faster rate of the protonation branch.
Scheme 4.
Voskresenska et al.
A factor that might influence the observed rates of protonation is the initial formation of a vibrationally hot singlet nitrene, Fig. 3C and D, which subsequently undergoes a slight blue shift of its spectrum as it cools.32 For example, the nitrene derived from para-biphenylyl azide in acetonitrile has a cooling time constant of 11 ps,23a which is coincident with the time constants for the intermediates involved in Fig. 3C and D. Consequently, it seems highly likely that the protonations observed in this work involve vibrationally hot singlet nitrenes to a significant extent, which may help to account for the rapidity of these protonation reactions.
The identity of the intense band at 486 nm in both Fig. 4E and F is of central importance in determining the pivotal intermediates in this chemistry. The source of this intermediate is thought to be the nitrenium ion 10 arising from protonation of the nitrene, and calculated to have λmax = 441 nm, Table 3. In an effort to evaluate this possibility, the effect of deuterium on the rates of the nitrene protonation step with MeOD and i-PrOD was investigated. These nitrene reactions display little, if any, deuterium kinetic isotope effect (KIE) within experimental error. Thus, kH/kD = 1.4 for methanol (Table 2, entries 1 and 2), and kH/kD = 0.9 for i-PrOH (Table 2, entries 7 and 9). Similar small KIE's ranging from 1.0 to 1.7 are observed for alcohol protonation of arylcarbenes.29d, 33a, b Kirmse and coworkers have discussed the lack of deuterium isotope effects for the reactions of a variety of carbenes with alcohols, and note that it can be attributed to an ‘early’ transition state with little proton transfer from ROH to the carbene, and, correspondingly, little charge development.33c This notion is consistent with the involvement of vibrationally hot species for which an earlier transition state might be expected.
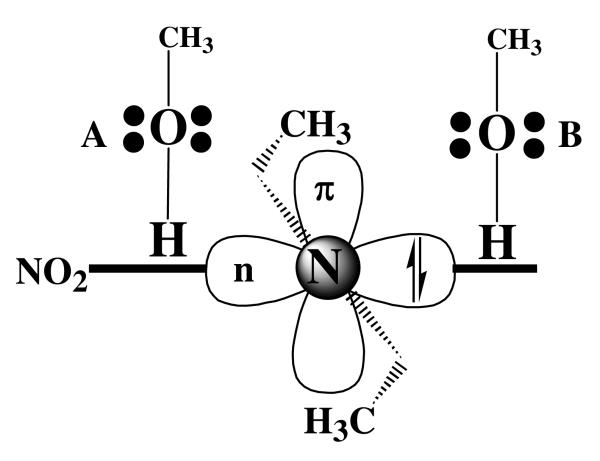
Variations on these suggestions have been explored from a theoretical perspective for the case of the closed-shell singlet nitrene derived from 5 at the B3LYP/6-31G* level as outlined in Fig. 10. While the possibility exists that hydrogen bonding between alcoholic solvents and the azide nitrogen occurs prior to photochemical expulsion of molecular nitrogen, no such stable complex could be observed either experimentally (IR) or theoretically. The question also arises as to the influence of the departing nitrogen molecule on the reactivity of the incipient nitrene. Since the nitrene is formed in a vibrationally hot state, it is assumed that the expelled molecular nitrogen rapidly leaves the immediate vicinity of the nitrene nitrogen, and thus, has little, if any, influence on the reactivity of the nitrene. Furthermore, since nitrenes are only attached to a single substituent, they extend further into solvent space than do carbenes, which are attached to two shielding substituents. As a result, nitrenes are sterically more available to solvent molecules and more flexible to geometric modifications during the course of reactions. Theoretical analyses of the reactions of this nitrene with alcohol have located two transition states for nitrene protonation, and these are described in Table 4.8 These protonation trajectories have small activation energies, ca. ΔE‡ = 4.81–4.43 kcal/mol, and are quite exothermic reactions with ΔH = ca. −40 kcal/mol. In addition, they both have transition states that occur fairly early along the reaction coordinate with the RO–H bond being only ca. 28% broken. Therefore, we assign the 486 nm transient in Fig. 4E and F to the nitrenium ion 10 that results from simple nitrene protonation. The small or lack of a KIE in this protonation process would seem to be due to a combination of factors including the availability of the nitrene nitrogen in solvent space, the early and low activation energy barriers for singlet nitrene protonation, and, at least in the case of methanol, the very rapid protonation of a vibrationally hot nitrene shortly after its formation.
Figure 10.
Two regions of space surrounding the closed-shell singlet nitrene nitrogen and alcohol approach geometries leading to protonation transition states.
Table 4.
Transition state properties for proton abstraction of closed-shell singlet nitrene 10 from methanol. The geometries of these transition states are shown in Figure 10.
| Transition State for Protonation |
AH‡ (kcal/mol) |
νi | A | O-H Bond Distance (Å) |
N-H Bond Distance (Å) |
|---|---|---|---|---|---|
| A | 4.81 | i1119.48 | 56.81 | 1.22 | 1.21 |
| B | 4.43 | i1107.93 | 41.78 | 1.22 | 1.21 |
In alcohol solvents, nitrene protonation occurs over a range of τ3 = 5–23.4 ps with the most rapid being protonation by methanol and the slowest being protonation by n-octanol. The same general dependence on alcohol structure as has been observed in previous work with carbenes in which the most rapid protonation occurs in methanol with other primary, secondary, and tertiary alcohols protonating at slower rates that are similar to each other.33a,b The protonation of the nitrene by methanol observed in this work ranks with the fastest intermolecular proton transfer processes known, which includes the protonation of singlet diphenylcarbene by methanol, τ = 9 ps,33a,b and the protonation of water by several excited photoacids.34a,b
Finally, immediately following protonation, a contact ion pair (CIP) would result. This CIP will rapidly equilibrate to the solvent separated ion pair (SSIP) via a proton relay mechanism (Grotthuss mechanism35) that will redistribute the alkoxide anions in an equilibrated array surrounding the nitrenium ions. Again a parallel exists in the protonation of carbenes. Thus, protonation of singlet di(p-methoxyphenyl)carbene yields a CIP (λmax = 470 nm) which red-shifts to a SSIP (ca. 500 nm) over ca. 700 ps.33b The time constant for this type of proton exchange is estimated to be 55 ps for methanol/methoxide,36 and is expected to be about an order of magnitude slower in i-PrOH,33b which is very close to the time constant observed for the formation of the 486 nm, τ4 = 507 ps, in that solvent, Fig. 4D and E. Therefore, it seems likely that the red shift observed upon going from frame D to E in Fig. 4 is not entirely due to decay of the short wavelength triplet component, but may have a significant contribution from the equilibration of the CIP to the SSIP.
The nitrenium ion 10 is very long-lived to the extent that it can be easily observed by nanosecond transient absorption spectroscopy, Fig. 4F. It slowly undergoes transformation over several hundred nanoseconds to the final intermediate(s) absorbing at 440-445 nm. In the i-PrOH reaction, the source of this absorption seems to be the nucleophile adducts 13 and 14 (Scheme 4) arising from collapse of the SSIP. Based upon the structures of the observed products, 14 will be the major contributor to this absorption, and its absorption is estimated by TD-B3LYP to have λmax = 409 nm, while that of the minor contributor 13 is estimated to have λmax = 360 nm (Table 3). It is perhaps surprising that this ion pair collapse does not occur immediately following the protonation step, but this is clearly not the case, and the SSIP survives into the ns-μs time domains.
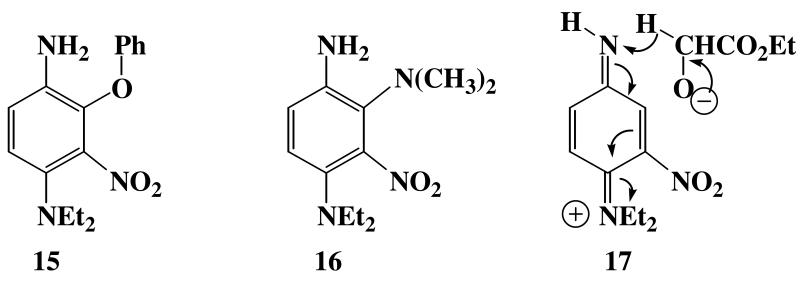
The aforementioned relationships are summarized in Scheme 4, where the absorption characteristics and lifetimes of the intermediates are provided, and related to Fig. 4A-F where their spectra are shown. Several aspects of this general scheme require further comment. The general spectroscopic pattern shown in Fig. 4F is repeated for many different types of proton sources. Some of these are shown in Fig. 11. Carbon acids such as malonate esters, ammonium salts, and phenols all clearly display the characteristic nitrenium ion absorption in the 480-490 nm region. In addition, all of these proton sources except hydroquinone, Fig. 11D, clearly display the characteristic absorption for the nucleophile adduct at about 440 nm. In the cases of phenol and dimethylamine hydrochloride, the adducts 15 and 16, respectively, can be isolated. As indicated above, hydroquinone is a proton source that forms the nitrenium ion 10, Fig. 11D. However, the lack of a 440 nm band indicates that no adduct is formed, and this observation is supported by the fact that hydroquinone yields only the reduction product amine 6, Table 1. Exactly the same reduction pattern is observed for the alcohol ethyl glycolate, which affords only reduction to the amine 6, Table 1. Consequently, in addition to radical pathways for reduction of the nitrene to the amine 6, there appear to be ionic reduction pathways as well. Thus, 10 might undergo reduction to amine 6 via an internal oxidation-reduction of the nitrenium ion pair via hydride transfer from the hydroquinone anion, or ethyl glycolate alkoxide anion as shown in structure 17. In protic solvents, this ionic pathway seems to be the main route for reduction of the nitrene to the amine. However, one can not exclude small contributions to reduction via radical pathways such as that outlined in Scheme 4.
Structures 15, 16, and 17.
Another surprising aspect of these reactions is that the major addition products were always the more hindered regioisomers related to 8, 15, and 16 rather than the less hindered isomers related to 7. This is the case even for the most hindered t-BuOH adduct. Subsequent theoretical calculations, B3LYP/TZVP and B3LYP/6-31G*, indicate that the more hindered i-PrOH adduct 14, (Scheme 4) is 6-8 kcal/mol more stable, and has a 2 kcal/mol lower transition state energy for formation than the less hindered adduct 13. In addition, the possibilities that these adducts can equilibrate with each other via 1,5-alkoxide shifts, or reversion to the starting nitrenium ion pair seem to be excluded on theoretical grounds. Thus, determination of the barriers for equilibration of 13 and 14 via a 1,5-alkoxide shift were determined to be in the 34-42 kcal/mol range and the barriers for return to nitrenium ion in the 41-47 kcal/mol range (B3LYP/6-31G*).8 Therefore, it would appear that the distributions of regioisomers in these reactions are determined kinetically.
Finally, the picosecond transient absorption behavior of the nitrene derived from 5 in dry acetonitrile, Table 2, entry 13, parallels that observed in methanol quite closely, and that in other alcohols reasonably closely. This may mean that the nitrene derived from 5 is sufficiently basic to abstract a proton from acetonitrile (pKa = ca. 25).37 However, the nitrene generation in dry acetonitrile does not give rise to the usual adducts related to 7 and 8. Instead, good yields of the dimer 11 and the oxidized dimer 12 are obtained, 11:12 = 65:35, both of which are derived from triplet nitrenes.31 Analysis of the transient data by any of several kinetic models (see Table 2, entry 13) indicates that the intermediate is formed very rapidly, <10 ps, and in the nanosecond time domain gives rise to a complex of absorptions in the 440 nm region. Absorption in this region would normally signal the formation of adducts related to 14. However, in this system, the 440 nm absorption apparently signals formation of the dimer 18, Scheme 4, or some related intermediate that carries the same chromophore as the adduct 14.
Conclusions
This work has confirmed the earlier observations4 that aryl nitrenes conjugated to powerful electron-donating groups such as amines do not undergo the usual collapse to azirines and ring expansion to ketenimines. Instead these electron-rich nitrenes are strong bases that form nitrenium ions via very rapid proton transfer from a wide variety of proton sources. The nitrenium ions that result in these processes have iminoquinone structures that in past studies have been observed to undergo hydrolysis to quinones in aqueous media. However, when an auxiliary electron-withdrawing group, such as a nitro group, is attached to the aromatic ring, the nitrenium ion becomes a powerful electrophile, and usually undergoes nucleophilic aromatic substitution with the conjugate base of the acid that led to its formation.
This photochemical cross-linking (PCL) reaction has been used in recent biochemical studies to establish the interactions between many classes of biomolecules. In studies of this type, the two primary assumptions are that the introduction of the photocross-linking agent, an amino azide related to 5, will not perturb the natural interactions of the biomolecules, and that when the photocross-linking agent is activated with light, it will react rapidly with critical sites that participate in binding the biomolecules together. Under this set of assumptions, the activated PCL agent will react rapidly with sites in its immediate vicinity before it has time to migrate to alternative sites. In the present work, it has been established that while the initial nitrene protonation step is very rapid in the picosecond time domain, the collapse of the nitrenium ion pair is surprisingly slow, often requiring microseconds for the formation of the critical cross-linking bond. While these critical site/nitrenium ion pairs might be maintained over microseconds by salt bridges before they collapse to form adducts, due caution should be exercised in the interpretation of any PCL studies of biomolecules using this system. This will be particularly true in cases where the cross-linked sites are analyzed in detail in an effort to ascertain the structural nature of associative interactions.
Finally, the results of this study are being used to assist in the development of more effective photocross-linking agents, and while not emphasized in this work, photooxidizing agents for targeting specific biochemical sites.
Supplementary Material
Acknowledgements
We would like to thank Dr. Eric T. Mack (Harvard University) for suggesting that we investigate this system, Dr. Torbjörn Pascher (Lund University, Sweden) for his help with spectra global analysis, Dr. Stephen Macha and Dr. Larry Sallens of the Mass Spectrometry Facility at the University of Cincinnati for providing us with detailed mass spectrometric analysis, and Dr. Eugene Danilov of the Ohio Laboratory for Kinetic Spectroscopy for assistance in the acquisition nanosecond transient absorption data. CMH acknowledges financial support from the National Science Foundation and the National Institutes of Health. Also, generous computational resources from Ohio Supercomputer Center are gratefully acknowledged.
Footnotes
Supporting Information Available: Synthesis of starting materials, characterization of photoproducts, and further spectroscopic and theoretical studies are included in this section. This material is available free of charge via the Internet at http://pubs.acs.org.
References
- 1.(a) Platz MS. In: Reactive Intermediate Chemistry. Moss RA, Platz MS, Jones M Jr., editors. John Wiley & Sons; Hoboken, N.J.; 2004. pp. 501–560. [Google Scholar]; (b) Schnapp KA, Poe R, Leyva E, Soundararajan N, Platz MS. Bioconjugate Chem. 1993;4:172–177. doi: 10.1021/bc00020a010. [DOI] [PubMed] [Google Scholar]; (c) Schnapp KA, Platz MS. Bioconjugate Chem. 1993;4:178–183. doi: 10.1021/bc00020a011. [DOI] [PubMed] [Google Scholar]; (d) Cline MR, Mandel SM, Platz MS. Biochemistry. 2007;46:1981–1987. doi: 10.1021/bi061269j. [DOI] [PubMed] [Google Scholar]; (e) Rizk MS, Shi X, Platz MS. Biochemistry. 2006;45:543–551. doi: 10.1021/bi0516632. [DOI] [PubMed] [Google Scholar]
- 2.Baetzold RC, Tong LKJ. J. Am. Chem. Soc. 1971;93:1347–1353.Sukhai P, McClelland RA. J. Chem. Soc., Perkin Trans. 2. 1996:1529–1530.McClelland RA, Davidse PA, Hadzialic G. J. Am. Chem. Soc. 1995;117:4173–1474.McClelland RA, Kahley MJ, Davidse PA, Hadzialic G. J. Am. Chem. Soc. 1996;118:4794–4803.Ramlall P, McClelland RA. J. Chem. Soc., Perkin Trans. 2. 1999:225–232.Ruane PH, McClelland RA. Can. J. Chem. 2001;79:1875–1880.McClelland RA, Postigo A. Biophys. Chem. 2006;119:213–218. doi: 10.1016/j.bpc.2005.09.014. Unsubstituted aryl azides can be induced to form nitrenium ions, but only under strongly acidic conditions such as in the presence of HCl, Wang J, Burdzinski G, Zhu Z, Platz MS, Carra C, Bally T. J. Am. Chem. Soc. 2007;129:8380–8388. doi: 10.1021/ja071325j., or in formic acid, Wang J, Burdzinski G, Platz MS. Org. Lett. 2007;9:5211–5214. doi: 10.1021/ol7023086.
- 3.(a) Keana JFW, Cai SX. J. Org. Chem. 1990;55:3640–3647. [Google Scholar]; (b) Liang T-Y, Schuster GB. J. Am. Chem. Soc. 1987;109:7803–7810. [Google Scholar]; (c) Soundararajan N, Platz MS. J. Org. Chem. 1990;55:2034–2044. [Google Scholar]
- 4.Chehade KAH, Speilmann HP. J. Org. Chem. 2000;65:4949–4953. doi: 10.1021/jo000402p. [DOI] [PubMed] [Google Scholar]
- 5.(a) Escher EHF, Robert H, Guillemette G. Helv. Chim. Acta. 1979;62:1217–1222. [Google Scholar]; (b) Addo JK, Swamy N, Ray R. Bioorg. & Med. Chem. Letters. 2002;12:279–281. doi: 10.1016/s0960-894x(01)00738-7. [DOI] [PubMed] [Google Scholar]; (c) Mauri L, Prioni S, Loberto N, Chigorno V, Prinetti A, Sonnino S. Glycoconjugate J. 2003;20:11–23. doi: 10.1023/B:GLYC.0000016738.37102.03. [DOI] [PubMed] [Google Scholar]; (d) Sedlák E, Panda M, Dale MP, Weintraub ST, Robinson NC. Biochemistry. 2006;45:746–754. doi: 10.1021/bi050870z. [DOI] [PMC free article] [PubMed] [Google Scholar]
- 6.Lormann MEP, Walker CH, Es-Sayed M, Braese S. Chem. Comm. 2002;12:1296–1297. doi: 10.1039/b201489k. [DOI] [PubMed] [Google Scholar]
- 7.El-Khoury PZ, Tarnovsky >AN. Chem. Phys. Lett. 2008;453:160–166. [Google Scholar]
- 8.See Supporting Information Section for further details.
- 9.Kovalenko SA, Dobryakov AL, Ruthmann J, Ernsting NP. Phys. Rev. A. 1999;59:2369–2382. [Google Scholar]; Rasmusson M, Tarnovsky AN, Åkesson E, Sundström V. Chem. Phys. Lett. 2001;335:201–208. [Google Scholar]
- 10.For an example of the i-PrOH solvent response following 305-nm excitation, see Fig. SM1 in the Supporting Information Section.
- 11.Kovalenko SA, Ernsting NP, Ruthmann J. Chem. Phys. Lett. 1996;258:445–454. [Google Scholar]
- 12.van Stokkum IH, Larsen DS, van Grondelle R. Biochimica et Biophysica Acta. 2004;1657:82–104. doi: 10.1016/j.bbabio.2004.04.011. [DOI] [PubMed] [Google Scholar]
- 13.(a) Ahlrichs R, Bär M, Häser M, Horn H, Kölmel C. Chem. Phys. Lett. 1989;162:165. [Google Scholar]; (b) For the current version of TURBOMOLE, see http://www.turbomole.de.; (c) Treutler O, Ahlrichs R. J. Chem. Phys. 1995;102:346. [Google Scholar]
- 14.Shao Y, et al. Chem. Chem. Phys. Vol. 8. Wavefunction, Inc.; Irvine, CA: 2006. p. 3172. Spartan '06. [Google Scholar]
- 15.(a) Becke AD. J. Chem. Phys. 1993;98:5648–5652. [Google Scholar]; (b) Lee C, Yang W, Parr RG. Phys. Rev. B. 1988;37:785–789. doi: 10.1103/physrevb.37.785. [DOI] [PubMed] [Google Scholar]
- 16.(a) Hättig C, Weigend F. J. Chem. Phys. 2000;113:5154–5161. [Google Scholar]; (b) Hättig C, Kıhn A, Hald K. J. Chem. Phys. 2002;116:5401–5410. [Google Scholar]; (c) Hättig C. J. Chem. Phys. 2003;118:7751–7761. [Google Scholar]
- 17.Weigend F, Häser F, Patzelt H, Ahlrichs R. Chem. Phys. Lett. 1998;294:143–152. [Google Scholar]
- 18.Olivucci M. Computational Photochemistry. Elsevier; Amsterdam: 2005. pp. 92–128. [Google Scholar]
- 19.Frisch MJ, et al. Gaussian 03, Revision C.02. Gaussian, Inc.; Wallingford CT: 2004. [Google Scholar]
- 20.Karlstrom G, Lindh R, Malmqvist P-A, Roos BO, Ryde U, Veryazov V, Widmark P-O, Cossi M, Schimmelpfennig B, Neogrady P, Seijo L. Comp. Mat. Sci. 2003;28:222. [Google Scholar]
- 21.Pierloot K, Dumez B, Widmark PO, Ross BO. Theor. Chim. Acta. 1995;90:87–114. [Google Scholar]
- 22.The transient absorption spectrum of 5 pumped at 350 nm in acetonitrile is provided in Fig. SM2 in the Supporting Information Section.
- 23.(a) Burdzinski G, Hackett JC, Wang J, Gustafson TL, Hadad CM, Platz MS. J. Am. Chem. Soc. 2006;128:13402–13411. doi: 10.1021/ja061520i. [DOI] [PubMed] [Google Scholar]; (b) McCulla RD, Burdzinski G, Platz MS. Org. Lett. 2006;8:1637–1640. doi: 10.1021/ol0602452. [DOI] [PubMed] [Google Scholar]; (c) Gritsan NP, Polshakov DA, Tsao M-L, Platz MS. Photochem. Photobiol. Sci. 2005;4:23–32. doi: 10.1039/b405232c. [DOI] [PubMed] [Google Scholar]
- 24.Gritsan NP, Tigelaar D, Platz MS. J. Phys. Chem. A. 1999;103:4465–4469. Carbenes require a similar time in order to establish singlet-triplet equilibration, Wang J, Kubicki J, Hilinski EF, Mecklenburg SL, Gustafson TL, Platz MS. J. Am. Chem. Soc. 2007;129:13683–13690. doi: 10.1021/ja074612w.
- 25.(a) Zuev PS, Sheridan RS. J. Am. Chem. Soc. 1994;116:9381–9382. [Google Scholar]; (b) Zuev PS, Sheridan RS. J. Org. Chem. 1994;59:2267–2269. [Google Scholar]; (c) Zuev P, Sheridan RS. J. Am. Chem. Soc. 1993;115:3788–3789. [Google Scholar]; (d) Tomioka H, Komatsu K, Nakayama T, Shimizu J. Chem. Lett. 1993:1291–1294. [Google Scholar]
- 26.(a) Falvey DE. In: Reactive Intermediate Chemistry. Moss RA, Platz MS, Jones M Jr., editors. John Wiley & Sons; Hoboken, N.J.: 2004. pp. 593–650. [Google Scholar]; (b) Winter AH, Gibson HH, Falvey DE. J. Org. Chem. 2007;72:8186–8195. doi: 10.1021/jo0708184. [DOI] [PubMed] [Google Scholar]
- 27.Liu YS, de Mayo P, Ware WR. J. Phys. Chem. 1993;97:5987–5994. [Google Scholar]
- 28.Borden WT, Gritsan NP, Hadad CM, Karney WL, Kemnitz CR, Platz MS. Acc. Chem. Res. 2000;33:765–771. doi: 10.1021/ar990030a. [DOI] [PubMed] [Google Scholar]
- 29.(a) Chang KT, Shechter H. J. Am. Chem. Soc. 1979;101:5082–5084. [Google Scholar]; (b) Langan JG, Sitzmann EV, Eisenthal KB. Chem. Phys. Lett. 1984;110:521–527. [Google Scholar]; (c) Wang Y, Sitzmann EV, Novak F, Dupuy C, Eisenthal KB. J. Am. Chem. Soc. 1982;104:3238–3239. [Google Scholar]; (d) Sitzmann EV, Wang Y, Eisenthal KB. J. Phys. Chem. 1983;87:2283–2285. [Google Scholar]
- 30.Irradiation of p-(dimethylamino)phenyl azide in toluene leads to triplet ground state formation in 120 ps, Kobayashi T, Ohtani H, Suzuki K, Yamaoka T. J. Phys. Chem. 1985;89:776–779., but time constant may have involved competitive ISC to the triplet and proton abstraction, Lloyd-Jones GC, Alder RW, Owen-Smith GJ. Chemistry. 2006;12(20):5361–5375. doi: 10.1002/chem.200600266.
- 31.(a) Nay B, Scriven EFV, Suschitzky H, Thomas DR. J. Chem. Soc., Perkin Trans. I. 1980:611–613. [Google Scholar]; (b) Kvaskoff D, Mitschke U, Addicott C, Finnerty J, Bednarek P, Wentrup C. Aust. J. Chem. 2009;62:275–286. [Google Scholar]
- 32.(a) Laermer F, Elsaesser T, Kaiser W. Chem. Phys. Lett. 1989;156:381–386. [Google Scholar]; (b) Miyasaka H, Hagihara M, Okada T, Mataga N. Chem. Phys. Lett. 1992;188:259–264. [Google Scholar]; (c) Schwarzer D, Troe J, Votsmeier M, Zerezke M. J. Chem. Phys. 1996;105:3121–3131. [Google Scholar]; (d) Elsaesser T, Kaiser W. Annu. Rev. Phys. Chem. 1991;42:83–107. [Google Scholar]
- 33.(a) Peon J, Polshakov D, Kohler B. J. Am. Chem. Soc. 2002;124:6428–6438. doi: 10.1021/ja017485r. [DOI] [PubMed] [Google Scholar]; (b) Dix EJ, Goodman JL. J. Phys. Chem. 1994;98:12609–12612. [Google Scholar]; (c) Kirmse W, Guth M, Steenken S. J. Am. Chem. Soc. 1996;118:10838–10849. [Google Scholar]; (d) Wang J, Burdzinski G, Gustafson TL, Platz MS. J. Org. Chem. 2006;71:6221–6228. doi: 10.1021/jo061029+. [DOI] [PubMed] [Google Scholar]; (e) Wang J, Burdzinski G, Gustafson TL, Platz MS. J. Am. Chem. Soc. 2007;129:2597–2606. doi: 10.1021/ja067213u. [DOI] [PubMed] [Google Scholar]; (f) Wang J, Kubicki J, Hilinski EF, Mecklenburg SL, Gustafson TL, Platz MS. J. Am. Chem. Soc. 2007;129:13683–13690. doi: 10.1021/ja074612w. [DOI] [PubMed] [Google Scholar]
- 34.(a) Pines E, Pines D, Barak T, Magnes Ben Zion, Tolbert LM, Haubrich JE. Berichte der Bunsen-Gesellschaft. 1998;102:511–517. [Google Scholar]; (b) Lima JC, Abreu I, Brouillard R, Macanita AL. Chem. Phys. Lett. 1998;298:189–195. [Google Scholar]
- 35.(a) Cukierman S. Biochim Biophys Acta. 2006;1757:876–885. doi: 10.1016/j.bbabio.2005.12.001. [DOI] [PubMed] [Google Scholar]; (b) Voth GA. Acc. Chem. Res. 2006;39:143–150. doi: 10.1021/ar0402098. [DOI] [PubMed] [Google Scholar]; (c) Markovitch O, Chen H, Izvekov S, Paesani F, Voth GA, Agmon N. J. Phys. Chem. B. 2008;112:9456–9466. doi: 10.1021/jp804018y. [DOI] [PubMed] [Google Scholar]; (d) http://www.lsbu.ac.uk/water/grotthuss.html.
- 36.Grunwald E. J. Chem. Phys. 1982;86:1302–1305. [Google Scholar]
- 37.Pearson RG, Dillon RL. J. Am Chem. Soc. 1953;75:2439–2443. [Google Scholar]
Associated Data
This section collects any data citations, data availability statements, or supplementary materials included in this article.


