Abstract
Paramagnetic lanthanide(III) complexes that contain hyperfine-shifted exchangeable protons offer considerable advantages over diamagnetic molecules as chemical exchange saturation transfer (CEST) agents for MRI. As part of a program to investigate avenues to improve the sensitivity of such agents, the CEST characteristics of europium(III) macrocyclic complexes having appended hydroxyethyl groups were investigated. The CEST spectrum of the asymmetrical complex, EuCNPHC3+, shows five distinct peaks for each magnetically nonequivalent exchangeable proton in the molecule. The CEST spectra of this complex were fitted to NMR Bloch theory to yield exchange rates between each of six exchanging proton pools (five on the agent plus bulk water). Exchange between the Eu3+-bound hydroxyl protons and bulk water protons was slow in dry acetonitrile but accelerated incrementally upon stepwise addition of water. In pure water, exchange was too fast to observe a CEST effect. The utility of this class of europium(III) complex for CEST imaging applications is ultimately limited by the small chemical shifts induced by the hydroxyl-appended ligands of this type and the resulting small Δω values for the exchangeable hydroxyl protons.
Introduction
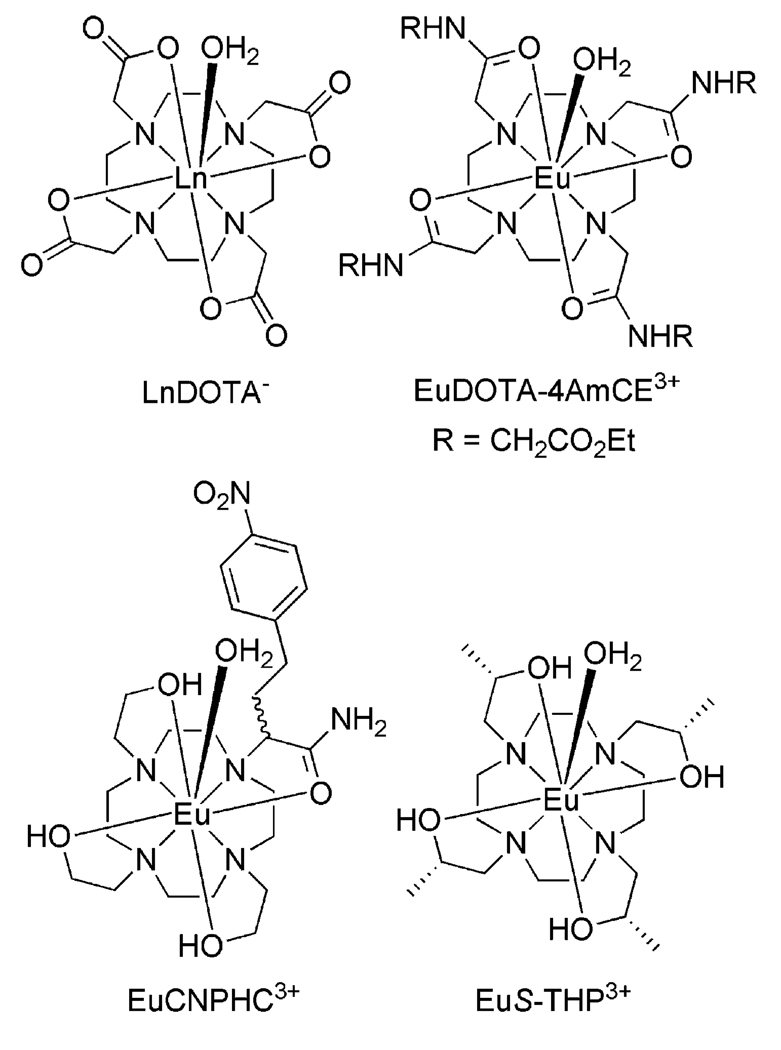
Paramagnetic complexes are now widely used in clinical medicine to provide contrast in magnetic resonance imaging (MRI). The most widely used are complexes of gadolinium-(III) that enhance contrast by shortening the T1 of bulk water protons in those tissues that tend to accumulate such complexes.1 Alternatively, paramagnetic complexes that produce large magnetic susceptibility gradients, such as dysprosium complexes or iron oxide particles, can be used to shorten T2 and produce negative image contrast.2 Recently, a new class of MR contrast agent has been proposed that operate by a completely different mechanism called chemical exchange saturation transfer (CEST).3 CEST contrast is achieved by applying a presaturation pulse at the resonance frequency of an exchanging proton site on a CEST agent, and the resulting saturated or partially saturated spin is transferred to bulk water via chemical exchange. The net effect of CEST is to reduce the total water signal detected in an imaging experiment, thereby providing negative contrast in an image similar to that produced by T2 agents. The effectiveness of a CEST agent is impacted by three factors:4 N, the number of exchanging protons at the presaturation frequency on the agent; τMH, the residence lifetime of the proton on the CEST agent; Δω, the chemical shift difference between the two pools of protons. The number of exchanging sites is important because this directly impacts the concentration of agent required to see a CEST effect. The exchange rate is of course important because, if it is too fast, the exchanging site cannot be activated and, if too slow, no transfer of saturated spins occurs. This means there is an optimal exchange rate for each exchanging site in a CEST agent; if Δω is small, exchange must be relatively slow while, if Δω is large, exchange can be quite fast. Δω is small for diamagnetic CEST agents, typically <5 ppm, so it becomes difficult to saturate at the exchanging site without at least partial saturation of bulk water spins as well. Paramagnetic metal complexes can shift the frequency of an exchanging site in a CEST agent far away from the bulk water signal, thereby substantially increasing Δω. The lanthanide ions have near ideal properties as paramagnetic CEST (PARACEST) agents because they can produce large hyperfine shifts in nearby protons without introducing too much line broadening. Complexes formed between lanthanide ions and more conventional polyamino polycarboxylate ligands such as DOTA or DTPA, however, display rather rapid water exchange and are not good candidates for CEST.5 It was the discovery that replacing these polyanionic ligands by a neutral ligand such as a tetraamide derivative of DOTA results in a decrease of the water exchange rate that has made PARACEST agents possible (Chart 1).6–8 By shifting the resonance of the coordinated water molecule 50 ppm or more from the bulk water resonance, lanthanide tetraamide DOTA derivatives such as EuDOTA–4AmCE3+ have been shown to be effective at generating CEST-enhanced image contrast.9
Chart 1.
Structures of a Lanthanide DOTA Complex, a Europium(III) DOTA Tetraamide Derivative, EuS-THP3+, and EuCNPHC3+
One important goal in the further development of PARACEST agents is to improve sensitivity and hence reduce the required dose. Most often, lanthanide tetraamide complexes have a single inner-sphere coordinated water molecule, and this results in just two protons exchanging with bulk solvent (N = 2). If the value of N could be increased, then the sensitivity of the PARACEST agent would be enhanced proportionately. Replacing the amide ligating functionalities of the ligand with hydroxyl groups could potentially increase the number of highly shifted protons available for exchange without altering the charge of the ligand. Such hydroxyethyl-appended ligands have been widely employed for the chelation of lanthanide(III) ions, and the hydroxyl groups of these ligands are known to retain their protons upon complexation to the metal ion at neutral pH.10–12 These hydroxyl protons are in close proximity to the lanthanide ion and should therefore experience a large shift, resulting in a sizable Δω. If the exchange kinetics of these protons, as well as that of the coordinated water molecule, fall within a suitable range, then the increase in N should lead to an improvement in CEST sensitivity. With this in mind, the CEST characteristics of the europium(III) complexes of S-THP and CNPHC were investigated (Chart 1).
Results and Discussion
High-Resolution 1H NMR Studies
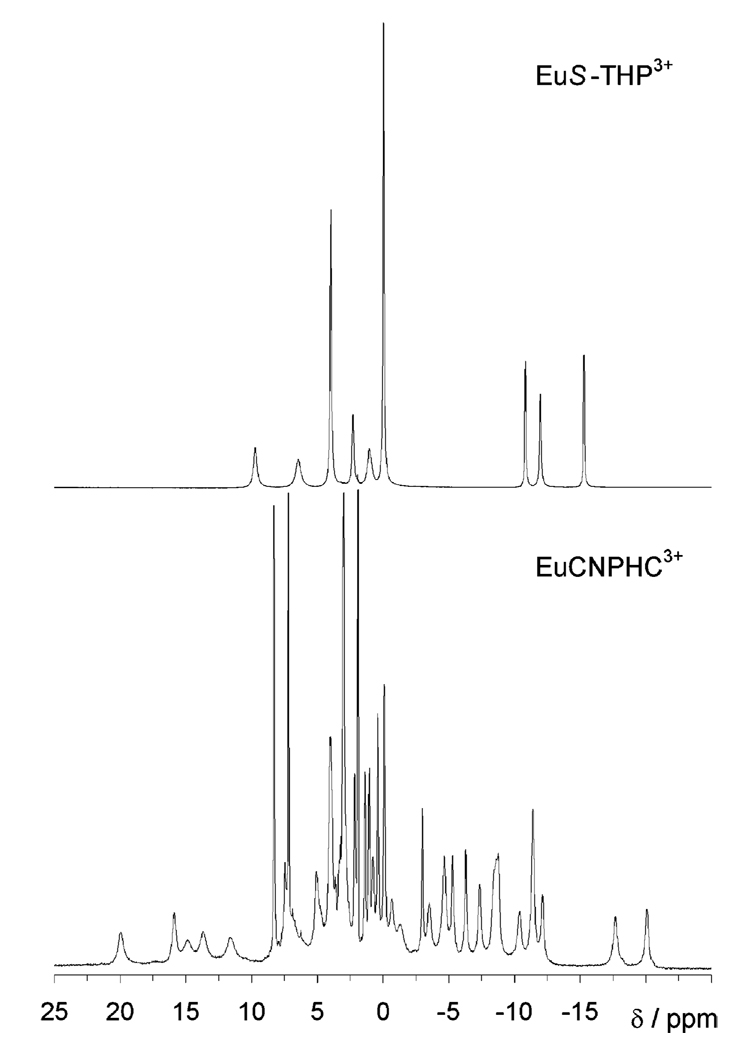
The first step is to establish the chemical shifts of the exchanging sites on a CEST agent. This is most effectively performed by recording the high-resolution 1H NMR spectrum of a thoroughly dried sample of the complex in dry d3-MeCN. In the absence of bulk water, exchange is not possible, and well-defined resonances are observed for all protons. The spectrum of EuCNPHC3+ under dry conditions (Figure 1, bottom) is rather complicated due to the lack of complex symmetry. The spectrum of EuS-THP3+ (Figure 1, top), however, is much simpler consisting of nine resonances which, with the exception of the methyl resonance (at 0.25 ppm), are all of equal intensity. This indicates that, under these conditions, EuS-THP3+ lacks an inner-sphere water molecule.
Figure 1.
High-resolution 1H NMR spectra of thoroughly dried samples of EuS-THP3+ (top) and EuCNPHC3+ (bottom) in dry acetonitrile recorded at 270 MHz and 238 and 296 K, respectively.
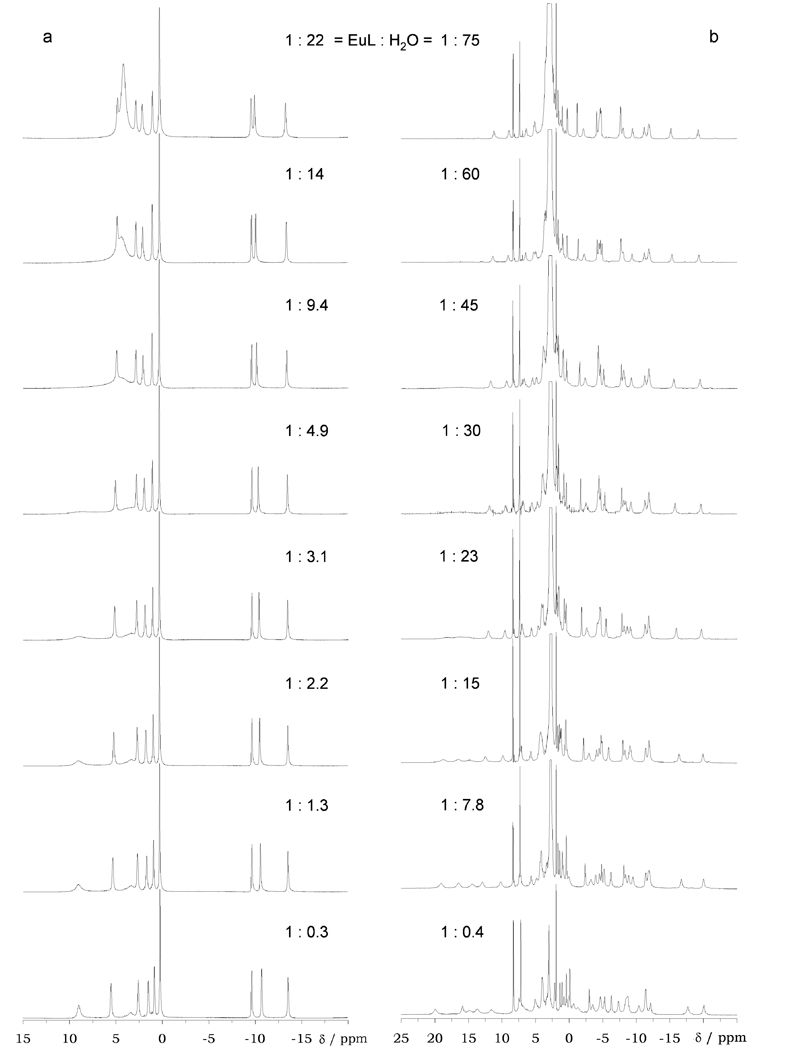
As water is added to each sample, the resonances of all exchangeable protons broaden as a result of chemical exchange. In the case of EuS-THP3+ the most highly downfield-shifted resonance (at 8.9 ppm) broadens as water is added to the sample, suggesting that this resonance corresponds to the hydroxyl protons in the complex (Figure 2). A second broad resonance is observed at 3.0 ppm in the early stages of water addition, corresponding to a coordinated water molecule. As yet more water is added, this peak broadens and merges into the bulk water resonance observed at 4.1 ppm. Thus, it may be reasoned that Δω for the hydroxyl protons is comparatively small (8.9−4.1 = 4.8 ppm) and Δω for the coordinated water molecule is even smaller (4.1−3.0 = 1.1 ppm). On the basis of these assignments, the three peaks shifted furthest downfield in the spectrum of EuCNPHC3+ (19.4, 15.6, and 14.3 ppm)—that are observed to broaden, coalesce, and disappear as water is added—are assigned to the three hydroxyl protons of this complex. Owing to the complexity of the spectrum of EuCNPHC3+ it is not possible to discern the presence of a weakly shifted resonance arising from a coordinated water molecule. Thus, the absence or presence of a coordinated water molecule in this complex was studied using luminescence lifetime measurements.
Figure 2.
Extended spectral width 1H NMR spectra of (a) a 110 mM solution of EuS-THP3+ in dry d3-MeCN with progressive addition of H2O and (b) a 35 mM solution of EuCNPHC3+ in d3-MeCN with progressive addition of H2O to the solution. The concentration of water in each sample is shown alongside the spectrum.
The europium-induced shifts of macrocyclic ligand protons are small in both these complexes in comparison to those observed in EuDOTA− 13 and other analogous complexes.7 This shift is primarily pseudocontact in origin and as such is determined by the distance and orientation of the proton relative to the europium(III) ion and by the magnitude of the ligand field factor D.14 The ligand field factor D is in turn determined by factors such as the polarizability and the arrangement of the ligands around the metal ion.15 EuS-THP3+ is expected to adopt a twisted square antiprismatic coordination geometry (TSAP),16 whereas the tetraamide derivatives of DOTA generally prefer a square antiprismatic geometry (SAP). The arrangement of the donor atoms around the metal ion in the TSAP coordination isomer gives rise to a smaller value of D than that in the SAP isomer, and so for the same donor set the TSAP isomer exhibits smaller chemical shifts. Compounded with this is the fact that the alcohol donor atoms in these ligand systems represent poor ligating groups that produce relatively weak ligand fields and hence induce small hyperfine NMR shifts. In contrast, the acetate donor ligands of DOTA, which are much better donors, induce a relatively stronger ligand field and larger NMR shifts. These factors help explain the remarkably small NMR chemical shift range observed for these complexes. They may also begin to explain the remarkably small chemical shift observed for the coordinated water molecule of EuS-THP3+. Although in the DOTA–tetraamide complexes of europium the coordinated water molecule is usually shifted to +55 ppm or even further downfield, this value is representative of a SAP coordination geometry.7,8 In the TSAP coordinated geometry the coordinated water molecule is observed at +18 ppm in acetonitrile solution,7 but because of the reduced value of D, the coordinated water molecule of EuS-THP3+ was observed at just +3 ppm.
Another feature of the spectra of these complexes is that the peaks in the spectra of these two complexes (Figure 2) undergo small changes in chemical shift as water is added. This is more pronounced in the case of EuCNPHC3+ wherein the span of the spectrum contracts with increasing water concentration. In DOTA–tetraamide complexes it has been observed that the polarizability of the axial ligand can have a significant effect on the magnitude of D and therefore the chemical shifts of the ligand protons.17,18 The tentative assignment that these changes in chemical shifts were due to displacement of acetonitrile from the axial position by water were confirmed by luminescence experiments.
Luminescence Studies
EuS-THP3+ has been reported to have one coordinated water molecule in aqueous solution,10 whereas EuCNPHC3+ reportedly has 1.2 coordinated waters in acidic aqueous media rising to 1.6 in basic aqueous media.12 Given that these complexes are without a coordinated water under dry conditions, presumably addition of water to a dry sample increases the extent of hydration of the complex, depending upon the amount of added water. There are a number of experimental methods for determining the hydration state (q) of a europium(III) ion, but perhaps the most popular is the luminescence method developed by Horrocks.19,20 Since the vibrational levels of OH oscillators overlap with that of emissive excited state of europium(III) (5D0) better than those of OD oscillators, H2O quenches emission from europium(III) more effectively than does D2O. By comparing differences in the rate constants of luminescence decay of europium(III) in protonated versus deuterated solvents, the hydration state, q, may be estimated by using eq 1,
| (1) |
where A is a lanthanide specific proportionality constant (AEu = 1.2), Δk; is the difference between the rate constant of luminescence decay in H2O and D2O, and c is a correction factor. In the present case, the three hydroxyl OH oscillators, the two NH amide oscillators, and any outer-sphere OH oscillators will affect the observed lifetimes and must therefore be taken into account using the correction factor c.12,21 The contribution of each hydroxyl OH oscillator to Δk will be the same as that of a water OH oscillator, 0.41 ms−1; the amide NH oscillators, which are much less efficient quenchers, will contribute just 0.075 ms−1 each. Because the concentration of free water in the samples of interest is low, the contribution of outer-sphere water molecules to the quenching of the europium-(III) excited state is expected to be extremely low, and its contributions were therefore neglected. The result is that for EuCNPHC3+ q can be determined by eq 2.
| (2) |
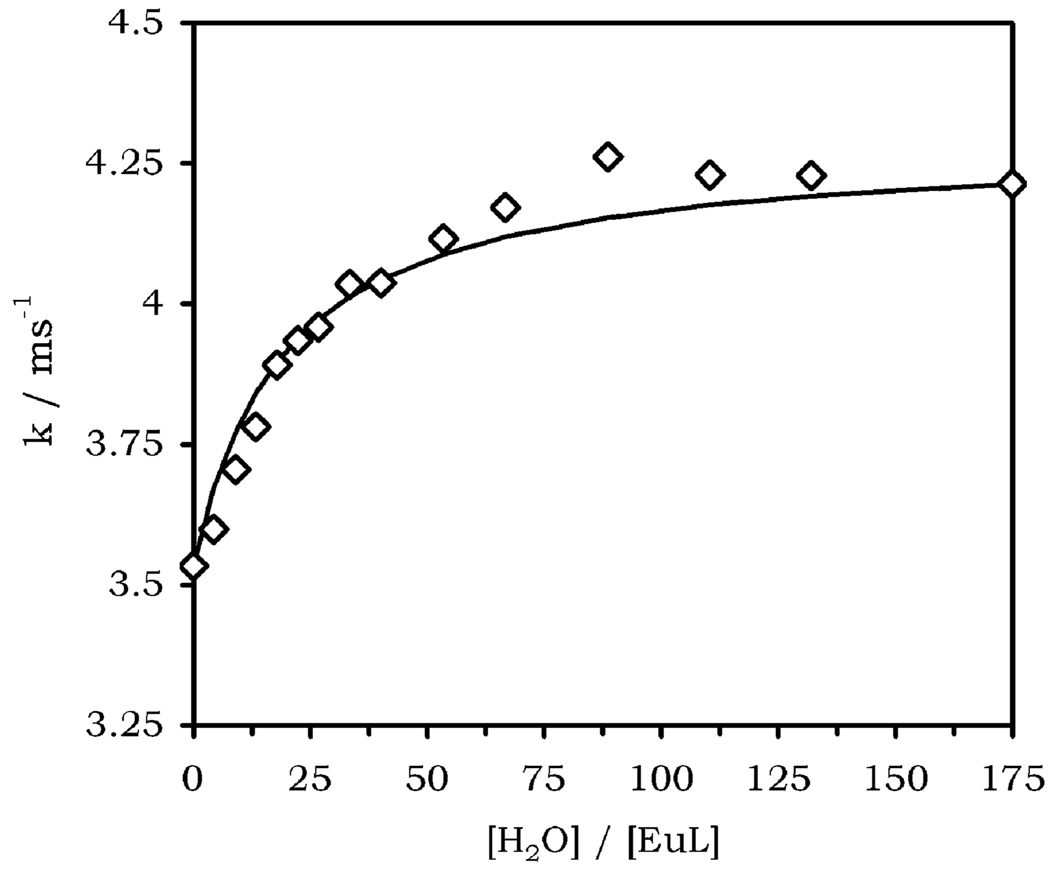
A thoroughly dried sample of EuCNPHC3+ in anhydrous acetonitrile was prepared, and the luminescence lifetime of the europium(III) ion was measured with progressive addition of water. As expected, the rate constant of luminescence decay was found to increase from 3.53 ms−1 in the complete absence of water to 4.21 ms−1 in the presence of 200 or more equivalents of water (Figure 3). This observation is consistent with an increase in the hydration number of the complex. Comparison of these data with those from an identical experiment carried out using D2O should allow the direct calculation of q across these conditions using eq 2. However, it is very difficult to ensure the complete exclusion of protons from the sample at extremely low D2O concentrations which in turn compromises H/D exchange so that luminescence lifetimes for fully deuterated samples cannot be obtained. With this approach barred, the lifetime data obtained in H2O was fitted to a simple 1:1 binding model using a least-squares fitting procedure and assuming that the complex is q = 0 in anhydrous solution and becomes q = 1 as small concentrations of water are added under these conditions. A reasonably good fit to the data was obtained (R2 = 0.977), and a binding constant K = 6.4 M−1 was obtained (Figure 3). This value is similar to that obtained by Parker for a tetraamide derivative of DOTA (K = 24 M−1).18 This number allows the concentration of coordinated water molecules in the NMR samples to be calculated. The value of q was also calculated directly from the experimentally determined lifetimes at higher water concentrations where the D2O measurement is not comprised by ineffective H/D exchange. At [H2O] = 2.813 M the value of Δk was found to be 2.16 ms−1, using eq 2 gave a value of q = 0.94, consistent with a q = 1 complex. At these concentrations a binding constant of K = 6.4 M−1 indicates that 94.4% of the complex is hydrated, confirming that in fact the complex does pass from q = 0 to q = 1 under these conditions.
| (3) |
Figure 3.
Rate constant for luminescence decay as a function of added H2O to a solution of EuCNPHC3+ (8.25 mM) in anhydrous acetonitrile. The curve is consistent with an increase in hydration state of the complex with a binding constant K = 6.4 M−1
The emission spectra of EuCNPHC3+ were recorded as a function of added water (ESI sheet 1) to determine whether one can detect changes in coordination geometry using this technique. Although the precise location of the donor atoms in the coordination polyhedron cannot by determined from the emission spectra of europium(III) complexes, the 5D0 → 7F1 and 7F2 emission bands at 594 and 613 nm, respectively, may be sensitive to changes in coordination number.18 The intensity of the ΔJ = 2 band is considered to be “hypersensitive” to the europium(III) coordination environment, whereas the ΔJ = 1 band consists of two transitions, the separation of which is determined by the axial crystal field coefficient. Although the relative intensities of these bands remained the same as water was added (not shown), the overall intensity of the spectra did diminish slightly due to nonradiative quenching of the europium-(III) excited state by water. The absence of changes in the relative intensities of the ΔJ = 1 and 2 bands supports our hypothesis that the small changes in the lanthanide-induced shifts observed in the NMR spectra are not indicative of substantial changes in the coordination geometry.
CEST Studies
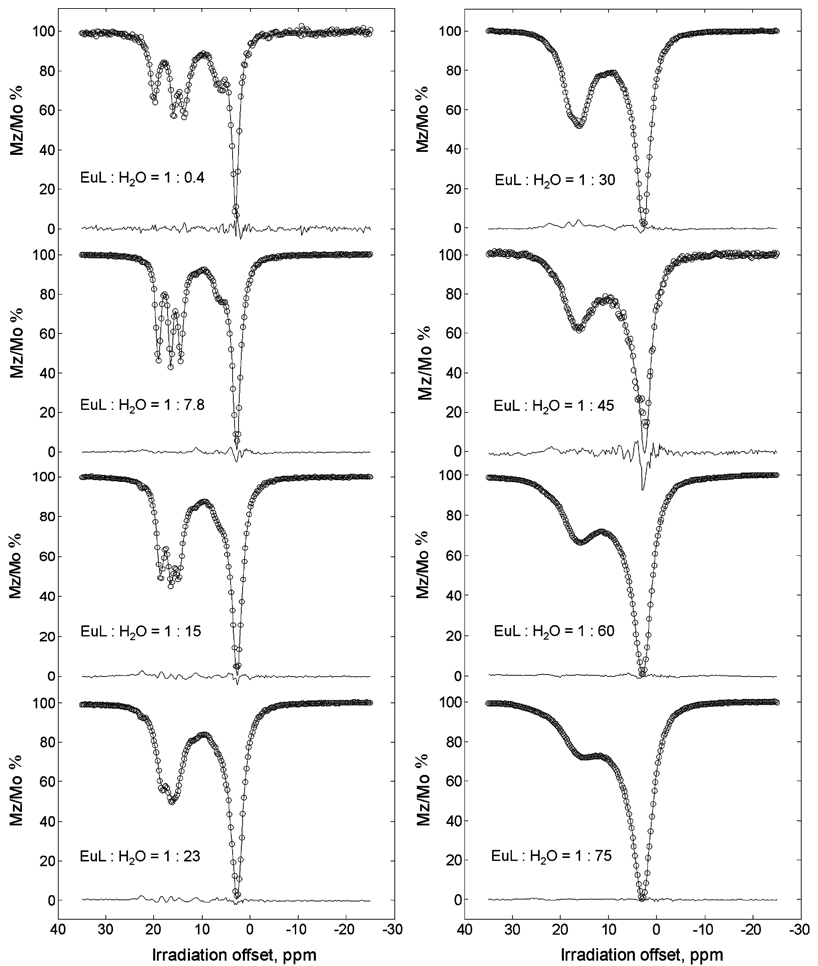
Of the two complexes examined here, EuCNPHC3+ appears to be the more promising candidate as a PARACEST agent. The resonances of the hydroxyl protons have relatively large hyperfine shifts (Δω >11 ppm), and the proton exchange rate remains relatively slow even after addition of water. In contrast, the hydroxyl protons in EuS-THP3+ exhibit a much smaller Δω (~5 ppm, Δω is even smaller for the bound water resonance), comparable to that for typical diamagnetic CEST agents. In addition, the hydroxyl proton resonances exhibit substantial exchange broadening after addition of even small quantities of water, indicative of rapidly accelerated proton exchange. These same features were apparent in the CEST spectra of both complexes. The CEST spectrum of EuS-THP3+ recorded in acetonitrile, with just enough added water to observe a bulk water signal, showed only a small CEST peak as a shoulder on the high-frequency side of the bulk water resonance while the CEST spectrum of EuCNPHC3+ proved to be much more interesting (Figure 4). CEST spectra were collected as a function of added water using various presaturation periods (0.5, 1, and 2 s) and at different applied presaturation power (B1) values (86, 108, 135, 225, 290, and 302 Hz). As anticipated on the basis of exchange theory, an increase in B1 resulted in increased CEST22 but also increased spectral line broadening. The CEST spectrum of EuCNPHC3+ recorded at the two lowest water concentrations showed a total of five CEST peaks, three corresponding to the three nonequivalent hydroxyl protons, one to the coordinated water molecule (observed as a shoulder on the high-frequency side of bulk water), and one to the amide proton (observed as a shoulder on the low-frequency side of bulk water). As more water was added, the bulk water resonance broadened to an extent whereby the coordinated water and amide CEST peaks were no longer resolved. Additionally, the peaks arising from the hydroxyl protons broaden, shift, and merge such that at higher water concentrations ([H2O] > 1000 mM) they appear as a single broad CEST peak.
Figure 4.
CEST profiles of a 36 mM solution of EuCNPHC3+ at different water concentrations, recorded in d3-MeCN at 296 K and 270 MHz with presaturation power of 86 Hz and duration of 2 s.
The spectrum of EuCNPHC3+, recorded at the lowest water concentrations, offered a unique opportunity to investigate the individual exchange processes that occur between five different exchange sites within a single complex. The Bloch equations23 modified for chemical exchange have long been used to describe exchange processes in NMR experiments, but only recently has a complete solution to these equations been feasible for mathematical fitting procedures.22 A model incorporating six exchanging pools (five sites on the complex exchanging with bulk water) was derived from the modified Bloch equations and used to fit the CEST spectra of EuCNPHC3+. Since further increases in CEST intensity did not occur for presaturation periods greater than 2 s, it was assumed that the 2 s spectra were at steady state, and these were chosen for initial fitting. The fitting procedure was limited to spectra recorded only at the lower presaturation powers, 86 and 108 Hz.
The CEST spectrum of a system comprising six exchanging pools of protons is described by 23 different NMR parameters, the T1, T2, and chemical shifts of each exchanging site and five exchange rates. A six-site exchange model, based upon an extension of a previous three-site exchange model,22 was devised in which each exchangeable proton of the complex is able to exchange with the bulk water but none are permitted to exchange with other exchangeable protons of the complex. The concentration of each pool of exchanging protons could be determined from the known complex concentration and the binding constant of the complex with water. The chemical shift of each pool was first determined from 1D 1H NMR spectra (Figure 2) and the T1 values were determined experimentally for samples at lower water concentrations. However, owing to line broadening caused by chemical exchange and to the paramagnetic line broadening caused by the europium(III) ion, measurement of T2 from high-resolution NMR spectra was not possible. Since T2 must be ≤ to T1, the T2 values in the data fitting process were constrained by these limits. The measured T1 values for each exchanging resonance, except the bound water and amide resonances, are summarized in the electronic Supporting Information (ESI 1). As water was added to the sample, the amide and hydroxyl resonances broaden and eventually disappear, hampering the T1 measurement. Accordingly, T1 was only measured up to the point at which line broadening prevented reliable measurement. It was found that the T1 of the hydroxyl protons was not significantly affected by the first two additions of water, and given the impossibility of T1 measurement at higher water concentrations, it was assumed that the T1’s of the protons in the complex do not change as the water concentration was increased. The T1 of the Eu–OH2 protons and of the amide protons, which could not be measured, were assumed to be the same as the hydroxyl protons, although inevitably this assumption decreases the reliability of the fitted parameters of these exchanging pools.
The data collected at each water concentration was then fitted to this model after fixing the T1 values to those listed in ESI S1. Initial attempts to fit the data by allowing the T2 values to float were not satisfactory. Good fits, except for the sample with the lowest water concentration, were obtained with T2 < T1 for the EuCNPHC3+ protons and T2 = T1 for the bulk water protons (T2 and T1 are thought to be nearly equal for bulk water in these samples). For the sample with the lowest water concentration, a satisfactory fit was obtained with the constraint T2 < T1 for the bulk water. The fits to the data were best at the lower water concentrations where the spectra were better resolved. Nonetheless, given that the resonances of the three hydroxyl protons shift together, eventually coalescing into a single broad peak, this model may not account for all the exchange processes. A second six-site exchange model, which allowed the hydroxyl protons to exchange with one another as well as with those of bulk water, was also used to fit the data in comparison. Although the data also fit well to this model, the rate of intramolecular exchange between the hydroxyl protons was found to be extremely slow (~2 s−1). We presume therefore that intramolecular exchange between the hydroxyl protons does not occur to a significant extent in this complex. As a result the exchange rate constants presented in Table 1 are those obtained from the model in which exchange is permitted only with the bulk water.
Table 1.
Rate Constant for Proton Exchange with Bulk Water of Each Pool of Exchanging Protons in EuCNPHC3+ a
| exchange rate constant/103 s−1 | |||||
|---|---|---|---|---|---|
| H2O molecules per EuL |
OH (19 ppm) |
OH (16 ppm) |
OH (14 ppm) |
Eu–OH2b | amideb |
| 0.4 | 0.014 | 0.015 | 0.016 | 0.14 | 0.008 |
| 7.8 | 0.34 | 0.35 | 0.36 | 0.036 | 2. 9 |
| 15 | 1.1 | 0.88 | 1.2 | 0.021 | * |
| 23 | 1.9 | 2.0 | 1.6 | 0.011 | * |
| 30 | 3.0c | * | * | ||
| 45 | 2.7c | * | * | ||
| 60 | 4.6c | * | * | ||
| 75 | 4.8c | * | * | ||
The entries are the averages of the results from fitting of the B1 = 86 and 108 Hz CEST spectra. For samples with higher water concentrations, average values for the rate constants of the three hydroxyl protons are given, due to the difficulty of resolving the peaks in the fitting process.
Asterisks represent values that could not be satisfactorily determined in the fitting process due to the poor resolution of the CEST peak arising from this pool at the water concentration in question.
Average values for all three hydroxyl protons.
The results of the data fitting show that at the lowest water concentration all exchangeable protons on EuCNPHC3+ exchange with the bulk water protons rather slowly. Owing to the poor resolution of the amide proton and coordinated water molecule resonances, the exchange rates for these pools have a large uncertainty. In contrast, the peaks corresponding to the hydroxyl protons are well resolved even at slightly higher water concentrations, and the exchange rates obtained for these pools are much more reliable.
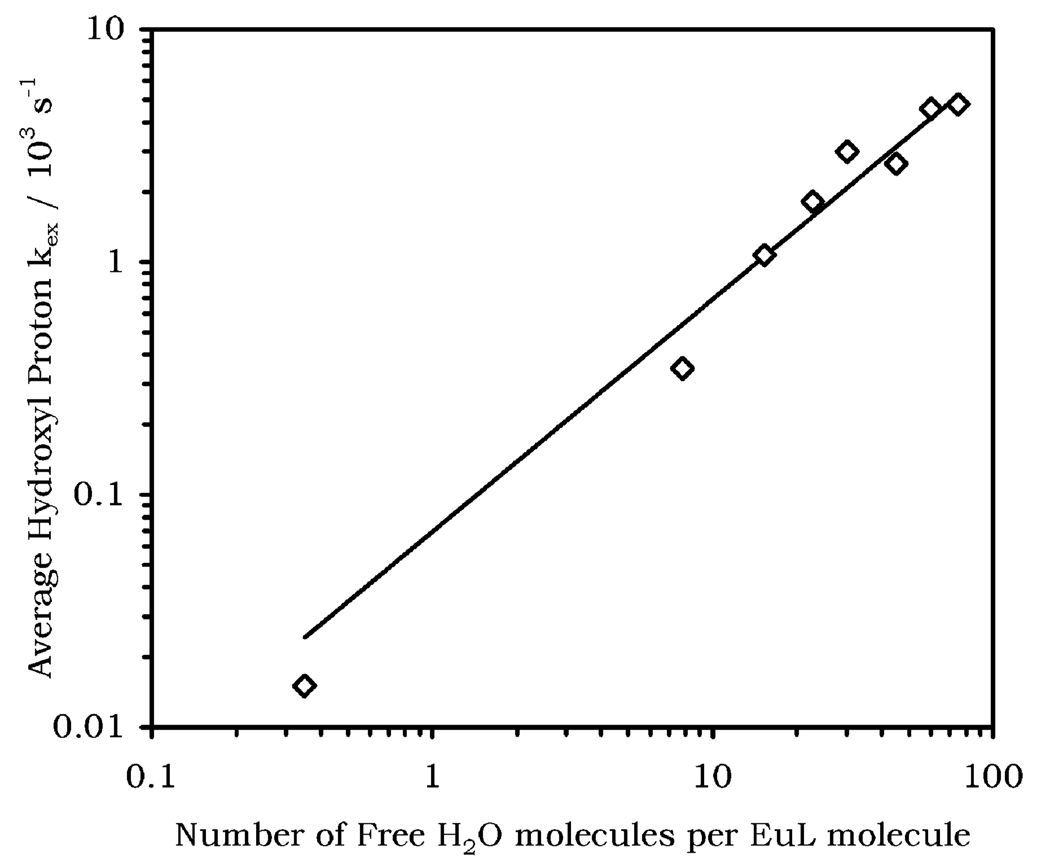
From Table 1 it can be seen that the three hydroxyl protons in EuCNPHC3+ exchange with the bulk water at comparable rates and the rate constant increases as more water was added. Since the three hydroxyl peaks move together eventually forming one large CEST peak when [H2O] > 1000 mM, the exchange rate for each individual hydroxyl proton becomes more difficult to determine, and an average value for the three hydroxyl protons is a more reliable indicator of the exchange processes. When the exchange rate constants for the three hydroxyl protons obtained using B1 = 86 and 108 Hz were averaged, it was found that there is a linear increase in exchange rate constant with [H2O] (Figure 5). This acceleration in proton exchange has significant implication for the use of this complex as a CEST agent.
Figure 5.
Average hydroxyl proton exchange rate constant (the average of the six values for the three hydroxyls with presaturation powers of 86 and 108 Hz) versus the number of free water molecules per EuL molecule.
To be useful for CEST imaging, an agent must observe the slow exchange condition for NMR experiments set out by eq 4. Thus, for a maximum Δω of 17 ppm the smallest value of τM to satisfy eq 4 at 270 MHz would be 220 µs (kex = 4590 s−1). In other words, at an average exchange rate constant of about 5000 s−1, this system is already approaching its maximum permissible exchange rate for CEST experiments at water concentrations less than 3 M. It is to be expected that as water is added above this level, the CEST effect would fall off rapidly as exchange exceeds the condition in eq 4. It is not surprising, therefore, that when CEST spectra of EuCNPHC3+ are acquired in 50% and 100% water solutions no CEST effect can be observed. The reason for this is clearly that exchange has accelerated beyond the slow exchange limit.
| (4) |
Conclusions
The magnitude of the hyperfine shift, largely pseudocontact in origin, experienced by protons in paramagnetic lanthanide complexes is governed by geometrical constraints (distance and angle with respect to the magnetic anisotropy of the metal ion center) and a number of ligand field parameters. In complexes derived from cyclen, it is the ligand field parameters, described in more detail by Bleaney24,25 and Binnemans,15 rather than the distance and orientation of the protons, that has the largest effect in determining the magnitude of the hyperfine pseudocontact shifts of protons in such complexes. In complexes with strong donor groups such as DOTA, the induced shifts are large, whereas in complexes consisting of weaker donor atoms, such as tetraamide derivatives, the induced shifts tend to be smaller. The relative ligand field experienced by the europium(III) ion in complexes containing several hydroxyethyl pendant groups is weaker still and hence the proton hyperfine shifts in these complexes are even smaller. The result is that the chemical shift differences between bulk water protons and all the exchanging pools of protons in the complex are very small in EuS-THP3+, a ligand containing four alcohol pendant groups. Although the induced shifts are larger in the case of EuCNPHC3+, perhaps owing to the presence of one amide donor group, the chemical shift difference, Δω, remains relatively small for this complex. Nevertheless, in acetonitrile containing only a small amount of water, proton exchange is slow enough for the CEST requirement (eq 4) to be met in the case of EuCNPHC3+. In dry samples, five CEST peaks for each of five exchanging pools of protons may be observed, and a model derived from the Bloch equations may be used to extract exchange rate information. The rates of exchange of the amide and coordinated water molecule could not be reliably determined as the water content was increased. The rate constant for exchange of the hydroxyl protons, on the other hand, was found to accelerate linearly with increasing water concentration. This acceleration eventually exceeds that permitted by the intermediate exchange condition and a CEST effect is no longer observed. In EuS-THP3+, Δω is so small and exchange is so rapid that, even under dry conditions, no appreciable CEST can be observed. This effectively means that europium(III) complexes of this type of ligand cannot be employed as CEST agents in pure water systems.
To satisfy the CEST conditions for a complex with such rapid exchange kinetics, it would be necessary to increase the shift difference between the exchanging pools and the bulk water signal. Assuming that the linear dependence of hydroxyl proton exchange on water concentration is linear across the entire spectrum of water concentrations, then the exchange rate constant in pure water can be determined by extrapolation of the results in Figure 5. This calculation estimates a kex of ~1.1 × 10⁵ s−1 (τM = 9.3 µs) in pure water. Such rapid exchange kinetics would require a minimum Δω value of 40 ppm. This suggests that a lanthanide with a greater capacity to induce pseudocontact shifts in NMR experiments, such as Dy3+ or Tm3+, would be a better choice of lanthanide if a CEST effect is to be observed in pure water with this ligand. An alternative strategy may be to redesign the ligand with different substituents α- to the hydroxyl groups that are able to slow the rate of exchange of the hydroxyl protons.
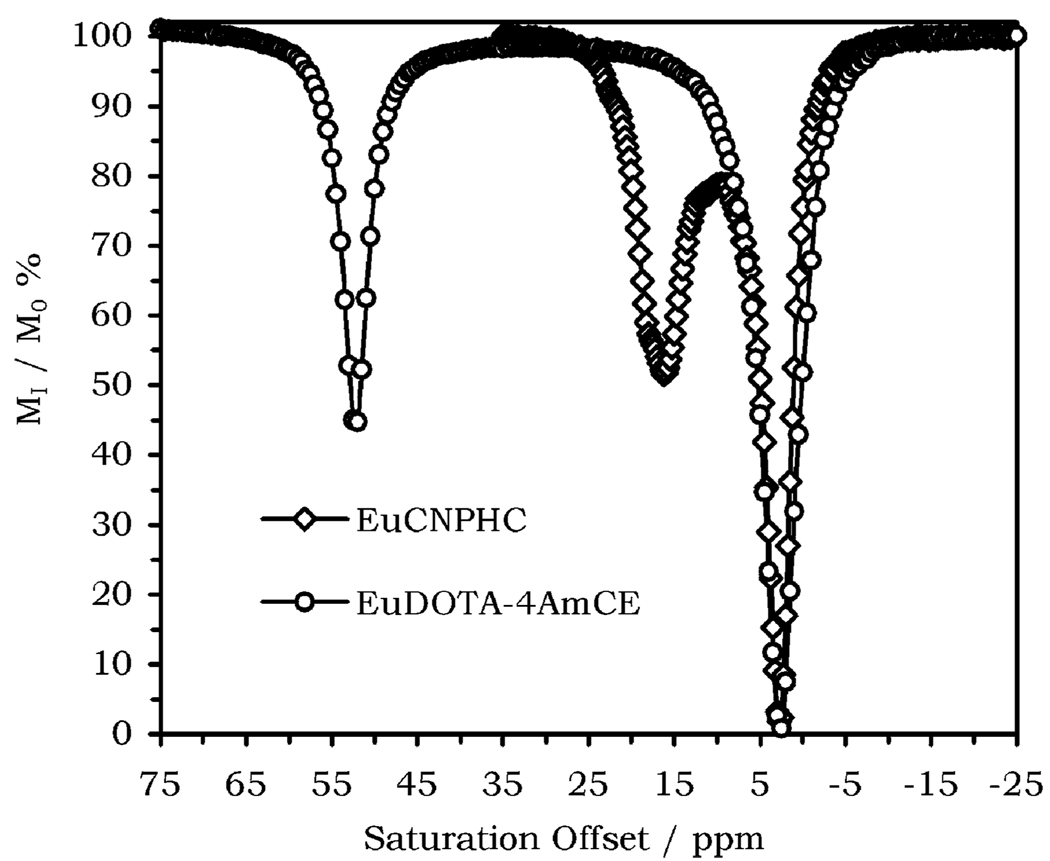
Finally, the question of whether the increase in N achieved by employing alcohol pendant arms would lead to an increase in the CEST effect must be addressed. This may be assessed by comparing the CEST spectra of EuCNPHC3+ with the spectra of a reference tetraamide complex, in this case EuDOTA–4AmCE3+, acquired under identical conditions (Figure 6). Weakly shifted protons must be ignored since they cannot be usefully employed in an imaging setting. Thus, in the case of EuCNPHC3+ N = 3, Δω = 3510 Hz, and τM = 344 µs, whereas for EuDOTA–4AmCE3+, only the coordinated water protons are considered and N = 2, Δω = 13500 Hz, and τM = 507 µs under these conditions. Clearly, the magnitude of the CEST effect is comparable for each complex, even though there is some difference in the shape of the two CEST peaks. Thus, increasing N in this case was not as beneficial as expected, largely because there are small differences in chemical shift among the three –OH resonances and Δω is small relative to τM, highlighting the need for an increase in chemical shift difference by a different choice of lanthanide ion.
Figure 6.
CEST spectra of EuCNPHC3+ (open diamonds) and EuDOTA-4AmCE3+ (open circles) acquired under identical conditions: B0 = 270 MHz, B1 = 86 Hz, [H2O]/[EuL] = 29.25, T = 296 K, irr. time = 2 s.
Experimental Section
The complexes EuS-THP(CF3SO3)3 and EuCNPHC(CF3SO3)3 were prepared according to previously described procedures.10,12 1H NMR experiments were performed on a JEOL Delta 270 spectrometer operating at 270.17 MHz. NMR samples were prepared from a thoroughly dried sample of EuCNPHC3+ and anhydrous deuterioacetonitrile (Aldrich). Pure, unbuffered water was added between each experiment, and all experiments were conducted under mildly acidic conditions as a result of the inherent acidity of the complex.12 The concentration of the bulk water in the initial sample was determined from the 1D 1H NMR spectrum using the line-fitting routine in NUTS.26
Luminescence experiments were performed on a Perkin-Elmer LS-50B fluorimeter. A dry sample of EuCNPHC3+ was prepared by freeze-drying the samples for 7 days. The dried sample was transferred to a glovebox and dissolved in dry acetonitrile (Aldrich) to make a 8.25 mM solution of the complex. The anhydrous solution was transferred to a sealed quartz cuvette equipped with a septum. Luminescence lifetimes were measured by exciting at 397 nm and monitoring at 594 nm. The lifetimes obtained by addition of H2O were fitted to eq 5 to obtain a binding constant of water to EuCNPHC3+. For the fitting procedure it is assumed that the sample prepared under anhydrous conditions is completely unhydrated and that the lifetime recorded for this sample (0.283 ms) represents that of the q = 0 complex. The value of q was determined from eq 1 for samples with H2O/EuL > 200, and found to lie close to one. The lifetimes recorded for these samples (0.234 ms) were therefore taken to indicate the lifetime of a sample in which q = 1,
| (5) |
where τ* is the observed luminescence lifetime, τ1 is the luminescence lifetime of hydrated complex (0.234 ms), and τ0 is the luminescence lifetime of the unhydrated complex (0.283 ms). Although the observed decrease in luminescence lifetime is comparatively small, which increases the uncertainty in the water binding measurement, the value of K obtained by this method proved extremely reproducible.
Supplementary Material
Supporting Information Available: Emission spectra of EuCNPHC3+ recorded with increasing water concentrations; longitudinal relaxation rates of the six proton pools of EuCNPHC3+ with increasing water concentrations; equations used to fit the CEST spectra of EuCNPHC3+. This material is available free of charge via the Internet at http://pubs.acs.org.
Acknowledgment
We thank the National Institutes of Health (EB-04285, M.W.) and (CA-115531 and RR-02584, A.D.S.) (EB-04609, J.R.M.) and the Robert A. Welch Foundation (AT-584) for financial support of this work.
References
- 1.Caravan P, Ellison JJ, McMurry TJ, Lauffer RB. Chem. ReV. 1999;99:2293. doi: 10.1021/cr980440x. [DOI] [PubMed] [Google Scholar]
- 2.Watson AD. J. Alloys Compd. 1994;207–208:14. [Google Scholar]
- 3.Ward KM, Aletras AH, Balaban RS. J. Magn. Reson. 2000;143:79. doi: 10.1006/jmre.1999.1956. [DOI] [PubMed] [Google Scholar]
- 4.Woods M, Zhang S, Kovacs Z, Sherry AD. Adv. Supramol. Chem. 2003;9:1. [Google Scholar]
- 5.Powell DH, Dhubhghaill OMN, Pubanz D, Helm L, Lebedev YS, Schlaepfer W, Merbach AE. J. Am. Chem. Soc. 1996;118:9333. [Google Scholar]
- 6.Aime S, Barge A, Botta M, De Sousa AS, Parker D. Angew. Chem., Int. Ed. 1998;37:2673. doi: 10.1002/(SICI)1521-3773(19981016)37:19<2673::AID-ANIE2673>3.0.CO;2-#. [DOI] [PubMed] [Google Scholar]
- 7.Aime S, Barge A, Bruce JI, Botta M, Howard JAK, Moloney JM, Parker D, de Sousa AS, Woods M. J. Am. Chem. Soc. 1999;121:5762. [Google Scholar]
- 8.Zhang S, Wu K, Biewer MC, Sherry AD. Inorg. Chem. 2001;40:4284. doi: 10.1021/ic0003877. [DOI] [PubMed] [Google Scholar]
- 9.Zhang S, Winter P, Wu K, Sherry AD. J. Am. Chem. Soc. 2001;123:1517. doi: 10.1021/ja005820q. [DOI] [PubMed] [Google Scholar]
- 10.Chin KOA, Morrow JR, Lake CH, Churchill MR. Inorg. Chem. 1994;33:656. [Google Scholar]
- 11.Chin KOA, Morrow JR. Inorg. Chem. 1994;33:5036. [Google Scholar]
- 12.Chappell LL, Voss DA, Jr, Horrocks WD, Jr, Morrow JR. Inorg. Chem. 1998;37:3989. doi: 10.1021/ic980191v. [DOI] [PubMed] [Google Scholar]
- 13.Hoeft S, Roth K. Chem. Ber. 1993;126:869. [Google Scholar]
- 14.Marques MPM, Geraldes CFGC, Sherry AD, Merbach AE, Powell H, Pubanz D, Aime S, Botta M. J. Alloys Compd. 1995;225:303. [Google Scholar]
- 15.Mironov VS, Galyametdinov YG, Ceulemans A, Gorller-Walrand C, Binnemans K. J. Chem. Phys. 2002;116:4673. [Google Scholar]
- 16.Lelli M, Pintacuda G, Cuzzola A, DBL Chirality. 2005;17:201. doi: 10.1002/chir.20151. [DOI] [PubMed] [Google Scholar]
- 17.Dickins RS, Aime S, Batsanov AS, Beeby A, Botta M, Bruce JI, Howard JAK, Love CS, Parker D, Peacock RD, Puschmann H. J. Am. Chem. Soc. 2002;124:12697. doi: 10.1021/ja020836x. [DOI] [PubMed] [Google Scholar]
- 18.Dickins RS, Parker D, Bruce JI, Tozer DJ. Dalton Trans. 2003:1264. [Google Scholar]
- 19.Horrocks WD, Jr, Sudnick DR. J. Am. Chem. Soc. 1979;101:334. [Google Scholar]
- 20.Horrocks WD, Jr, Sudnick DR. Acc. Chem. Res. 1981;14:384. [Google Scholar]
- 21.Beeby A, Clarkson IM, Dickins RS, Faulkner S, Parker D, Royle L, de Sousa AS, Williams JAG, Woods M. J. Chem. Soc., Perkin Trans. 1999;2:493. [Google Scholar]
- 22.Woessner DE, Zhang S, Merritt ME, Sherry AD. Magn. Reson. Med. 2005;53:790. doi: 10.1002/mrm.20408. [DOI] [PubMed] [Google Scholar]
- 23.Bloch F. Phys. Rev. 1946;70:460. [Google Scholar]
- 24.Bleaney B. J. Magn. Reson. 1972;8:91. [Google Scholar]
- 25.Bleaney B, Dobson CM, Levine BA, Martin RB, Williams RJP, Xavirer AV. J. Chem. Soc., Chem. Commun. 1972:791. [Google Scholar]
- 26.Acorn NMR. NMR Utility Transform Software; 2001. [Google Scholar]
Associated Data
This section collects any data citations, data availability statements, or supplementary materials included in this article.
Supplementary Materials
Supporting Information Available: Emission spectra of EuCNPHC3+ recorded with increasing water concentrations; longitudinal relaxation rates of the six proton pools of EuCNPHC3+ with increasing water concentrations; equations used to fit the CEST spectra of EuCNPHC3+. This material is available free of charge via the Internet at http://pubs.acs.org.


