

Abstract
Objective
It has been generally believed that adipocytes are derived from mesenchymal stem cells via fibroblasts. We recently reported that fibroblasts/myofibroblasts in a number of tissues and organs are derived from hematopoietic stem cells (HSCs).
Methods
In the present study, we tested the hypothesis that HSCs also give rise to adipocytes using transplantation of single EGFP+ HSCs and primary culture.
Results
Adipose tissues from clonally engrafted mice showed EGFP+ adipocytes that stained positive for leptin, perilipin and fatty acid binding protein 4. A diet containing rosiglitazone, a peroxisome proliferator-activated receptor-gamma agonist, significantly enhanced the number of the EGFP+ adipocytes. When EGFP+ bone marrow cells from clonally engrafted mice were cultured under adipogenic conditions, all of the cultured cells stained positive with oil red O and sudan black B and exhibited the presence of abundant mRNA for adipocyte markers. Finally, clonal culture and sorting based studies of Mac-1 expression of hematopoietic progenitors suggested that adipocytes are derived from HSCs via progenitors for monocytes/macrophages.
Conclusion
Together, these studies not only clarify the current controversy regarding the ability of HSCs to give rise to adipocytes, but do so based on the analysis of single hematopoietic stem cells in vivo and in vitro. Furthermore, our primary culture method that generates adipocytes from uncommitted hematopoietic cells should contribute to the studies of the mechanisms of early adipocytic differentiation and may lead to development of therapeutic solutions for many general obesity issues.
Keywords: Adipocytes, Hematopoietic Stem Cells, Differentiation, Transplantation, Cell Culture
Introduction
Adipose tissues, scattered throughout many organs, play a critical role in energy balance. When excess calories are available, the adipose tissues grow larger via increase in both the size and number of adipocytes. Since mature adipocytes cannot divide, hyperplasia is achieved by recruitment of preadipocytes and differentiation of uncommitted precursors into the adipocytic lineage. It has been generally believed that preadipocytes are derived from mesenchymal stem cells (MSCs) in the bone marrow (BM) [1,2]. Regarding the pathway of adipocytic differentiation from MSCs, much evidence has suggested that fibroblasts or “fibroblastic” cells are the intermediate between MSCs and preadipocytes (See reviews [3,4]). For example, as early as 1963, a detailed electron microscopic study described the differentiation of fibroblasts to adipocytes [5]. Two-way conversion between human adipocytes and fibroblasts was documented in culture [6] and circulating fibrocytes, precursors for fibroblasts, were shown also to be adipocyte progenitors [7]. These findings strongly suggested that adipocytes are closely related to, if not derived from, fibroblasts.
In our laboratory, transplantation of clones of cells derived from a single hematopoietic stem cell (HSC), demonstrated an HSC origin of the fibroblasts/myofibroblasts in a number of organs and tissues including glomerular mesangial cells, brain microglial cells, pericytes, tumor-associated fibroblasts/myofibroblasts, fibroblasts in cardiac valves and inner ear fibrocytes (summarized in our recent review [8]). Recently, myofibroblasts seen after myocardial infarction [9] and liver stellate cells [10] also were shown to be of HSC origin based on clonal HSC transplantation approaches. In addition to these in vivo studies, we documented that HSCs can give rise to colony forming units-fibroblasts (CFU-F) by primary culture of donor-origin BM cells from clonally engrafted mice [11]. CFU-F are generally thought to be the precursors for mesenchymal cells [1,2]. Therefore, these observations raised the possibility that HSCs may also give rise to adipocytes. Pertinent to this premise are apparently conflicting results from two transplantation studies using BM cells from transgenic GFP mice as the source of donor cells. First, Crossno et al. [12] reported that transplanted BM cells generate new adipocytes and that both a high fat diet and administration of a peroxisome proliferator-activated receptor-γ (PPAR-γ) agonist induce hyperplasia of GFP+ adipocytes. Subsequently, Koh et al. [13] refuted this observation and concluded that what appeared to be adipocytes in the adipose tissues were macrophages. Since both investigators transplanted un-manipulated BM cells, neither study could discern whether aipocytes were derived from MSCs or HSCs. In this communication, we extend the studies by Crossno et al. [12] and show that adipocytes are derived from HSCs based on single HSC transplantation and primary culture studies. Studies of adipocytic differentiation from HSCs based on single progenitor analyses further indicate that adipocytic differentiation is closely related to the monocyte/macrophage lineage.
Materials and methods
Mice
Breeding pairs of C57BL/6-Ly5.1 mice were purchased from Jackson Laboratories (Bar Harbor, ME). Breeding pairs of transgenic EGFP mice (C57BL/6-Ly5.2 background) [14] were kindly provided by Dr. Okabe (Osaka University, Japan). Mice were bred and maintained at the Animal Research Facility of the Veterans Affairs Medical Center. Mice were fed ad libitum with a standard (6.0% fat) diet (2018SX Teklad Global Rodent Diet, Harlan Teklad, Madison, WI) or a test diet containing 0.015% rosiglitazone (Avandia, GlaxoSmithKline, Research Triangle Park, NC). The test diet (5.7% fat Mod TestDietB 570B was prepared by Land O'Lakes Purina Feed, LLC, TestDiet Division (Mod TestDiet® 570B; Richmond, IN) and fed for one to two months. All aspects of animal research have been conducted in accordance with guidelines set by the PHS Policy on Humane Care and Use of Laboratory Animals and the Institutional Animal Care and Use Committee of the Department of Veterans Affairs Medical Center.
Reagents
Phycoerythrin (PE)-conjugated D7 (anti-Ly-6A/E [anti-Sca-1]; rat IgG2a), allophycocyanin (APC)-conjugated 2B8 (anti-CD117 [anti-c-kit]; rat IgG2b), FITC-conjugated or biotinylated RAM34 (anti-CD34; rat IgG2a), PE-conjugated or biotinylated RB6-8C5 (anti-Ly-6G and Ly-6C [anti-Gr-1]; rat IgG2b), PE-conjugated or biotinylated RA3-6B2 (anti-CD45R/B220; rat IgG2a), PE-conjugated 30-H12 (anti-CD90.2 [anti-Thy-1.2]; rat IgG2b), biotinylated TER-119 (anti-Ly-76 [anti-TER-119]; rat IgG2b), biotinylated GK1.5 (anti-L3T4 [anti-CD4]; rat IgG2b), biotinylated 53-6.7 (anti-Ly-2 [anti-CD8a]; rat IgG2a) and PE-conjugated A20 (anti-CD45.1; mouse IgG2a) were purchased from Pharmingen (San Diego, CA). PE-conjugated M1/70.15 (anti-Mac-1; rat IgG2b) were purchased from Caltag Laboratories (Burlingame, CA). Antibodies against adipocyte-specific proteins were purchased from the following vendors: leptin, Sigma-Aldrich (St. Louis, MO); perilipin A, Abcam (Cambridge, MA); fatty acid binding protein-4 (FABP-4/AP2; R&D Systems, Minneapolis, MN). Secondary antibodies were purchased from Jackson ImmunoResearch (West Grove, PA). Alexa Fluor® 647 conjugated anti-GFP antibodies were purchased from Molecular Probes (Eugene, OR). Recombinant mouse stem cell factor (SCF), recombinant mouse macrophage colony-stimulating factor (M-CSF), recombinant mouse thrombopoietin (TPO), recombinant human granulocyte colony-stimulating factor (G-CSF) and recombinant human erythropoietin (EPO) were purchased from R&D Systems (Minneapolis, MN). Recombinant mouse interleukin (IL)-3 was supplied from Kirin Brewery (Tokyo, Japan).
Transplantation
Ten to fourteen-week-old male or female EGFP mice were used as donors. Clonal cell transplantation was carried out using previously described methods with minor modifications [11]. BM mononuclear cells (MNCs) from femurs and tibiae of EGFP mice were isolated by density gradient centrifugation using Lympholyte M (Cedarlane Laboratories Limited, Ontario, Canada). Lineage antigen-negative (Lin-) cells were prepared by MACS separating system (Miltenyi Biotec, Auburn, CA) using negative selection with biotinylated anti-Gr-1, anti-CD45R/B220, anti-CD4, anti-CD8a, anti-TER119 antibodies and anti-biotin microbeads. Resulting Lin- cells were stained with PE-conjugated anti-Sca-1, APC-conjugated anti-c-kit and biotinylated anti-CD34 followed by streptavidin-conjugated APC-Cy7 (Pharmingen). Lin- cells were then stained with Hoechst 33342 (Sigma-Aldrich) as described [11,15]. Stained cells were washed twice after addition of propidium iodide (1 μg/mL), resuspended in Ca2+-, Mg2+-free PBS with BSA (Sigma-Aldrich), and kept on ice until sorting. Cell sorting was performed using a MoFlo (DakoCytomation, Fort Collins, CO) with appropriate isotype-matched controls. The gates used for side population (SP) cells corresponded to R3 and R4 fractions of Goodell et al. [16] and R1 and R2 populations of Matsuzaki et al. [15]. Using the CyCLONE system of MoFlo, single Lin- Sca-1+ CD34- SP cells were or single Lin- Sca-1+ c-kit+ CD34- cells deposited individually into round-bottomed 96-well culture plates (Corning, Corning, NY).
To effectively generate mice showing high-level multilineage reconstitution by single HSCs, we used the method combining single cell deposition and short-term cell culture described previously [11,17,18]. Single cells were cultured in alpha modified Eagle's medium (αMEM; ICN Biomedicals, Aurora, OH) containing 20% FBS (Atlanta Biologicals, Norcross, GA), 1% deionized fraction V BSA (Sigma-Aldrich), 1 × 10⁻⁴ mol/L 2-mercaptoethanol (2ME; Sigma-Aldrich), 100 ng/mL SCF and 10 ng/mL G-CSF. Plates were incubated at 37°C in a humidified atmosphere with 5% CO2 in air. At 18 hours after single cell deposition, the wells containing single cells were identified and the incubation was continued for a total of 7 days. Because HSCs in steady state BM are dormant in cell cycle, selection and transplantation of small clones consisting of 20 or fewer cells raised the efficiency of generating mice reconstituted with single HSCs [11,17,18].
Ten to fourteen-week-old male or female C57BL/6-Ly5.1 mice were used as irradiated recipients and as the source of radio-protective cells. Recipient C57BL/6-Ly5.1 mice were given a single 950-cGy dose of total-body irradiation using a 4 × 10⁶ V linear accelerator and clones containing 20 or fewer cells derived from single cells were injected via tail vein into irradiated mice together with 500 Lin- Sca-1+ c-kit+ CD34+ BM cells from C57BL/6-Ly5.1 mice as radio-protective cells [19]. To exclude the possibility that the adipocytic differentiation we observed was an artifact of pre-transplantation culture, we also generated control mice transplanted with 100 non-cultured Lin- Sca-1+ c-kit+ CD34- BM cells from EGFP mice.
For analysis of hematopoietic engraftment, peripheral blood (PB) was obtained from the retro-orbital plexus of the recipient mice at 7 to 10 months after transplantation. Red blood cells were lysed with PharM Lyse (Pharmingen). Donor-derived (EGFP+) cells in T cell, B cell, granulocyte and monocyte/macrophage lineages were analyzed by staining with PE-conjugated anti-Thy-1.2, anti-CD45R/B220 and a combination of anti-Gr-1 and anti-Mac-1, respectively. Recipient cells were detected by staining with PE-conjugated anti-CD45.1. We performed the analysis of engraftment using a FACSCalibur (Becton Dickinson, San Jose, CA).
Immunolabeling and microscopy of tissue sections
Peritoneal, omental and peri-nephric adipose tissues from engrafted mice fed with a normal diet or a rosiglitazone-impregnated diet were processed for paraffin sectioning as described [18]. Importantly, we have adapted protocols described by others allowing for preservation of EGFP fluorescence intensity during paraffin tissue processing [14,20]. Briefly, for immunolabeling, sections were permeabilized in 0.01% Triton X-100/PBS (15 minutes), blocked in 3% BSA/5% normal donkey serum/PBS (2 hours), and incubated with appropriate primary antibodies diluted first with 3% BSA/5% normal donkey serum/PBS (30 minutes) and then with PBS alone (2 hours at room temperature in a humid chamber). Sections were then rinsed in PBS (3× 5 minutes) and incubated for 30 min with fluorochrome-conjugated secondary antibodies diluted in PBS. The sections were washed again in PBS (3× 5 minutes) and incubated with Hoechst 33342 nuclear dye (diluted 1:20,000 in PBS) for 15 minutes in a humid chamber at room temperature. Sections were then rinsed in PBS (3× 10 minutes) and coverslipped. Staining was visualized using epifluorescence and differential interference contrast (DIC) imaging with a Leica DMR microscope and a narrow band-pass GFP excitation cube. Images were processed using Adobe Photoshop 7.0 software (Adobe Systems, Inc., San Jose, CA).
Adipogenesis of donor-derived BM cells in vitro
BM MNCs from highly engrafted mice at 7 to 10 months after transplantation were suspended at a concentration of 2 × 10⁶ cells/mL in media consisting of DMEM (Invitrogen, Gaithersburg, MD), 10% FBS and 10% mouse serum (MS; Atlanta Biologicals) and incubated in 25-cm2 cell culture flasks (Corning) for 2 hours at 37°C in a humidified atmosphere with 5% CO2 in air. Adherent cells were discarded and non-adherent cells were stained with PE-conjugated anti-CD45.1. Donor-derived cells, sorted as EGFP+ CD45.1- cells, were re-suspended at a concentration of 1.5 × 10⁵ to 2.5 × 10⁵ cells/mL in 25-cm2 cell culture flasks and incubated at 37°C in a humidified atmosphere with 5% CO2 in air in a media containing DMEM, 10% FBS, 10% MS and 100 ng/mL M-CSF. M-CSF was included in the media because of its known adipogenic effects [21,22]. Freshly prepared media in 2 mL aliquots were added to the flasks 7 days later. At 80% confluency, cultured cells were treated with 4 mL of HBSS containing 0.25% trypsin-1 mM EDTA, harvested and replated in the same media. For histological analysis, cells were replated at a concentration of 2.0 × 10⁴ cells/well in fibronectin-coated 4-well culture slides (Becton-Dickinson Biosciences, San Jose, CA). For molecular analysis, cultured cells were replated at a concentration of 2.5 × 10⁵ cells/mL in 25-cm2 cell culture flasks. For induction of adipogenesis, we used an adipogenesis assay kit from Chemicon (Temecula, CA). Briefly, 2 days after replating, we replaced the media with adipogenesis initiation media consisting of DMEM, 10% FBS, 10% MS, 100 ng/mL M-CSF, 0.5 mM isobutylmethylxanthine and 1 μM dexamethasone. After incubation for two more days, the media was replaced with adipogenesis progression media consisting of DMEM, 10% FBS, 10% MS, 100 ng/mL M-CSF and10 μg/mL insulin. Two days later, adipogenesis progression media was replaced with the original media consisting of DMEM, 10% FBS, 10% MS and 100 ng/mL M-CSF and incubation continued for at least 5 more days. Cells cultured on fibronectin-coated 4-well culture slides were fixed with 4% paraformaldehyde and stained with oil red O followed by Alexa Fluor® 647 conjugated anti-GFP antibodies or sudan black B (ENG Scientific, Inc., Clifton, NJ). Histological analysis was performed as described above. For analysis of nuclear DNA content, the cultured adipocytes were dissociated with HBSS/0.25% trypsin/1mM EDTA and washed with PBS containing 0.1% BSA. The cells were then fixed in 70% ethanol and stained with Propidium Iodide (PI)/RNase staining solution (Pharmingen). Flow cytometry was conducted on a FACSCalibur using CellQuest. Controls consisted of B16 melanoma cells (polyploid) and peripheral blood MNCs.
RT-PCR
Total RNA was extracted from the cultured adipocytes and NIH-3T3 control fibroblasts using Trizol reagent (Invitrogen) according to the manufacturer's instructions. Two micrograms of total RNA was reverse transcribed using Superscript III single strand synthesis RT system (Invitrogen). Aliquots from this reaction were used for real-time PCR assays using the indicated gene-specific primers (Table S1) and Super Script platinum SYBER green mix (Invitrogen). PCR were done using the LightCycler (Roche, Basel, Switzerland). The basic PCR reaction conditions were: 94°C for 2 minutes then 39 cycles of 95° C for 10 seconds, 57°C for 20 seconds, 72° C for 40 seconds. Hypoxanthine phosphoribosyl transferase served as the normalization control. Relative expression analysis was conducted using the program LinRegPCR according to the suggested specifications [23].
Adipogenesis and hematopoiesis from single hematopoietic progenitors
Lin- BM MNCs from normal, non-transplanted C57BL/6-Ly5.1 mice were stained with FITC-conjugated anti-CD34, PE-conjugated anti-Sca-1 and APC-conjugated anti-c-kit, followed by Hoechst 33342. Using the MoFlo, single Lin- Sca-1+ c-kit+ CD34- SP cells were deposited individually into round-bottomed 96-well culture plates containing αMEM, 20% FBS, 1% deionized fraction V BSA, 1 × 10⁻⁴ mol/L 2ME, 100 ng/mL SCF, 100 ng/mL G-CSF, 4 U/mL EPO, 100 ng/mL TPO and 100 ng/mL IL-3. We identified the wells containing single cells 18 hours later and incubated plates at 37°C in a humidified atmosphere with 5% CO2 in air for a total of 7 days. Resulting clones were individually divided into two aliquots and cultured under two different conditions: One aliquot was cultured in 12-well non-tissue culture plates (Becton-Dickinson Biosciences) containing αMEM, FBS, BSA, 2-ME, SCF, G-CSF, EPO, TPO and IL-3 for hematopoietic growth and differentiation and the other in 12-well tissue culture plates (Becton-Dickinson Biosciences) containing DMEM, FBS, MS and M-CSF for study of fibroblast growth. The aliquots cultured for hematopoietic growth for 10 to 12 days were individually deposited onto slides using a cytocentrifuge (Cytospin, Shandon Southern, Elliott, IL) and stained with May-Grünwald Giemsa. When the aliquots cultured for fibroblasts reached 80% confluency, they were individually processed for adipogenesis as described above.
Adipogenesis from Mac-1-, Mac-1low or Mac-1high population
BM MNCs from normal C57BL/6-Ly5.1 mice were stained with PE-conjugated anti-Mac-1 and sorted into Mac-1-, Mac-1low or Mac-1high cell population by using MoFlo. Because the ratio of the Mac-1- cell population to Mac-1low cell population and to Mac-1high cell population was approximately 3:1:5, 3 × 10⁵ Mac-1- cells, 1 × 10⁵ Mac-1low cells or 5 × 10⁵ Mac-1high cells were plated in 25-cm2 cell culture flasks containing DMEM, 10% FBS, 10% MS and 100 ng/mL M-CSF. Incubation was carried out at 37°C in a humidified atmosphere with 5% CO2 in air. Seven days later, freshly prepared media in 2 mL aliquots were added to the flasks and, after additional 5 days, the cells in each flask were harvested with 4 mL 0.25% trypsin-1 mM EDTA and counted. Mac-1- and Mac-1low cell populations were replated in fibronectin-coated 4-well culture slides at a concentration of 2.0 × 10⁴ cells/well. All Mac-1high cells were re-plated because fewer than 2 × 10⁴ cells were present. Adipogenesis was induced as described above and stained with oil red O.
Statistical considerations
The percentage of EGFP+ cells in peritoneal fat pads from a mouse treated with rosiglitazone for one month versus a non-treated mouse was determined on sections processed for EGFP expression and nuclear staining (Hoechst, HO) as described above. Five regions from a paraffin section were chosen at random and five non-overlapping fields (200×) were then selected at random from each region for analysis. A total of 50 fields derived from two non-sequential sections were analyzed for each mouse. In each field, the total number of HO+ cells and the total number of EGFP+HO+ cells were counted. The average number of HO+ and EGFP+HO+ cells was then calculated for each mouse and expressed as the percentage of EGFP+ cells ± standard deviation.
Results
High-level multilineage hematopoietic engraftment by clones derived from single EGFP+ HSCs
To study the tissue-reconstituting ability of HSCs, it was necessary to generate mice with high-level multilineage hematopoietic engraftment from single HSCs. As described in “Materials and Methods”, single Lin- Sca-1+ CD34- SP cells or single Lin- Sca-1+ c-kit+ CD34- cells were individually cultured for 7 days in media containing SCF and G-CSF and clones consisting of 20 or fewer cells were transplanted into lethally irradiated recipients with 500 radio-protective cells. Seven to ten months after transplantation, we analyzed PB for hematopoietic engraftment. As with our earlier studies of fibroblasts/myofibroblasts [11,17,18,24,25], only mice exhibiting high-level (> 70%) multilineage hematopoietic engraftment by donor-derived EGFP+ cells were selected for study. Flow cytometric analysis of PB cells from a representative recipient mouse is shown in Figure 1.
Figure 1. Multilineage engraftment from a clone derived from a single EGFP+ HSC.
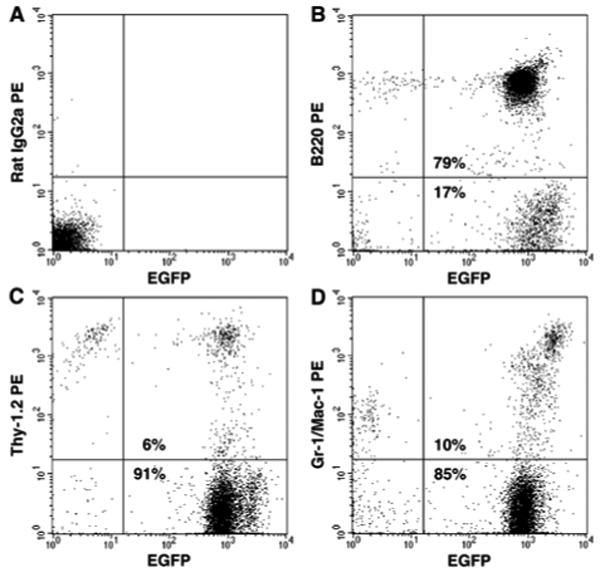
Shown here is a representative flow cytometric analysis of PB nucleated cells from a mouse 7 months after transplantation of a clone derived from a single EGFP+ HSC. EGFP+ cells represented 96% of total nucleated cells and 79%, 6% and 10% of cells in the B cell (B), T cell (C) and granulocyte/macrophage (D) lineages, respectively. (A) Isotype control showing PB cells from a recipient C57BL/6-Ly5.1 mouse.
HSCs give rise to adipocytes in vivo
Mice demonstrating high-level multilineage hematopoietic engraftment from a clonal population of EGFP+ HSCs were perfused and peritoneal, omental and peri-nephric adipose tissues were excised and processed for paraffin sections. Analysis of thin (5 μm) paraffin sections revealed the presence of many EGFP+ cells in each of these sites (Figure S1). To examine the morphology of individual HSC-derived EGFP+ cells within the adipose tissues, high magnification epi-fluorescence and DIC microscopy were used (Figure 2). EGFP+ cells (Figure 2A) were found to have morphology consistent with that described for adipocytes (Figure 2B). Comparison of the morphology of HSC-derived adipocytes from clonally engrafted mice to that of non-transplanted transgenic EGFP mice (Figure 2M, N) showed that, in paraffin sections of adipose tissue from each mouse, the EGFP+ cytoplasm is displaced to the periphery of cells by the space that was once occupied by fat globules. Sections were then stained using antibodies to leptin, a hormone produced by adipocytes, to confirm adipocyte identity and to demonstrate that the EGFP+ adipocytes within the adipose tissue were functional (Figure 2D). The EGFP expressing cells (Figure 2E, arrows and F) were identical in leptin expression to their neighboring EGFP negative adipocytes (Figure 2E, arrowheads and F).
Figure 2. HSC derived adipocytes in vivo.
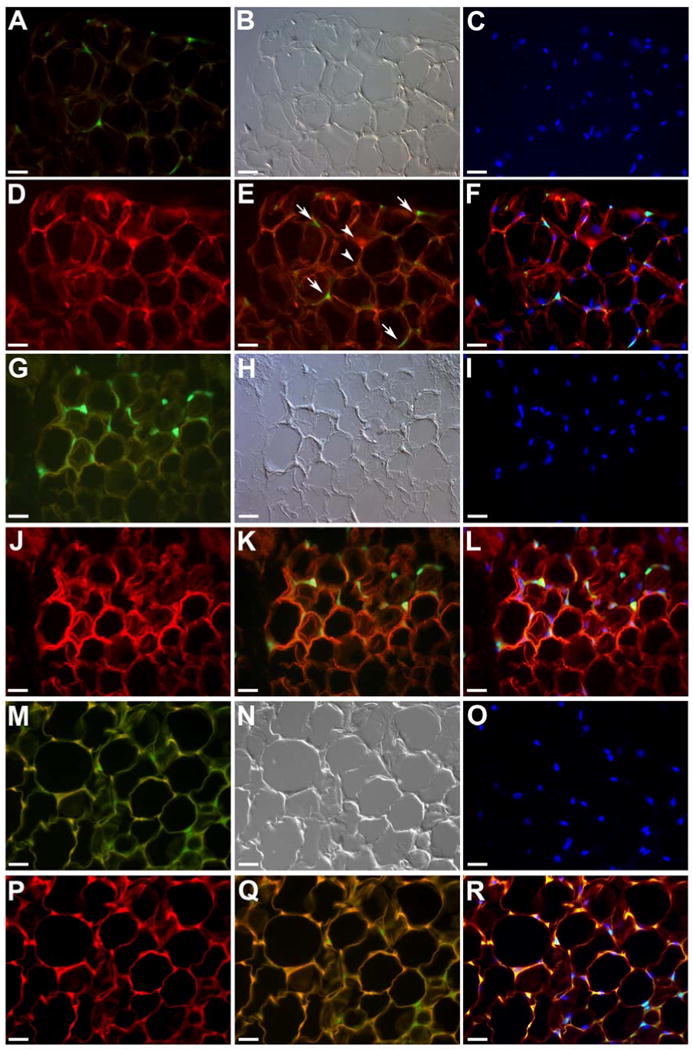
Peritoneal, omental and peri-nephric fat pads from mice transplanted with a clonal population of cells derived from a single EGFP+ HSC were sectioned (5 μm) and examined using high magnification epifluorescent and DIC microscopy. Shown are representative sections from the peritoneal fat pads of a clonally engrafted mouse (A-F), a clonally engrafted mouse treated with rosiglitazone for one month (G-L) and a donor non-transplanted transgenic EGFP mouse (M-R). EGFP+ cells (A) with characteristic morphology of adipocytes (B, DIC image), including a ring of cytoplasm with a flattened nucleus located on the periphery (C, Hoechst nuclear dye, HO), were observed. Sections were then stained using antibodies to leptin (D). For analysis, the green EGFP image (A) was overlaid onto the red image of leptin (D) to demonstrate co-expression of EGFP and leptin (E, arrows). Arrowheads in E show EGFP negative adipocytes. Superimposition of EGFP (A), HO (C) and leptin stain (D) is shown in F. Representative images of the peritoneal fat pad from a rosiglitazone-treated clonally engrafted mouse are shown in Panels G-L. Clusters of EGFP+ adipocytes (G) seen in these sections were shown to express leptin (J), superimposition depicted in Panels K and L. Panels M-R show EGFP expression (M), morphology (N), HO staining (O) and leptin expression (P) of adipocytes from a donor transgenic EGFP mouse. Superimposition of images (Q, R) shows similar morphology and expression pattern to that of transplanted animals. See Figure S1, Panels M-P, for EGFP expression, DIC and negative control for leptin staining, respectively. Scale bar in A-R equals 25 μm.
To promote adipogenesis in vivo, two clonally engrafted mice were fed a diet impregnated with the PPAR-γ agonist rosiglitazone (0.015% rosiglitazone; TestDiet® 570B) ad libitum for up to two months. Adipose tissues were then processed and examined for EGFP+ cells and leptin expression (Figure 2G-L). EGFP+ adipocytes were increased in number and often found in clusters, suggesting clonal growth from the HSC-derived progenitors (Figure 2G, K, L). The morphology and leptin expression pattern (Figure 2H, K, L) in these tissues were similar to that seen in non-treated clonally engrafted mice (Figure 2A-F) and transgenic EGFP mice (Figure 2M-R).
To further characterize the EGFP+ cells as adipocytes, tissues were stained with antibodies to perilipin (Figure 3A-E) and fatty acid binding protein 4 (FABP4 or AP2; Figure 3, G-K), proteins associated with adipocytes. As with leptin staining, superimposition of EGFP epifluorescence and perilipin (Figure 3D,E) or FABP4 (Figure 3J,K) images shows that HSC-derived EGFP+ adipocytes express both perilipin and FABP4. These images also show HSC-derived adipocytes in clusters, again supporting clonal growth from HSC progenitors. A quantitative comparison of the percentage of EGFP+ cells in peritoneal fat pads from a rosiglitazone-treated versus a non-treated mouse showed that there was a significant increase (Student's t-Test, p = 3.86-10) in the percentage of EGFP+ cells in the rosiglitazone-treated (56.45 ± 7.09) as compared to the control (21.78 ± 5.51) mice.
Figure 3. Expression of perilipin and FABP4 by HSC-derived adipocytes.
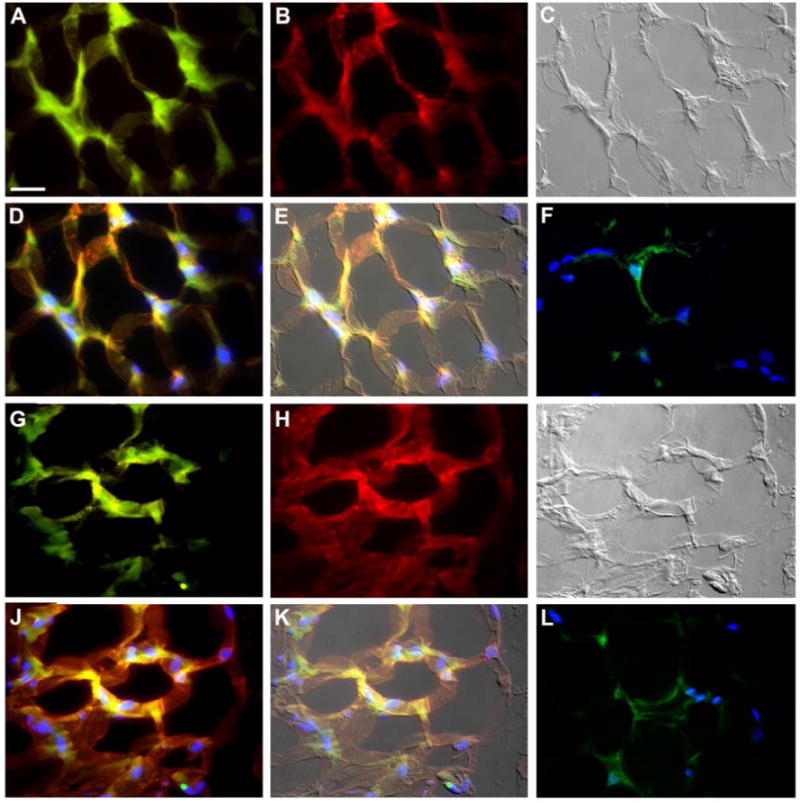
Shown is a section from a peritoneal fat pad of a clonally engrafted mouse treated with rosiglitazone for two months. High magnification imaging showed numerous clustered EGFP+ cells (A) that express perilipin (B) and have the morphology of adipocytes (C, DIC image). Superimposition of EGFP expression (green), perilipin staining (red) and nuclear staining (HO, blue) is shown in Panel D. Panel E shows D overlaid onto the DIC image. Staining of tissue sections with antibodies to FABP4 again shows clustered HSC-derived EGFP+ cells (G) that express FABP4 (H) and have the morphology of adipocytes (I, DIC image). Panels J and K show superimpositions with HO staining (J) as well as DIC overlay (K). Panels F and L show control images of tissue incubated with secondary but not primary antibodies for perilipin (F, red) or FABP4 (L, red) (green shows EGFP expression, blue shows HO staining). Scale bar in A-L equals 25 μm.
Our results suggest a new model that HSCs in the bone marrow generate adipocytes and are in agreement with Crossno's observations. While our data do not support Koh's conclusion, we observed a few EGFP+ macrophages that fit their description. As shown in Figure 4, the edges of these cells are scalloped by neighboring adipocytes and their cytoplasm stained positive for F4/80, a macrophage marker. These cells are filled with EGFP and invariably showed multiple nuclei, suggesting the phagocytic nature of the cells. These cells, however, were completely separate from the many EGFP+ adipocytes that we observed both in terms of morphology and staining for adipocyte-related markers. As depicted in Panel G of Figure 4, some EGFP+ adipocytes also expressed F4/80, which represents their transition from the HSC through monocyte/macrophage to the adipocyte lineage as described in in vitro studies below.
Figure 4. Adipose tissue contains few HSC-derived F4/80+ macrophages.
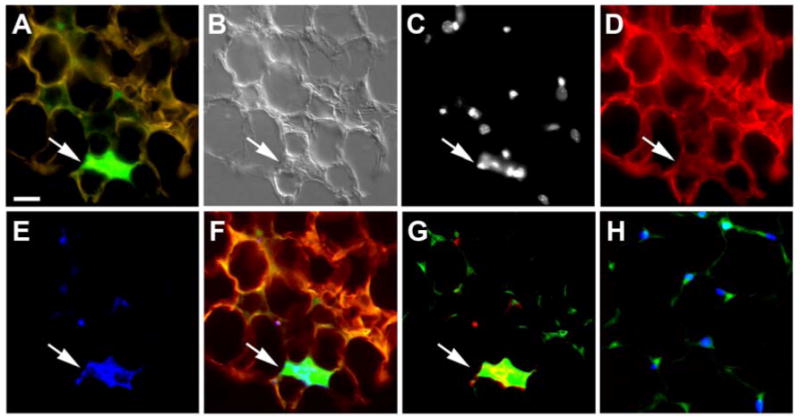
Shown is a representative section from a peritoneal fat pad of a rosiglitazone treated, clonally engrafted mouse. Analysis of multiple sections shows few EGFP+ macrophages; representative macrophage shown by arrow (A, B). Staining with nuclear marker HO (C) and antibodies to leptin (D) and F4/80 (E) and superimposition shown in Panel F showed that these macrophages were large and multinucleated. Panel G depicts another demonstration of colocalization of EGFP and F4/80 in the macrophage (arrow). Here, EGFP (green) is superimposed with F4/80 (red). Panel H shows control image of tissue stained with secondary only antibodies for F4/80 (red) (green shows EGFP expression, blue shows HO staining). Scale bar in A-L equals 25 μm.
HSCs give rise to adipocytes in culture
To further confirm the HSC origin of adipocytes and to characterize adipogenesis from HSCs, we used a slight modification of the primary culture method for growth of fibroblasts from BM cells [26]. We added M-CSF to cultures because of its known adipogenic effects [21,22]. MNCs from the BM of clonally engrafted mice were sorted for EGFP+ cells and adipocytic differentiation was induced under the conditions described in “Materials and Methods”. The resulting cultures were examined for adipogenesis based on cellular morphology and lipid accumulation using DIC microscopy and staining for oil red O or sudan black B. HSC origin was confirmed using an anti-GFP antibody and epifluorescence microscopy. As shown in Figure 5, all cells were EGFP+ and contained globules that were positive for oil red O. All cells were also positive for sudan black B. The cells were spindle-, polygonal- or spherical-shaped, depending on the extent of lipid accumulation. We also transplanted mice with 100 non-cultured EGFP+ Lin- Sca-1+ c-kit+ CD34- cells and examined adipogenesis from EGFP+ BM MNCs. As in the clonally transplanted mice, cultured cells stained positive for oil red O or sudan black B and EGFP, excluding the possibility that the observed adipogenesis was an artifact of pre-transplantation culture (data not shown). These observations provided additional in vitro confirmation that adipocytes are derived from HSCs. We then tested the DNA content of the adipocytes by staining with propidium iodide (PI). The result shown in Figure S2 is in a complete agreement with the result of DNA analysis of the adipocytes that were generated in vivo [12] and excludes cell fusions as the cause for generation of adipocytes from HSCs.
Figure 5. Adipocytes cultured from EGFP+ BM cells of a clonally engrafted mouse.
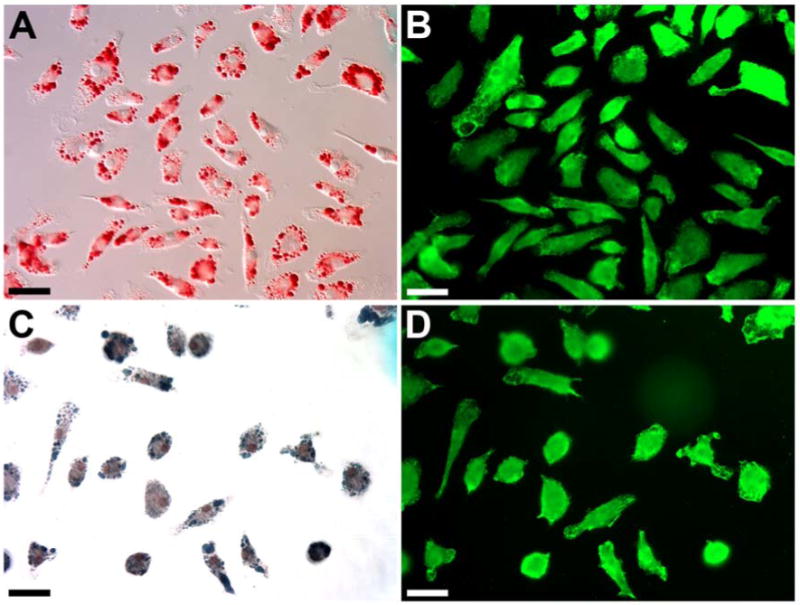
EGFP+ cells were FACS-sorted from BM of a mouse with clonal HSC engraftment and cultured under adipogenic conditions. Cultured cells were stained with oil red O (A) or Sudan black B (C) and an anti-GFP antibody (B and D). Scale bar equals 50 μm.
Molecular identification of HSC-derived adipocytes
Real-time RT-PCR was used to examine the mRNA expression of well-characterized adipocyte markers by the cultured adipocytes that were derived from clonally engrafted mice. As shown in Figure 6, relative to NIH 3T3 fibroblasts, the adipocytes exhibited high-level expression of mRNA for resistin, PPAR-γ, plasminogen activator inhibitor type 1 (PAI1), CCAAT/enhancer binding protein-α (C/EBP-α), fatty acid binding protein 4 (FABP4) and leptin. In contrast, SRY-box containing gene 9 (SOX9), a chondrogenic transcription factor, is reduced in the adipocytes. These findings, together with the results of histological analysis presented above, demonstrate that HSCs give rise to adipocytes.
Figure 6. RT-PCR analysis of the adipocytes derived from GFP+ bone marrow cells of a clonally transplanted mouse.
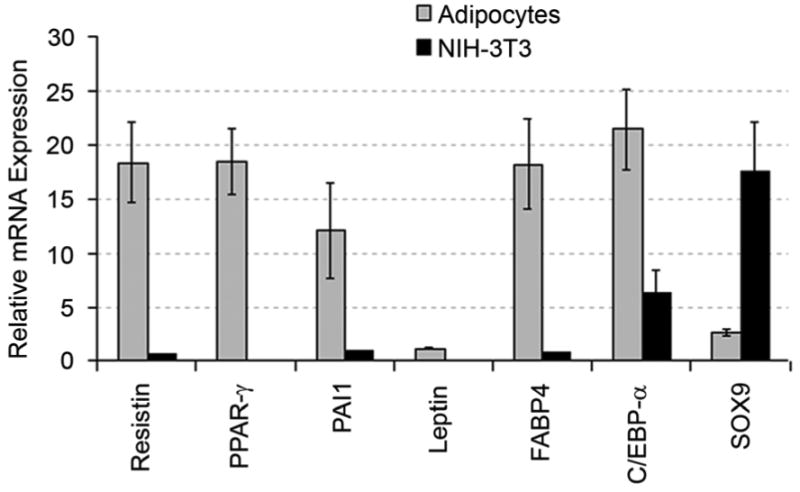
Higher mRNA levels of the adipocyte differentiation-related genes were observed compared to NIH-3T3 fibroblasts used as control (p< 0.05). These findings offer biochemical support for our initial identification of these cells as adipocytes based on morphology and oil red O staining.
Adipogenesis from single hematopoietic progenitors in culture
In the next experiment, we wished to gain insight into the pathway of adipocytic differentiation from HSCs. By combining FACS sorting and single cell deposition, we plated individual Lin- Sca-1+ c-kit+ CD34- SP cells in 96-well round bottom culture plates containing a combination of hematopoietic cytokines. After incubation for one week, individual clones of cells were divided into two aliquots and each aliquot further cultured under hematopoietic or adipogenic conditions. Analysis of hematopoietic and adipocytic lineages in the pairs of aliquots from a total of 81 clones is presented in Table S2 and summarized in Table 1. Representative pictures of blood cells and adipocytes derived from two hematopoietic progenitors (Clone 59 and Clone 75 in Table S2) are shown in Figure 7. The adipocytes stained positive for oil red O. Seven oil red O positive clones were also examined for expression of adipocyte markers by real-time RT-PCR and were found to exhibit higher mRNA levels than those measured in control NIH 3T3 fibroblasts. These included PPAR-γ (7/7), FABP4 (6/7), C/EBP-α (6/7), resistin (5/7), and leptin (4/7) (data not shown).
Table 1. Summary of hematopoiesis and adipogenesis observed from single hematopoietic progenitors.
| Type of clones | Number of clones | Number of clones capable of adipocytic differentiation |
|---|---|---|
| n | 1 | 0 |
| m | 3 | 3 |
| nm | 5 | 5 |
| nE | 3 | 0 |
| nmE | 32 | 30 |
| nmM | 2 | 1 |
| nmEM | 35 | 34 |
Twelve days after single cell deposition and culture, smears were made from individual samples and stained with May-Grünwald Giemsa. Differential counting was carried out on 200 cells. n indicates neutrophil; m, macrophage/monocyte; E, erythrocyte and M, megakaryocyte.
Figure 7. Hematopoiesis and adipogenesis observed from single hematopoietic progenitors.
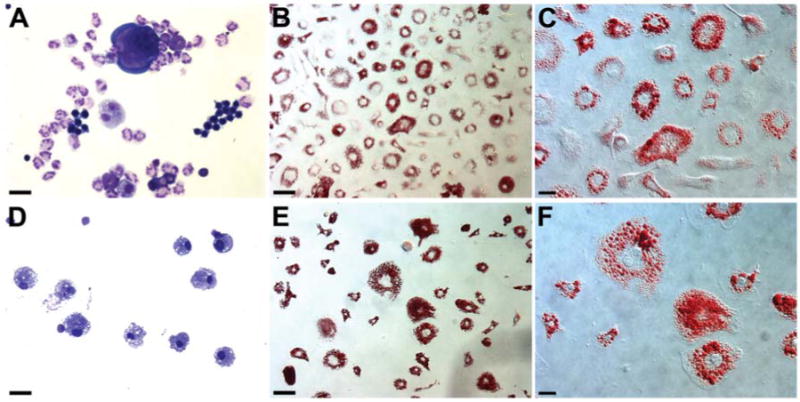
Aliquots of individual clones derived from single Lin- Sca-1+ CD34- SP cells were cultured under hematopoietic and adipogenic conditions and stained with either May-Grünwald Giemsa (A,D) or oil red O (B,C,E,F). Results shown are pictures of a clone generating neutrophil/macrophage/erythrocyte/megakaryocytic cells (A) and adipocytes (B, C) and a clone generating only macrophages (D) and adipocytes (E, F). Scale bar equals 50 μm (A, B, D, E) or 25 μm (C, F).
As summarized in Table 1, almost all multilineage precursors expressing neutrophil/macrophage/erythrocyte/megakaryocyte lineages or neutrophil/macrophage/erythrocyte lineages and all bipotential neutrophil/macrophage precursors generated adipocytes. There were a total of four clones whose differentiation capacities were limited to neutrophil or neutrophil/erythrocyte lineages and these clones did not generate adipocytes. Three clones generated adipocytes and only macrophages in the presence of permissive hematopoietic cytokines. These findings suggest that adipocyte progenitors are, like fibroblasts/myofibroblasts (See review [26]), closely related to the monocyte/macrophage lineage.
Monocyte/macrophage progenitors, not mature macrophages, give rise to adipocytes
To further examine the relationship between adipocytes and the monocyte/macrophage lineage, BM cells of normal mice were separated by sorting into Mac-1-, Mac-1low and Mac-1high cell populations (Figure 8) and tested for their adipogenic potential. While all cells cultured from Mac-1- and Mac-1low cell populations stained positive for oil red O, very few cells from the Mac-1high cell population showed an adipocyte phenotype. The results summarized in Figure 8 show unequivocally that Mac-1high cell population does not contribute to adipocytes and that the major contributors to adipogenesis are Mac-1low and Mac-1- cell populations in a descending order. The proliferative cells in the Mac-1- cell population probably represent un-committed hematopoietic progenitors. These findings, therefore, were interpreted to suggest that adipocytes are derived from the monocyte/macrophage progenitors and not from mature macrophages.
Figure 8. Adipogenesis in culture from BM cells with variable Mac-1 expression.
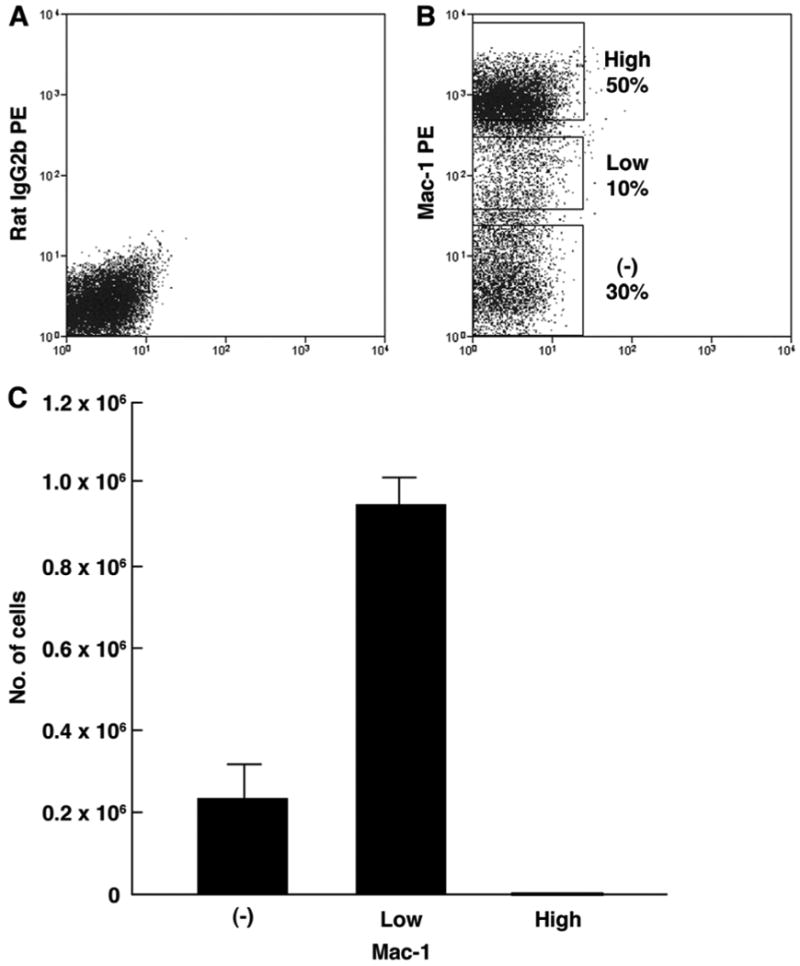
(A) Isotype control for sorting. (B) Sorting gates used for Mac-1-, Mac-1low, Mac-1high cell populations of BM mononuclear cells from normal C57BL/6-Ly5.1 mice. (C) Numbers of adipocytes generated from the Mac-1-, Mac-1low, Mac-1high cell populations.
Discussion
In the present study, we demonstrated that adipocytes are derived from HSCs using transplantation of clones generated from single EGFP+ HSCs. The numbers of EGFP+ adipocytes identifiable in the peritoneal adipose tissues were significantly increased in the mouse fed a diet containing rosiglitazone, a PPAR-γ agonist. These data are particularly important in light of the recent conflicting reports regarding the BM origin of adipocytes. The first report concluded that transplanted un-fractionated BM cells generated new adipocytes and that both a high fat diet and administration of a PPAR-γ agonist induced hyperplasia of GFP+ adipocytes [12]. A year later, Koh et al. [13] refuted this observation and concluded that what appeared to be GFP+ adipocytes were actually macrophages. Our observations based on single HSC transplantation presented in this manuscript support Crossno's conclusion and further extend their studies to identify the bone marrow progenitor of the adipocyte, the HSC.
We also documented the HSC origin of adipocytes using primary culture of EGFP+ BM cells from clonally engrafted mice. Our primary culture of adipocytes was a modification of the culture method developed for PB fibrocytes [27] and BM fibroblasts [11] in which the media was supplemented with M-CSF based upon the known adipogenic effects of M-CSF [21,22]. When induced for adipogenic differentiation, the cultured cells exhibited numerous fat globules in the cytoplasm and stained positive for leptin, perilipin and FABP4. They also expressed high levels of mRNA for several known adipocyte markers. Since few mRNAs are expressed exclusively in the adipocyte, it is necessary to examine the profile of multiple genes that are vital to adipocyte development, differentiation and/or function as a whole, rather than relying on the expression of an individual gene as the hallmark of an adipocyte. Resistin, leptin and PAI1 are adipocyte-secreted factors, termed adipokines, which have been implicated in the function of adipose tissue as an endocrine organ (see review [28]). PPAR-γ, C/EBP-α and FABP4 are transcription factors and proteins shown to play important roles in adipocyte differentiation (see reviews [29,30]).
We then analyzed the adipogenic potential of individual hematopoietic progenitors and found that adipocytes are related to the monocyte/macrophage lineage. Additional studies of BM cells that were fractionated based on Mac-1 expression suggested that adipocytes are only derived from monocyte/macrophage progenitors and not from mature macrophages. Furthermore, most adipocytes were generated from the Mac-1low cells even though this population represented the smallest percentage of the total cells. Therefore, the clonal transplantation and single progenitor studies presented here are in agreement and demonstrate that adipocytes are products of physiological differentiation of HSCs.
Following the discovery of spontaneous cell fusions between embryonic stem cells and bone marrow cells [31] or brain cells [32] in culture, many cases of apparent “plasticity” of HSCs were attributed to the results of cell fusions between donor hematopoietic cells and recipient tissue cells [33-36]. The physiological significance of these findings has not been completely clarified. Studies documenting HSC contributions to satellite cells [37] and skeletal muscle cells [38] indicated that fusion is the physiological mechanism for HSCs to participate in the repair of multinucleated muscle cells. Indeed, documentation of cell fusions has been primarily in organs with known physiological poly-karions such as Purkinje neurons, cardiomyocytes and hepatocytes. In our current study, the possibility of fusions as the mechanism for adipogenesis was excluded by direct demonstration of the diploid nature of all of the adipocytes derived from bone marrow of clonally engrafted mice in culture. This observation agrees with the results of DNA analysis of the adipocytes that were generated in vivo [12] and is consistent with our series of studies of the HSC origin of fibroblasts/myofibroblasts in vivo [17,18,24,25] and fibroblasts grown in vitro [11].
Annual adipocyte turnover in adults has been estimated to be 10% based on analysis of the integration of 14C derived from nuclear bomb tests in genomic DNA [39]. Anticipating this slow turnover, we studied the adipose tissues at 7- to10 months after clonal transplantation. We observed significant adipocyte engraftment in mice fed with normal diet and very robust adipogenesis in the rosiglitazone-treated mice. The Spalding's study [39] disclosed a steady increase in the number of adipocytes during childhood. The concept that this dynamic renewal of adipocytes is supported by HSCs is likely to lead to new avenues of therapeutic development for diseases involving adipose tissues. For example, severe genetic obesity may be treatable with allogeneic transplantation performed at early childhood. Currently patients with congenital leptin deficiency [40-43] or Berardinelli-Seip congenital lipoatrophy [44] characterized by low leptin levels and lipoatrophy, are treated with daily injection of recombinant leptin. An alternative form of cellular replacement therapy may be provided by early intervention with HSC transplantation. This notion is supported by the demonstration that the mouse model of human leptin deficiency, ob/ob mice, is treatable by transplantation of adipose tissue from wild type mice [45,46]. Many current studies of adipocytes utilize established cell lines that are committed to adipocytic differentiation. Our primary culture method that allows uncommitted hematopoietic cells to generate adipocytes should contribute to the studies of the mechanisms of early adipocytic differentiation and may lead to development of therapeutic solutions for many general obesity issues.
Supplemental Material
Figure S1. HSC derived adipocytes in multiple sites in vivo. Peritoneal (A-D and M-P), omental (E-H) and peri-nephric (I-L) fat pads from mice transplanted with a clonal population of cells derived from a single EGFP+ HSC were sectioned (5 μm) and examined using high magnification epi-fluorescent and DIC microscopy. Shown are representative sections from each. Numerous EGFP+ cells (A, E, I, M, arrows) with characteristic morphology of adipocytes (B, F, J, N, arrows), were observed. Sections were stained using antibodies to leptin (C, G, K, O). Superimposition of the green EGFP images and red images of leptin demonstrate co-expression of EGFP and leptin (D, H, L, P, arrows). Panels M-P show EGFP expression, DIC and negative control for leptin staining, respectively. Scale bar in A-P equals 25 μm.
Figure S2. Analysis of nuclear DNA content of cultured adipocytes. The adipocytes were fixed in 70% ethanol and stained with propidium iodide in the presence of RNase. Controls are B16 melanoma cells and peripheral blood (PB) MNCs. The left peaks indicate cells in G0/G1 and the right peaks G2/M states in adipocytes and PB MNCs.
Table S1. PCR primer sequences and GeneBank Accession Numbers
Table S2. Relationship between hematopoietic lineage expression and adipogenesis observed from single hematopoietic progenitors
Acknowledgments
This work was supported by National Institutes of Health grants R01 HL069123 (M.O.), R01 DC00713 (B.A.S.), P01 CA78582 (D.K.W.) and by the office of Research and Development, Medical Research Services, Department of Veterans Affairs (A.C.L.). The authors would like to acknowledge the Hollings Cancer Center Flow Cytometry Core and specifically thank Dr. Haiqun Zeng for assistance in FACS sorting. We also thank Mr. Romeo S. Abangan, Jr. for assistance in transplantation experiments, Ms. Liya Liu for assistance in tissue processing and the staff of the Radiation Oncology Department of the Medical University of South Carolina in irradiation of mice.
Footnotes
Conflict of Interest Disclosure: No financial interest/relationships with financial interest relating to the topic of this article have been declared.
Publisher's Disclaimer: This is a PDF file of an unedited manuscript that has been accepted for publication. As a service to our customers we are providing this early version of the manuscript. The manuscript will undergo copyediting, typesetting, and review of the resulting proof before it is published in its final citable form. Please note that during the production process errors may be discovered which could affect the content, and all legal disclaimers that apply to the journal pertain.
References
- 1.Pittenger MF, Mackay AM, Beck SC, et al. Multilineage potential of adult human mesenchymal stem cells. Science. 1999;284:143–147. doi: 10.1126/science.284.5411.143. [DOI] [PubMed] [Google Scholar]
- 2.Prockop DJ. Marrow stromal cells as stem cells for nonhematopoietic tissues. Science. 1997;276:71–74. doi: 10.1126/science.276.5309.71. [DOI] [PubMed] [Google Scholar]
- 3.Gregoire FM. Adipocyte differentiation: from fibroblast to endocrine cell. Exp Biol Med (Maywood) 2001;226:997–1002. doi: 10.1177/153537020122601106. [DOI] [PubMed] [Google Scholar]
- 4.Ntambi JM, Young-Cheul K. Adipocyte differentiation and gene expression. J Nutr. 2000;130:3122S–3126S. doi: 10.1093/jn/130.12.3122S. [DOI] [PubMed] [Google Scholar]
- 5.Napolitano L. The Differentiation of White Adipose Cells. an Electron Microscope Study. J Cell Biol. 1963;18:663–679. doi: 10.1083/jcb.18.3.663. [DOI] [PMC free article] [PubMed] [Google Scholar]
- 6.Tholpady SS, Aojanepong C, Llull R, et al. The cellular plasticity of human adipocytes. Ann Plast Surg. 2005;54:651–656. doi: 10.1097/01.sap.0000158065.12174.40. [DOI] [PubMed] [Google Scholar]
- 7.Hong KM, Burdick MD, Phillips RJ, Heber D, Strieter RM. Characterization of human fibrocytes as circulating adipocyte progenitors and the formation of human adipose tissue in SCID mice. Faseb J. 2005;19:2029–2031. doi: 10.1096/fj.05-4295fje. [DOI] [PubMed] [Google Scholar]
- 8.Ogawa M, Larue AC, Drake CJ. Hematopoietic origin of fibroblasts/myofibroblasts: its pathophysiologic implications. Blood. 2006;108:2893–2896. doi: 10.1182/blood-2006-04-016600. [DOI] [PubMed] [Google Scholar]
- 9.Fujita J, Mori M, Kawada H, et al. Administration of granulocyte colony-stimulating factor after myocardial infarction enhances the recruitment of hematopoietic stem cell-derived myofibroblasts and contributes to cardiac repair. Stem Cells. 2007;25:2750–2759. doi: 10.1634/stemcells.2007-0275. [DOI] [PubMed] [Google Scholar]
- 10.Miyata E, Masuya M, Yoshida S, et al. Hematopoietic origin of hepatic stellate cells in the adult liver. Blood. 2008;111:2427–2435. doi: 10.1182/blood-2007-07-101261. [DOI] [PubMed] [Google Scholar]
- 11.Ebihara Y, Masuya M, Larue AC, et al. Hematopoietic origins of fibroblasts: II. In vitro studies of fibroblasts, CFU-F, and fibrocytes. Exp Hematol. 2006;34:219–229. doi: 10.1016/j.exphem.2005.10.008. [DOI] [PubMed] [Google Scholar]
- 12.Crossno JT, Jr, Majka SM, Grazia T, Gill RG, Klemm DJ. Rosiglitazone promotes development of a novel adipocyte population from bone marrow-derived circulating progenitor cells. J Clin Invest. 2006;116:3220–3228. doi: 10.1172/JCI28510. [DOI] [PMC free article] [PubMed] [Google Scholar]
- 13.Koh YJ, Kang S, Lee HJ, et al. Bone marrow-derived circulating progenitor cells fail to transdifferentiate into adipocytes in adult adipose tissues in mice. J Clin Invest. 2007;117:3684–3695. doi: 10.1172/JCI32504. [DOI] [PMC free article] [PubMed] [Google Scholar]
- 14.Okabe M, Ikawa M, Kominami K, Nakanishi T, Nishimune Y. ‘Green mice’ as a source of ubiquitous green cells. FEBS Lett. 1997;407:313–319. doi: 10.1016/s0014-5793(97)00313-x. [DOI] [PubMed] [Google Scholar]
- 15.Matsuzaki Y, Kinjo K, Mulligan RC, Okano H. Unexpectedly efficient homing capacity of purified murine hematopoietic stem cells. Immunity. 2004;20:87–93. doi: 10.1016/s1074-7613(03)00354-6. [DOI] [PubMed] [Google Scholar]
- 16.Goodell MA, Rosenzweig M, Kim H, et al. Dye efflux studies suggest that hematopoietic stem cells expressing low or undetectable levels of CD34 antigen exist in multiple species. Nat Med. 1997;3:1337–1345. doi: 10.1038/nm1297-1337. [DOI] [PubMed] [Google Scholar]
- 17.LaRue AC, Masuya M, Ebihara Y, et al. Hematopoietic origins of fibroblasts: I. In vivo studies of fibroblasts associated with solid tumors. Exp Hematol. 2006;34:208–218. doi: 10.1016/j.exphem.2005.10.009. [DOI] [PubMed] [Google Scholar]
- 18.Masuya M, Drake CJ, Fleming PA, et al. Hematopoietic origin of glomerular mesangial cells. Blood. 2003;101:2215–2218. doi: 10.1182/blood-2002-04-1076. [DOI] [PubMed] [Google Scholar]
- 19.Osawa M, Hanada K, Hamada H, Nakauchi H. Long-term lymphohematopoietic reconstitution by a single CD34-low/negative hematopoietic stem cell. Science. 1996;273:242–245. doi: 10.1126/science.273.5272.242. [DOI] [PubMed] [Google Scholar]
- 20.Hadjantonakis AK, Gertsenstein M, Ikawa M, Okabe M, Nagy A. Generating green fluorescent mice by germline transmission of green fluorescent ES cells. Mech Dev. 1998;76:79–90. doi: 10.1016/s0925-4773(98)00093-8. [DOI] [PubMed] [Google Scholar]
- 21.Levine JA, Jensen MD, Eberhardt NL, O'Brien T. Adipocyte macrophage colony-stimulating factor is a mediator of adipose tissue growth. J Clin Invest. 1998;101:1557–1564. doi: 10.1172/JCI2293. [DOI] [PMC free article] [PubMed] [Google Scholar]
- 22.Wei S, Lightwood D, Ladyman H, et al. Modulation of CSF-1-regulated post-natal development with anti-CSF-1 antibody. Immunobiology. 2005;210:109–119. doi: 10.1016/j.imbio.2005.05.005. [DOI] [PubMed] [Google Scholar]
- 23.Ramakers C, Ruijter JM, Deprez RH, Moorman AF. Assumption-free analysis of quantitative real-time polymerase chain reaction (PCR) data. Neurosci Lett. 2003;339:62–66. doi: 10.1016/s0304-3940(02)01423-4. [DOI] [PubMed] [Google Scholar]
- 24.Lang H, Ebihara Y, Schmiedt RA, et al. Contribution of bone marrow hematopoietic stem cells to adult mouse inner ear: Mesenchymal cells and fibrocytes. J Comp Neurol. 2006;496:187–201. doi: 10.1002/cne.20929. [DOI] [PMC free article] [PubMed] [Google Scholar]
- 25.Visconti RP, Ebihara Y, LaRue AC, et al. An in vivo analysis of hematopoietic stem cell potential: hematopoietic origin of cardiac valve interstitial cells. Circ Res. 2006;98:690–696. doi: 10.1161/01.RES.0000207384.81818.d4. [DOI] [PubMed] [Google Scholar]
- 26.Ogawa M, Larue AC. Origin of fibroblast colony-forming units. Exp Hematol. 2007;35:1319–1320. doi: 10.1016/j.exphem.2007.05.013. [DOI] [PubMed] [Google Scholar]
- 27.Abe R, Donnelly SC, Peng T, Bucala R, Metz CN. Peripheral blood fibrocytes: differentiation pathway and migration to wound sites. J Immunol. 2001;166:7556–7562. doi: 10.4049/jimmunol.166.12.7556. [DOI] [PubMed] [Google Scholar]
- 28.Drevon CA. Fatty acids and expression of adipokines. Biochim Biophys Acta. 2005;1740:287–292. doi: 10.1016/j.bbadis.2004.11.019. [DOI] [PubMed] [Google Scholar]
- 29.Grimaldi PA. The roles of PPARs in adipocyte differentiation. Prog Lipid Res. 2001;40:269–281. doi: 10.1016/s0163-7827(01)00005-4. [DOI] [PubMed] [Google Scholar]
- 30.Haunerland NH, Spener F. Fatty acid-binding proteins--insights from genetic manipulations. Prog Lipid Res. 2004;43:328–349. doi: 10.1016/j.plipres.2004.05.001. [DOI] [PubMed] [Google Scholar]
- 31.Terada N, Hamazaki T, Oka M, et al. Bone marrow cells adopt the phenotype of other cells by spontaneous cell fusion. Nature. 2002;416:542–545. doi: 10.1038/nature730. [DOI] [PubMed] [Google Scholar]
- 32.Ying QL, Nichols J, Evans EP, Smith AG. Changing potency by spontaneous fusion. Nature. 2002;416:545–548. doi: 10.1038/nature729. [DOI] [PubMed] [Google Scholar]
- 33.Alvarez-Dolado M, Pardal R, Garcia-Verdugo JM, et al. Fusion of bone-marrow-derived cells with Purkinje neurons, cardiomyocytes and hepatocytes. Nature. 2003;425:968–973. doi: 10.1038/nature02069. [DOI] [PubMed] [Google Scholar]
- 34.Nygren JM, Jovinge S, Breitbach M, et al. Bone marrow-derived hematopoietic cells generate cardiomyocytes at a low frequency through cell fusion, but not transdifferentiation. Nat Med. 2004;10:494–501. doi: 10.1038/nm1040. [DOI] [PubMed] [Google Scholar]
- 35.Vassilopoulos G, Wang PR, Russell DW. Transplanted bone marrow regenerates liver by cell fusion. Nature. 2003;422:901–904. doi: 10.1038/nature01539. [DOI] [PubMed] [Google Scholar]
- 36.Wang X, Willenbring H, Akkari Y, et al. Cell fusion is the principal source of bone-marrow-derived hepatocytes. Nature. 2003;422:897–901. doi: 10.1038/nature01531. [DOI] [PubMed] [Google Scholar]
- 37.LaBarge MA, Blau HM. Biological progression from adult bone marrow to mononucleate muscle stem cell to multinucleate muscle fiber in response to injury. Cell. 2002;111:589–601. doi: 10.1016/s0092-8674(02)01078-4. [DOI] [PubMed] [Google Scholar]
- 38.Camargo FD, Green R, Capetanaki Y, Jackson KA, Goodell MA. Single hematopoietic stem cells generate skeletal muscle through myeloid intermediates. Nat Med. 2003;9:1520–1527. doi: 10.1038/nm963. [DOI] [PubMed] [Google Scholar]
- 39.Spalding KL, Arner E, Westermark PO, et al. Dynamics of fat cell turnover in humans. Nature. 2008;453:783–787. doi: 10.1038/nature06902. [DOI] [PubMed] [Google Scholar]
- 40.Farooqi IS, Jebb SA, Langmack G, et al. Effects of recombinant leptin therapy in a child with congenital leptin deficiency. N Engl J Med. 1999;341:879–884. doi: 10.1056/NEJM199909163411204. [DOI] [PubMed] [Google Scholar]
- 41.Farooqi IS, Matarese G, Lord GM, et al. Beneficial effects of leptin on obesity, T cell hyporesponsiveness, and neuroendocrine/metabolic dysfunction of human congenital leptin deficiency. J Clin Invest. 2002;110:1093–1103. doi: 10.1172/JCI15693. [DOI] [PMC free article] [PubMed] [Google Scholar]
- 42.Gibson WT, Farooqi IS, Moreau M, et al. Congenital leptin deficiency due to homozygosity for the Delta133G mutation: report of another case and evaluation of response to four years of leptin therapy. J Clin Endocrinol Metab. 2004;89:4821–4826. doi: 10.1210/jc.2004-0376. [DOI] [PubMed] [Google Scholar]
- 43.Licinio J, Caglayan S, Ozata M, et al. Phenotypic effects of leptin replacement on morbid obesity, diabetes mellitus, hypogonadism, and behavior in leptin-deficient adults. Proc Natl Acad Sci U S A. 2004;101:4531–4536. doi: 10.1073/pnas.0308767101. [DOI] [PMC free article] [PubMed] [Google Scholar]
- 44.Beltrand J, Beregszaszi M, Chevenne D, et al. Metabolic correction induced by leptin replacement treatment in young children with Berardinelli-Seip congenital lipoatrophy. Pediatrics. 2007;120:e291–296. doi: 10.1542/peds.2006-3165. [DOI] [PubMed] [Google Scholar]
- 45.Klebanov S, Astle CM, DeSimone O, Ablamunits V, Harrison DE. Adipose tissue transplantation protects ob/ob mice from obesity, normalizes insulin sensitivity and restores fertility. J Endocrinol. 2005;186:203–211. doi: 10.1677/joe.1.06150. [DOI] [PubMed] [Google Scholar]
- 46.Sennello JA, Fayad R, Pini M, Gove ME, Fantuzzi G. Transplantation of wild-type white adipose tissue normalizes metabolic, immune and inflammatory alterations in leptin-deficient ob/ob mice. Cytokine. 2006;36:261–266. doi: 10.1016/j.cyto.2007.02.001. [DOI] [PMC free article] [PubMed] [Google Scholar]
Associated Data
This section collects any data citations, data availability statements, or supplementary materials included in this article.
Supplementary Materials
Figure S1. HSC derived adipocytes in multiple sites in vivo. Peritoneal (A-D and M-P), omental (E-H) and peri-nephric (I-L) fat pads from mice transplanted with a clonal population of cells derived from a single EGFP+ HSC were sectioned (5 μm) and examined using high magnification epi-fluorescent and DIC microscopy. Shown are representative sections from each. Numerous EGFP+ cells (A, E, I, M, arrows) with characteristic morphology of adipocytes (B, F, J, N, arrows), were observed. Sections were stained using antibodies to leptin (C, G, K, O). Superimposition of the green EGFP images and red images of leptin demonstrate co-expression of EGFP and leptin (D, H, L, P, arrows). Panels M-P show EGFP expression, DIC and negative control for leptin staining, respectively. Scale bar in A-P equals 25 μm.
Figure S2. Analysis of nuclear DNA content of cultured adipocytes. The adipocytes were fixed in 70% ethanol and stained with propidium iodide in the presence of RNase. Controls are B16 melanoma cells and peripheral blood (PB) MNCs. The left peaks indicate cells in G0/G1 and the right peaks G2/M states in adipocytes and PB MNCs.
Table S1. PCR primer sequences and GeneBank Accession Numbers
Table S2. Relationship between hematopoietic lineage expression and adipogenesis observed from single hematopoietic progenitors