Abstract
Numbers and kinds of point mutant within DNA from cells, tissues and human population may be discovered for nearly any 75–250bp DNA sequence. High fidelity DNA amplification incorporating a thermally stable DNA “clamp” is followed by separation by denaturing capillary electrophoresis (DCE). DCE allows for peak collection and verification sequencing. DCE in a mode of cycling temperature, e.g.+/− 5°C, CyDCE, permits high resolution of mutant sequences using computer defined analytes without preliminary optimization experiments. DNA sequencers have been modified to permit higher throughput CyDCE and a massively parallel,~25,000 capillary system, has been designed for pangenomic scans in large human populations. DCE has been used to define quantitative point mutational spectra for study a wide variety of genetic phenomena: errors of DNA polymerases, mutations induced in human cells by chemicals and irradiation, testing of human gene-common disease associations and the discovery of origins of point mutations in human development and carcinogenesis.
INTRODUCTION
From the postulation of the DNA structure by Watson and Crick 1 through the discovery of non-random mutational spectra by Benzer and Freese 2 and the partial sequencing of the human 3, 4 and other genomes improved of methods for DNA analysis have marked major steps forward in the understanding of genetics and genetic change. The improved methods have included modes of sequencing DNA 5–7, allele-specific recognition of mutant sequences 8–10 and methods that separate point mutant from wild type sequences on the basis of lower thermal stability in wild type/mutant heteroduplexes as opposed to wild type homoduplexes 11–19. A review of all of these contributions is beyond the scope of this effort; here we focus on the technical history and applications of methods that depend on the separation of wild type and mutant sequences on the basis of kinetics of DNA melting and reannealing while DNA is moved by electromotive force through a molecular sieve such as a polyacrylamide gel.
The fundamental science underlying the development of this form of mutant DNA separation lies in the statistical mechanical model of DNA melting/annealing equilibrium developed by David Poland (1974) 20
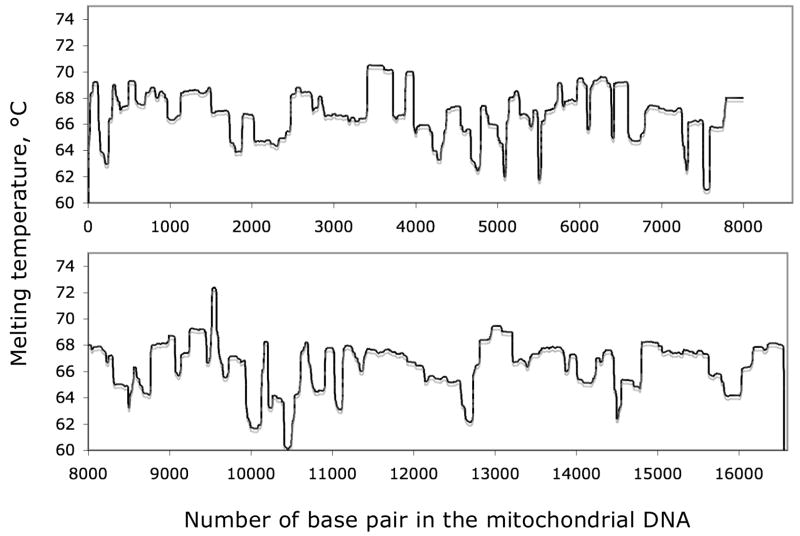
The experimentally-determined enthalpies of melting for any of the possible DNA base-pairs nested in of the sixteen possible nearest neighbor contexts 21–23 incorporated in Poland’s algorithm revealed that natural DNA sequences comprised a series of contiguous isomelting domains 24. An isomelting domain is a DNA sequence in which calculation of the equilibrium melting temperature reveals all base pairs to have the same melting temperature, Tm. As may be seen for the human mitochondrial genome in figure 1 isomelting domains are as short as 50 bp or greater than 1000 bp in length. In 2007, the melting map of the known nuclear sequences of the human genome was calculated and made publicly available 25. Though limited by the incompleteness of the Human Genome Project (Critical non-repetitive sequences such as in the subtelomeric regions of many chromosomes remain undefined.), the sequences comprising all known human exons and their splice sites were included in the melting map 25. The calculations to use this information to define suitable reagents (restriction enzymes, DNA extension primers) for all exons are in progress (E. Hovig, PubGene, Inc., personal communication). An important attribute of the technical process of mutational spectrometry using denaturing gel electrophoresis in the cycling temperature mode described herein is that Poland’s algorithm permits computer defined reagents that may be applied without labor-intensive preliminary optimization steps 26. However, the technical path to present capability did not begin with our collaborators or us.
Figure 1. Melting profile of the Mitochondrial DNA sequence.
The figure illustrates the characteristic of natural DNA sequences with the melting map of the consensus human mitochondrial genome, first calculated but unpublished by Leonard Lerman and John Hanekamp circa 1991.
It was Stuart Fischer, a graduate student of Leonard Lerman at Albany Medical College, who first hypothesized and then demonstrated that the cooperative equilibria of DNA melting/annealing could be used to separate similar double stranded DNA sequences using electrophoresis polyacrylamide slab gels 27. Key to his contribution was the tactic of scanning for mutations in a ~100 bp DNA isomelting sequence contiguous with a more thermally stable DNA sequence of 50–75 bp that “clamped” one end of the sequence scanned. Thus the melting/annealing reactions were limited to a very small effective volume eliminating the diffusion-limited steps of melting and reannealing for unclamped sequences.
At the equilibrium melting temperature of the less stable isomelting domain, Tm, half of the clamped sequences would be partially melted and half fully annealed. Above Tm the partially melted form predominates, below, the fully annealed. In an electric field applied across a polyacrylamide gel partially melted clamped sequences migrate at velocities significantly lower than the fully annealed sequences. Solutions of chemicals, which stabilize single stranded DNA, may also be used to define a condition of melting/annealing equilibrium. In physiological saline the range of melting temperatures of the isomelting domains of the human genome is ~48°–96°C 25. In practice it is desirable to work at lower temperatures to avoid DNA degradation and this may be achieved by the use of chemical denaturants such as urea. Fischer used a fixed temperature and a chemical gradient of urea/formamide to dramatically slow a homoduplex molecule as it approached the melting condition of the lower isomelting domain on a gel. Using this approach Fischer and Lerman separated homoduplex DNA sequences differing by but a single base pair 11, 12 terming their technology, denaturing gradient gel electrophoresis or DGGE. Leonard Lerman kindly provided training for our laboratory in early 1984. As we were trying to find a way to discover and count point mutations present at low frequencies in human cells and tissue, we proposed the tactic of melting and reannealing DNA sequences to force all point mutant sequences into heteroduplexes with wild type sequences by mass action 28. Subsequently it was found that such separations were reasonably facile and could include separations of DNA heteroduplex sequences differing in single base substitutions or base methylations 29.
In 1991 Eivind Hovig working with Anne-Lise Børresen in the Radium Hospital in Oslo significantly increased resolution of individual heteroduplex peaks by maintaining a slab gel constant near-equilibrium melting temperature of the sequence analyzed without a chemical denaturant or temperature gradient 17, 19, 30. About this time J. Hanekamp at MIT discovered that residual cross-linking reagent used in plate gels was non-specifically binding a substantial fraction of DNA throughout the separation process. This observation led us to combine the method of capillary gel electrophoresis that had been developed in Barry Karger’s laboratory at Northeastern University because the replaceable capillary matrices did not use a cross-linking agent 31, 32. This development combined with efforts led by Konstantin Khrapko at MIT increased peak detection sensitivity to < 1% by decreasing background noise from non-specific gel binding and increasing peak resolution via the intrinsic qualities of capillary electrophoresis 15. Laser induced fluorescence, also adopted from Karger’s laboratory 31, 33, was used to detect migrating peaks replacing the cumbersome methods of detection of 32P-labelled DNA. We found that electrophoretic peaks containing mutant/wild type heteroduplex peaks could be recovered, re-amplified and subjected to DNA sequencing. Of particular importance was the demonstration that the entire electrophoretic fraction could be collected, re-amplified and re-run on a constant temperature capillary gel to observe point mutant fractions as low as 10−6, 34–39.
These improvements in separation technology alone would not, however, have been sufficient to achieve the sensitivities reported. In late 1985 after Saiki et al 40 re-introduced the concept of DNA amplification by sequential primer extension 41, we noted that the error frequency of DNA polymerase fragment used therein had been estimated to be ~10−4 per bp per doubling by Bessman and Goodman 42–46. As this error rate would create a very high polymerase induced background of point mutations, Phouthone Keohavong and Alexandra Kat at MIT used the denaturing gradient plate gels of Fischer and Lerman to probe the nature of polymerase errors in DNA amplification 47–49. Again following Bessman and Goodman, they demonstrated the importance of using an intrinsically high fidelity DNA polymerase (phage T7) to increase sensitivity of detection of point mutations and also discovered the important, if unfortunate, phenomenon of “allelic preference” in which a particular point mutant sequence may be found to have a significantly higher (or lower) yield per cycle in DNA amplification leading to gross overestimation (underestimation) of the mutant fraction for a particular allele 49–53. They introduced the control experiment of re-amplification of any mutant mixture to discover if amplification had been affected by an example of positive allelic preference. Of course, the method is blind to any case of strong negative allelic preference that may exist for a particular DNA sequence/DNA polymerase combination. In subsequent studies it was found that the thermally stable Pfu DNA polymerase yielded satisfactorily low error rates and provided the simplicity of simple temperature cycling without polymerase addition at each amplification cycle 54.
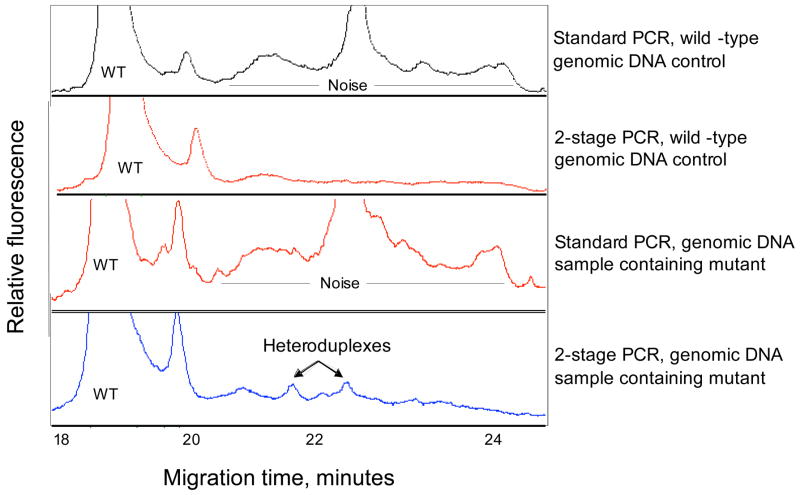
“Noise” is, however, always the enemy of analytical sensitivity. Despite excellent electrophoretic resolution of heteroduplex peaks and use of a high fidelity DNA amplification protocol, noise peaks were frequently seen in most DNA amplification products that could account for up to 30% of the total product signal and obscure true mutant/wild type heteroduplex peaks. The noise comprised a diverse set of amplification products. Some noise peaks, upon identification by sequencing, were found to be low-probability amplification products from the human genome, which we termed “ genomic noise”. Genomic noise can be overcome by increasing the specificity of primer design and/or the stringency of DNA amplification conditions. A majority of the noise peaks, however, yielded only wild type sequences after collection and re-amplification. These peaks arose chiefly from amplicons containing heat-induced DNA damage such as uracil caused by cytosine deamination and abasic sites such as created by depurination. This form of noise increases ~linearly with time at the DNA amplification denaturing temperature (>90°C). This “thermal” noise has been overcome to a large extent by strictly limiting the time and temperature profile of the denaturing step during DNA amplification and by introduction of a molecular ruse in the amplification process (Xiao-Cheng Li-Sucholeiki, unpublished observations). Instead of employing fluorescein-labelled primers throughout the entire amplification cycles, unlabelled primers are used in the first n-3 amplification cycles. In the last 3 cycles, additional master mix including fluorescein-labeled primers and extra Pfu are introduced. As the Pfu DNA polymerase does not copy past damaged bases, the last few cycles of DNA amplification creates labeled product that is largely free of artifacts (figure 2). It is possible to reduce this process to one final polymerase extension with labeled clamp-primers. Heteroduplex peak resolution is baseline even for the heteroduplexes resulting from single base pair insertion or deletion mutations that have melting temperatures closest of all heteroduplex forms to the wild type homoduplex. Such baselne resolution is required for accurate determination of mutant numbers in pooled human genomic samples such as the pools of 100 persons we have routinely employed.
Figure 2. Noise reduction by 2-stage DNA amplification.
Noise reduction by 2-stage DNA amplification method. The target sequence contains exon 1 of the CTLA-4 gene. The heteroduplex peaks were derived from an A to G mutation at codon 49. TK6 cell genomic DNA was used as wild-type genomic DNA control. Genomic DNA sample containing mutant was pooled samples from 50 individuals, one of which was a heterozygote at codon 49.
Applications in human DNA, cells, tissues, tumors and populations
Mitochondrial mutations
In Khrapko et al. 15, 38, 55–57, Coller et al.39 and Marcelino et al.58 the combination of high fidelity DNA amplification and constant denaturing capillary electrophoresis was used to discover the point mutations distributed in a 100 bp mitochondrial DNA sequence in human DNA replication by human DNA polymerase gamma, cells in culture, various tissues and derived tumors. Their work demonstrated for the first time that treatment of human cells with a chemical mutagen induced a reproducible set of mutations in mitochondrial DNA, that the spectrum of the “spontaneous” point mutations found in human cell cultures were not significantly different from those found in multiple human tissues and their derived tumors and that this in vivo mutational spectrum in the lung was not affected by cigarette smoking. An important control to determine if mutations observed were present in the original tissue sample was independent scanning of the opposite DNA strands to discover if any “mutations” might have been created by miscopying DNA reaction products in vivo. Zheng et al.59 provided an explanation for these findings by discovering that the in vivo human mutational spectrum was closely related to the spectrum of mutations created by copying the same sequence with cloned DNA polymerase gamma using the approach of Keohavong and Thilly adapted to capillary gel separations 49. Application of a simple control for mutations created by thermally mediated reactions offered evidence supporting the hypothesis that thermal damage of ssDNA intermediates in mitochondrial DNA replication (D-loop DNA) drive nearly all of the C to T base pair substitutions observed in vivo. T to C base pair substitution and frame-shift mutations appeared to originate as primary errors which are introduced and extended by DNA polymerase gamma. However, these experiments did not determine whether such errors rose from the consensus polymerase or from micro-heterogeneous variants of the polymerase.
Our estimates of mitochondrial point mutation frequencies human tissues and tumors permitted us to offer an explanation of homoplasmic mutations in human tumors as naturally occurring events during organogenesis and preneoplasia as opposed to selection via mitochondrial oncomutations. More recently these observations in the human lung have shown that mitochondrial mutations appear to arise in the expansion divisions of the fetal-juvenile period and do not significantly increase throughout the adult period 39, 57, 60–63.
Nuclear mutations in cells and tissues
An early application of this mode of mutational spectrometry in nuclear DNA was to test the hypothesis that nuclear mutation was driven primarily by DNA oxidation reactions. The hypothesis appeared to be invalidated by the finding that the spectra created in the third exon of the HPRT1 gene in human cells in culture by hyperbaric oxygen, hydrogen peroxide or ionizing radiation contained many clear mutational hotspots but that none were hotspots found as the spontaneous spectra of human cells in vitro or in vivo 64. Studies in human cell cultures with different concentrations of mutagen demonstrated that concentration and length of exposure dramatically altered the resultant mutational spectra 34, 65–69. Spectra for several other putative environmental mutagens were recorded and found to be mutagen-specific as originally demonstrated by Benzer and Freese in bacteriophage 2. However, the finding that about half of the point mutations accounting for somatic carcinogenic mutations in exon 13 of the APC gene were concordant with the spectrum produced by simply copying the same sequences with human DNA polymerase beta suggested that, as with mitochondrial point mutations, nuclear mutations are mediated, if not directly caused, by errors of DNA polymerases in vivo 70. sequences save for cytosine deamination. Evidence that some small but significant portion of in vivo mutations arise from unknown in vivo DNA methylation reactions was provided by comparison of the point mutational spectra of the HPRT1 exons in vivo to those induced in vitro by a DNA methylating agent 34, 71, 72. These several observations comparing in vitro to in vivo mutations in human DNA led to the hypothesis that save for sunlight, somatic mutations in human tissues may not be induced by ordinary exposures to environmental chemicals an radiation. More recently, measurements of mutations in human lungs and other clinical data have led to the hypothesis that mutations that initiate human tumors occur only during the fetal-juvenile period. It is clear that understanding of point mutagenesis during human development in multiple organs will require an increased capacity for mutational spectrometry in a large number of tissue samples from persons of differing ages. Fortunately, this need has been met by the Ekstrøm laboratory at the Radium Hospital in Oslo via the adaptation of common 96-capillary DNA sequencers to the task of parallel mutational spectrum assays 26, 73–76.
Nuclear mutations in human populations
One of the unmet public expectations for human genomic studies is the discovery of the genes that carry mutations conferring risk for common afflictions such as cancers. We have argued that this disappointment arises from a fundamental error in human population genetics, the expectation that disease risk in a large heterogeneous population will be essentially mono-allelic. In Tomita-Mitchell et al. we outlined a means to use denaturing capillary electrophoresis to test whether or not a specific gene carries risk for a particular common disease using pancreatic cancer as an example 77. In two papers Li-Sucholeiki et al. we demonstrated that thousands of human DNA samples could be interrogated by high fidelity DNA amplification and denaturing capillary electrophoresis as pooled samples of 100–10,000 persons such that the number and kind of all, undiscovered point mutations in exonic sequences could be found. In particular, it was demonstrated in a large case-control study that the gene CTLA4, widely touted as a gene associated by linkage studies for Type I diabetes risk, could not have accounted for even 1% of the risk for that disease 78, 79.
Having concluded that linkage disequilibrium studies will, in general, fail to detect a particular gene-disease association we have offered an alternative approach, a cohort allelic sums test, in which the sum of all exonic point mutations are determined and compared for a case and control cohort across all known human genes 80. In particular a method employing high fidelity DNA amplification and denaturing capillary electrophoresis was used to illustrate the process and to derive a statistical model to consider the scanning process for some 100 diseases processed in parallel. Recognizing that at present there is no scientific means to associate any gene with any common disease risk a priori we proposed to accelerate the process of mutational spectrometry in order to scan all exonic sequences (exons + splice sites) known in the human genome 26, 80.
To this end we have worked with our collaborators to have the melting map of the known human genome calculated and made publicly available 25 Soon, the reagent set for the pan-exonic human genome should be defined. Most recently we have illustrated how the Ekstrøm’s laboratory development of cycling denaturing capillary electrophoresis (CyDCE) eliminated the labor-intensive optimization steps attendant on constant denaturing systems. 26, 74, 76, 81–84.
CyDCE is readily adaptable to the construction and operation of large capillary arrays. The sensitivity of DCE, including CyDCE, permits pooling of 100 persons’ DNA to scan and enumerate mutant sequences for any and all human exonic sequences. Assuming ~250,000 scannable exonic segments 25 and the need to scan case cohorts of 10,000 persons for each of 100 common diseases 80, the task of testing each gene for statistical association with risk for any of these common diseases seems prodigious. However, with 100 person DNA pools, the task is represented by “only” 250,000 x 10,000 = 2.5 x 10⁹ CyDCE capillary runs. Designed and under construction is an instrument that should run 2.5 x 10⁴ CyDCE separations in less than 30 minutes. At this rate one instrument would complete the pangenomic scan for 100 diseases in some 125,000 hours. With 10 such instruments operating in parallel this task could be performed in less than a year. Given the necessary small blood or DNA samples for the 100 case cohorts, the present estimate of costs for instrument construction, DNA isolation and processing, including facilities and personnel, is somewhat less than $100 million, or somewhat less than $100 to scan all the exonic sequences of each person 26, 77, 80.
Other applications and a note on the scientific history of mutational spectrometry
A similar problem, definitions of the genes in which somatic mutations are required for the cascade processes of carcinogenesis and atherogenesis may be similarly solved. A more complete definition of the pathways of mutation creating the repertoire of antibodies should be accessible to this mode of mutational spectrometry. Noting the general failure of attempts to induce autoimmunity to tumors, we have speculated that the mutational creation of antigen diversity of the fetal-juvenile mutator stem cell period may present a large a set of protein variants prior to the thymic definition of “self”. If so, it would seem unlikely that strictly tumor-associated antigens would be created during the growth of preneoplastic lesions that would be targeted by the immune system. A gin this represents a means by which mutational spectrometry permits study of an important health phenomenon. There are so many applications of high-resolution point mutational spectra that they must be left to the reader’s imagination.
We noted that when Seymour Benzer the discoverer of non-random, experimentally reproducible point mutational spectra and the originator of mutational spectrometry, died in November 2007, his obituary was written by colleagues apparently ignorant or unappreciative of this extraordinary career contribution. Indeed the mix of mathematics, physical chemistry and systems genetics required to understand, practice and apply mutational spectrometry appears to have limited its use. Benzer in first presenting his results at a 1950s Cold Spring Harbor symposium was rebuked by Max Delbruck for “wasting his time obtaining so much data” (P. Hanawalt, personal communication). Population geneticists confused his work delineating the primary pathways of mutagenesis that would lead to multiallelic risk of disease with the more limited concept of reverse mutations 85. These errors were uncorrected as Benzer, depressed perhaps by the reception of his beautiful work in quantitative biology, abandoned the field to make his contributions identifying the genes that effect behavioral phenotypes in insects.
We and our several collaborators have striven to develop the technology for point mutational spectrometry, to provide easily used mathematical models for interpretation and statistical comparisons of quantitative spectra and provide initial examples of application to important medical biological problems.
PROTOCOLS
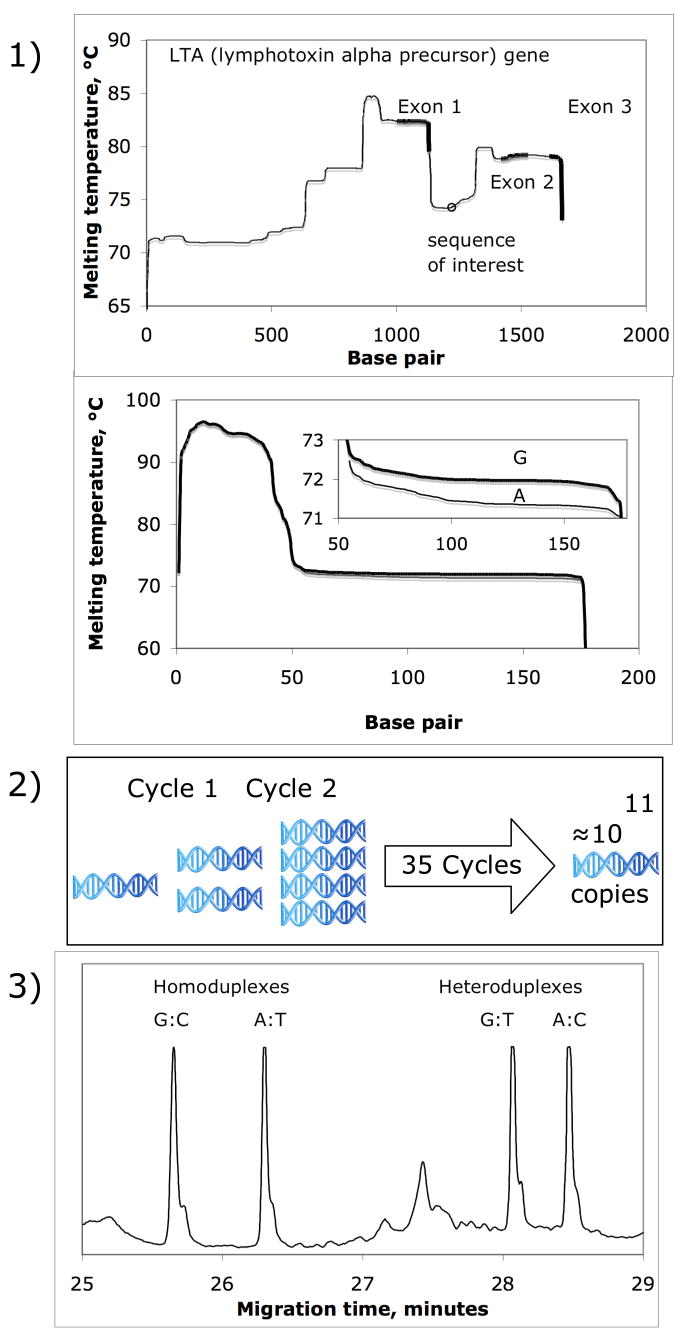
Figure 3 illustrates the general protocol to obtain a high-resolution mutational spectrum using CyDCE or other DCE modes. 1) selection of gene and simulation of melting temperatures of target alleles, 2) DNA amplification and 3) allele separation and quantitative visualization. Alleles in this example were separated in an 8-capillary instrument adapted from its use as a DNA sequencer.
Figure 3. Outline of DCE protocol.
Steps in DCE protocol, 1) fragment design, 2) target amplification by DNA amplification and 3) alleles separation by denaturing capillary electrophoresis. Samples were injected by applying 2.5kV for 15 seconds. Separation was achieved with standard voltage 4kV by cycling temperatures six times in twelve minutes between 50°and 53°C. Modifications to the DNA sequencer software to permit temperature cycling used MS SQL Manger Pro software. Queries with regard to software modification may be addressed to the communicating author.
MATERIALS
Analysis of DNA by denaturing capillary electrophoresis consists in general of three steps;
Fragment design.
DNA amplification
Allele separations by denaturing capillary electrophoresis
Fragment design
Because DNA is a universal molecule that can be found in every living organism the method of DCE can be applied to many different fields of biological research. Given the area of interest and the problem in question DNA sequences can be accessed on several sites from the Internet. (http://www.ncbi.nlm.nih.gov/mapview/, http://snpper.chip.org/, http://www.ebi.ac.uk/ensembl/index.html, http://genome.ucsc.edu/, http://www.arabidopsis.org/servlets/sv, http://www.mitomap.org/mitoseq.html)
Target sequences are selected base on the hypothesis that wants to be tested and target specific primers can be design by use of various online services like, http://frodo.wi.mit.edu/, http://www.changbioscience.com/primo/primo.html, http://www.autoprime.de/AutoPrimeWeb, http://ihg.gsf.de/ihg/ExonPrimer.html, http://www.idtdna.com/Scitools/Applications/PrimerQuest/Advanced.aspx,
Characteristics of DNA amplification primers
First the accuracy of the in-silica DNA sequence needs to be checked tagainst several databases. This is to make sure that annotation, intron/exon boundaries, reading frames, cDNA and/or sequence information are accurate. The investigators also have to be aware of possible pseudogenes or gene duplications that might be amplified with the same set primers (genomc noise).
The melting temperature (Tm) of the DNA amplification primer in physiological saline is usually selected to be between 52°C to 65°C. Primer should be designed to minimize self-hybridization, hairpin formation (>3 bp), lack of secondary priming sites and low specific binding at the 3’ end (i.e. lower GC content to avoid mispriming) All these variables can be adjusted in many of the computer primer design tools.
Design of DNA amplification fragments with appropriate melting behavior
In 1974 Poland proposed an algorithm able to calculate the melting probability of thousands of nucleotides in dsDNA 20. The algorithm stated that dsDNA melts to ssDNA when exposed to sufficiently high temperatures or a combination of temperature and chemical denaturants (formamide and urea). Studies based on this and related algorithms have shown that the length of a DNA fragment and the nucleotide sequence within the fragment defines the melting temperature at which each bp of the duplex is in perfect equilibrium between the denatured and helical state 21, 23, 24, 86, 87.
Computer software programs such as WinMelt/MacMelt and the Poland Internet web site 88 calculate the melting profile of defined homozygous dsDNA sequences based on different related algorithms. The programs calculate the midpoint temperature at which each bp is at 50/50 equilibrium between the helical and melted states. The data is then plotted as midpoint temperature versus the base sequence, creating a melting profile of the fragment 87. The goal of melting profile analysis of DNA fragments with computer programs prior to DCE is to select and manipulate the target sequence, attach GC-clamp if necessary, so that the region of interest is in a low melting domain adjacent to a sequence with high temperature melting properties 28, 53, 82, 87, 89–91. The introduction of the thermally stable clamp increases the percentage of detectable DNA variants in the low melting domain by DGGE to close to 100% 92, 93. Even if this statement must be further evaluated, it suggests that most of the genome can be analyzed with this methodology. When a naturally occurring high melting temperature sequence is present next to the target sequence, this can be used as high melting domain. If there are no high melting temperature region adjacent to the sequence of interest, the GC-clamp and be incorporated a ligation step 94 or as a part of the primer.
Evaluation of fragment’s melting properties
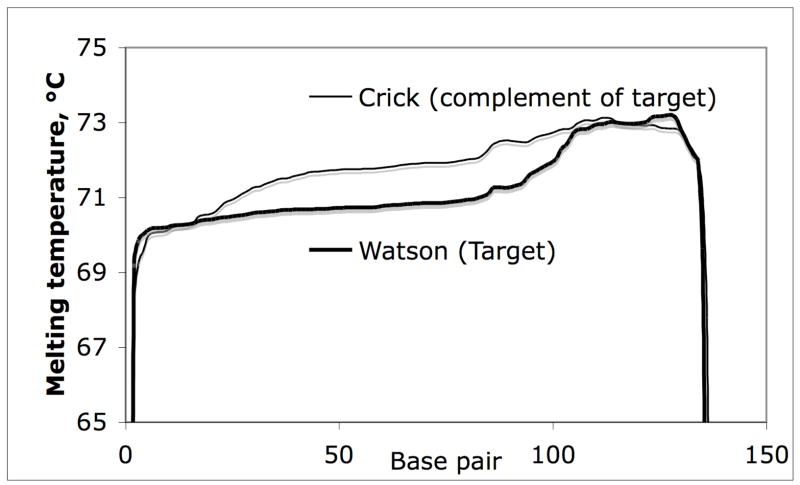
Fragments designed for DCE should be evaluated with respect to theoretical melting behavior by applying statistical mechanics of transition temperature. The melting profiles offer information about the suitability of the fragment design and suggestion temperature range for which the fragment should be analyzed. One curious problem arises because DNA sequence data bases occasionally contain errors with regard to the polarity of a DNA sequence., i.e. the 5′->3′ sequences of opposite “ Watson and Crick” strands may have been inadvertently reversed in recording in the data bases. As illustrated in figure 4 slightly different melting profiles are obtained when polarity of the double stranded sequences are reversed (WinMelt/MacMelt (Medprobe, Oslo, Norway) and seemingly aberrant behavior is observed in DCE separations in which calculations were based on the erroneous sequence information. Since many of the DNA sequences published in the public databases are not annotated with direction of the strand (5′->3′or 3′->5′) users need to take this into account when defining the analyte sequences (figure 4).
Figure 4. Theoretical DNA melting profile of target sequence.
Melting profile of “forward” Watson (5′-3′) and complementary Crick (3′-5′) DNA sequence. The algorithms should be used to calculate the 5′-3′sequences.
Another phenomenon that the first time user will encounter with melting temperature algorithms lies in the choices of parameters offered. Concentrations of DNA, salts and other denaturants such as urea may be varied.
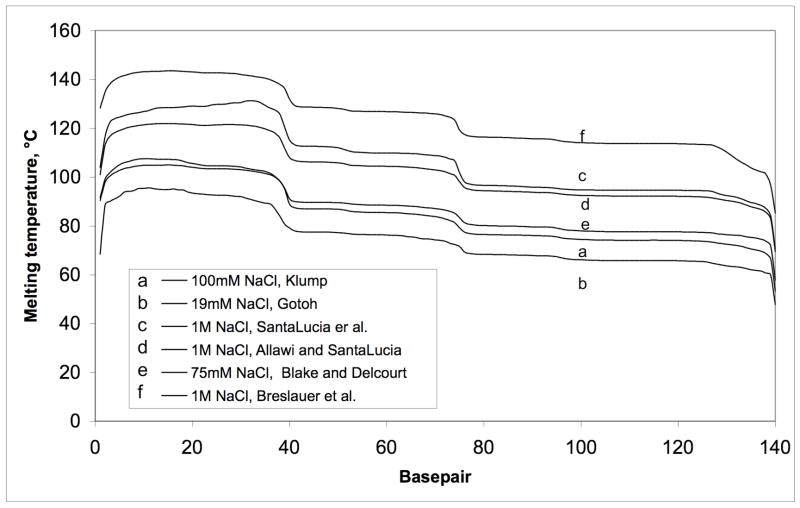
Figure 5 depicts the same sequence analyzed with a ssDNA concentration of 1x10⁻⁶ M and varying salt concentration88. Noticeable is the increase in the melting temperature with increase in theoretical NaCl concentration while the overall profile stays relatively the same. However, empirical observations using WinMelt/MacMelt (Medprod, Oslo, Norway) have allowed us to calculate melting temperatures to ±1°C used for denaturing setting.
Figure 5. Effect of applying different DNA melting algorithms.
Changes in theoretical melting profile by use of 6 different thermodynamic parameter sets 88. Please note the same salt concentration give different melting temperatures.
When first applying DCE a series of denaturing conditions should be tested to determine the relationship between the theoretical melting calculations (of the specific algorithm used) and conditions of matrix, capillary and temperature controller of the particular instrument. Inaccuracies of temperature in the constant temperature DCE mode of a little as 0.1°C can have deleterious effects on peak resolution. Fortunately, this problem is circumvented by the use cycling temperature denaturing capillary electrophoresis (CyDCE) or which there is no need to optimize the denaturant running condition for each fragment. In fact by cycling the temperature over a broad range, fragments with melting temperatures differing by as much as 12°C were analyzed simultaneously 26.
DNA extraction
Various methods of extracting DNA from biological samples range from phenol-chloroform extraction, salting out (DNA precipitation), microwave boiling, solid phase and mono disperse beads extraction. The purpose of DNA extraction is to obtain pure DNA free of contaminates or inhibitors for downstream processes. Obviously, the extraction method should yield a high fraction of the original DNA sample and not create DNA reaction products that can be transmutated during DNA amplification. The DNA extraction method selected should be based upon the nature of the sample from which the DNA shall be obtained and thus giving recommendation or guideline is beyond the scope of this protocol. However numerous reviews on the subject of DNA extraction in different samples types are available through literature databases 95–103.
DNA amplification
To efficiently analyze DNA, the number of copies in a sample must usually be increased. This may performed through the well-characterized polymerase chain reaction 41, 104. DNA amplification does not only increase number of copies of DNA exponentially, but also restricts the amplification to specific target sequences determined by the primers. Furthermore DNA amplification allows for incorporation of fluorescent dyes and high temperature melting domain, also known as GC-clamps 92, 93. DNA amplification protocols amplifying DNA with GC-clamped primers has been published elsewhere 13, 14, 35, 36, 78, 79, 84, 105–107.
DNA strand combination in heterozygote samples
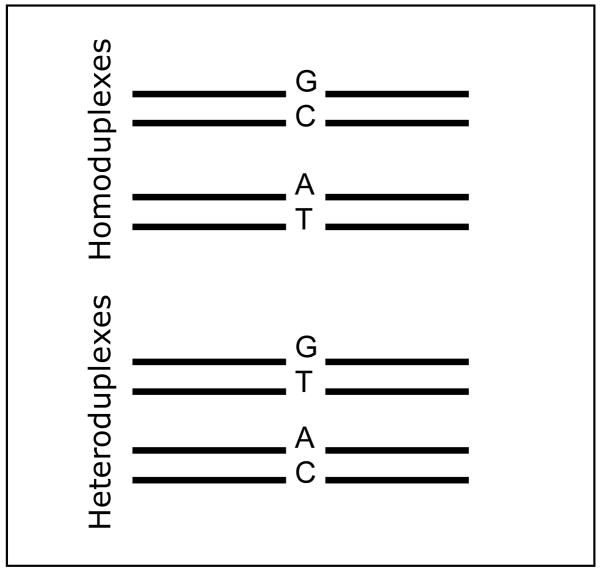
Figure 6 depicts possible combination of “Watson” and “Crick” single DNA strands when a sample, with two different alleles, are amplified by DNA amplification followed by the heteroduplex formation step were the DNA is denatured and the strands are allowed to reanneal at random. Due to the mismatch between bases in the hetroduplexes, these DNA products will be less stable than the homoduplexes and thus be more retarded during DCE 49. As a result of the four possible combinations of Watson and Cricks, four peaks will be resolved during DCE 28. In the electropherogram shown in figure 3 part 3, annotated peaks corresponding to homoduplexes and heteroduplexes are shown. In DNA sample with low mutant fractions (<2%), the wild type allele is present in large excess, thus forcing the variant sequences (by mass action) to re-anneal with the wild type sequences. Consequently three peaks, wildtype homoduplex and the two heteroduplexes will be observed in the electropherogram.
Figure 6. Possible strand combinations after DNA amplification of heterozygote sample.
Strand re-annealing combination after DNA amplification of a sample containing two alleles.
Denaturant capillary electrophoresis (DCE)
DCE were first demonstrated on an in house assembled capillary electrophoresis instrument by Khrapko et. al in 1994 15. The same method of allele separation was first demonstrated on a commercial capillary DNA sequencing in 2001 73, 108. DCE have been applied to 7 different capillary DNA sequencing instrument, ranging from single capillary up to 384 capillaries 38, 56, 73, 74, 78, 81, 82, 84, 89, 105. Due to the large variety of instrument and instrument protocols and setting, detailed running descriptions will not be given for each instrument. However, standard running condition as given by the instruments maker protocol, save for the denaturing temperature setting, has been used to separate alleles by DCE.
EQUIPMENT
Capillary electrophoresis instrument
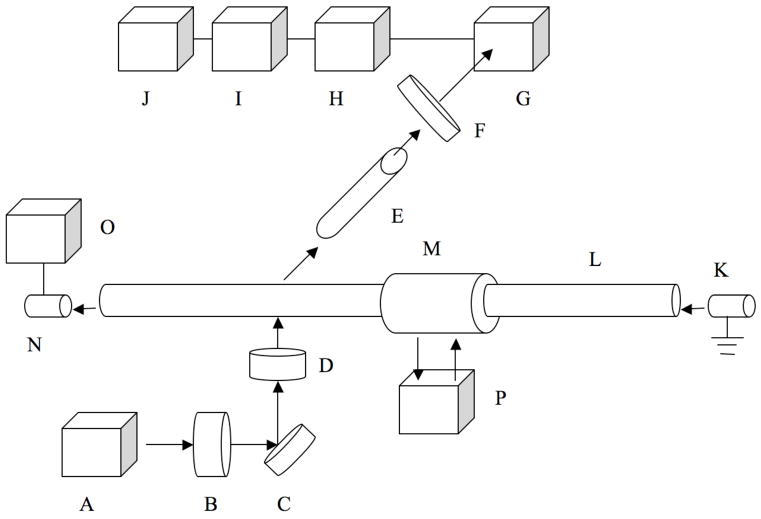
The first optical bench CDCE instrument is illustrated in figure 7. By using this instrument setting, mutant fractions down to 10−6 have be detected 15, 35, 36.
Figure 7. Schematics of optical bench assembled CDCE instrument.
Schematic presentation of the first CDCE instrument. A laser beam from an argon ion laser (A) is filtered through a 488 nm narrow band-pass filter (B), reflected by a 45º mirror (C) and focused by a plano-convex glass lense (D) onto a detection window of a horizontally positioned fused-silica capillary (L). Fluorescence emitted from the sample is collected by a 60 X microscope objective (E) and passes through a 520 nm 10mn band-pass filter (F) on to a photo multiplier tube (G). The signal from the photo multiplier tube is amplified by a current preamplifier (H), recorded by a data acquisition system and transmitted to a computer. The buffer reservoirs (K, N) are positioned at the two ends of the capillary. At the cathodic end the capillary is inserted into a water jacket (M), the temperature of which is controlled by a constant temperature water circulator (P). The power supply (O) drives the electrophoresis (high voltage, low current).
Commercial capillary DNA sequencing instruments
ABI PRISM® 310 Genetic Analyzer (Applied Biosystems, Foster City, CA) single capillary system.
https://products.appliedbiosystems.com:443/ab/en/US/adirect/ab?cmd=catNavigate2&catID=600525
ABI PRISM® 3100 Genetic Analyzer (Applied Biosystems, Foster City, CA) 16-capillary system.
https://products.appliedbiosystems.com:443/ab/en/US/adirect/ab?cmd=catNavigate2&catID=600530
CEQ™ 8000 Genetic Analysis System (Beckman Coulter, Fullerton, CA) 8-capillary system.
http://www.beckmancoulter.com/products/instrument/geneticanalysis/ceq/ceq8000_inst_dcr.asp
MegaBACE 500 DNA Analysis Systems (GE Healthcare Bio-Sciences Corp., Piscataway, NJ) 48-capillary system.
MegaBACE 1000 DNA Analysis Systems (GE Healthcare Bio-Sciences Corp., Piscataway, NJ) 96-capillary system.
MegaBACE 4000 DNA Analysis Systems (GE Healthcare Bio-Sciences Corp., Piscataway, NJ) 384-capillary system
SCE 2410 (Spectrumedix, State College, PA) 96 capillary system from Spectrumedix which went out of business in March 2007. However Transgenomic purchased certain assets of SpectruMedix, and continues to support their capillary electrophoresis instruments.
http://www.transgenomic.com/pd/spectrumedix.asp
In theory any CE instrument with sufficient temperature control can be used to separate DNA by the method of DCE.
Temperature zones
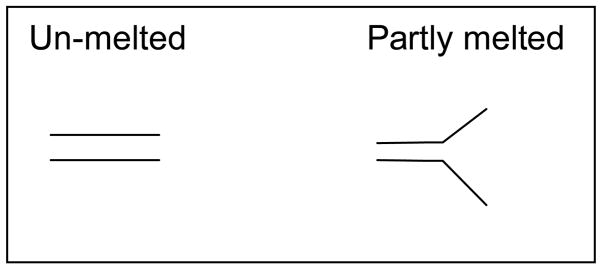
DNA is separated by DCE based on difference in velocity between the double strand DNA and the partly melted DNA (figure 8) when the DNA migrates through the sieving matrices in the capillary. Thus controlling the separation temperature surrounding the capillary is important to obtain good separation by DCE. Different approaches have been used to control the denaturing temperature. Capillaries have been inserted into “jacket” with circulating warm water from water bath. Due to the heat capacity of water and big volume this gave very good temperature control down to ±0.05°C 13, 36, 77. A second approach is the use of temperature controllers and solid-state heaters. This gave temperature control in the range of ±0.5 °C and down to ±0.013 °C 13, 36, 77, 78, 109. Another way of controlling the capillary denaturing temperature is by air-ventilated chambers, which are commonly used in commercial capillary DNA sequencing instruments. However this method of controlling the temperature is the least accurate. Nevertheless resent findings have demonstrated that by cycling the temperature in the capillary chamber will force the fragments to partly denature and reannel during the course of the temperature changes, and consequently the need for fragment specific denaturation conditions is omitted 26.
Figure 8. Illustration of partly melting of the amplified DNA.
The figure illustrates the partly melting of the double strands DNA. The left is unmelted DNA while the right hand side depict partly melted DNA held together by a GC-clamp (y-shape).
Sieving matrices
For alleles to be separated by DCE the DNA needs to migrate through a polymer or sieving matrix. A wide variety of matrices have been tested and found capable of separate DNA during DCE. We have tested commercial matrices like POP4 and POP6 (Applied Biosystems, Foster City, CA, USA) MegaBACE Long read matrix (GE Healthcare Bio-Sciences AB, Uppsala Sweden), GenomeLab Separation Gel LPA-1 (Beckman Coulter, Fullerton, CA, USA) and Reveal Hi Resolution Matrix (Transgenomic, Omaha, NE, USA). Additionally, in laboratory formulation of sieving matrices, by mixing or polymerization of LPA, PDMA, and PVP has demonstrated to produce suitable separation matrices used for allele separation by DCE 75.
EQUIPMENT SETUP
Set denaturing temperature
Replace polymer
Inject sample, by applying ≈150V/cm for 15 sec.
Run the electrophoresis at ≈150V/cm for 30 up to 60 minutes. Depending on capillary length, polymer and fragment.
REAGENTS
Biological sample,
CAUTION sample may contain pathogens like viruses and /or bacteria. Use laboratory protective equipment according to good laboratory practice. Always use glows and goggles.
DNA extraction kit.
CAUTION
Kits contains substances which are harmful by inhalation, in contact with skin and if swallowed. Contact with acids liberates very toxic gas. Irritating to eyes and skin.
The chemicals used for the buffer were of analytical grade (Sigma-Aldrich, Steinheim, Germany).
10 x running buffer
Containing 300 mM Trizma®Base, 1 M TAPS, 10 mM EDTA, pH adjusted to 8.0
CAUTION
Irritating to eyes, respiratory system and skin.
1 x Buffer used to dissolve polymer
Containing 30 mM Trizma®Base, 100 mM TAPS, 1 mM EDTA, and 7 M urea, pH adjusted to 8.0
CAUTION
Irritating to eyes, respiratory system and skin.
Polymers can be obtained from different vendors. The poly(vinyl pyrrolidone) (PVP) 10, 40, 360 and 1300 kDa can obtained from Sigma-Aldrich and Fluka, Sigma-Aldrich, or Scientific Polymer. Different size molecules of linear polyacrylamide (LPA), MW and Poly(N,N-dimethyl acrylamide) (PDMA) can be obtained from Scientific Polymer (Ontario, NY, USA).
REAGENT SETUP
To make one liter 10Xrunning buffer, take 243.3 g TAPS, 36.36g Tris and 20ml 0.5M solution EDTA and reconstitute to 1 liter with H2O. Adjust pH to 8.0 with 5M NaOH (CAUTION). Sterile filter the solution and store at room temperature.
1x running buffer is made by taking 100ml 10xbuffer and diluting it with 900ml H2O. The buffer can be stored at room temperature.
Sieving matrix, ranging from 2%–8% is made by dissolving the desired polymer by weight/volume. If there is a temperature restriction in the capillary instrument, urea must be added to the sieving matrix. Thus to make 100ml, 7% 360kDa PVP with 7M urea, take 10ml 10x running buffer, add 42g urea adjust volume to 100ml with H2O. Add under constant stirring, 7 g of polymer powder. When the polymer and urea is fully dissolved, store in refrigerator. For more information see Ekstrøm and Bjørheim 2006 75.
PROCEDURE
1. Select the DNA sequence of interest from an appropriate database.
2. Cut and paste +200bp on each side of the sequence or sequences of interest into the primer design software. Select primers for the target sequence giving products length from 100 to 160 base pairs.
3. Blast the primer towards the complete genome of interest to investigate possible undesired co-amplification.
4. Take the target sequence information with primer regions and copy the sequence information into the software that will simulate the DNA melting temperature.
5. Based on the fragments theoretical melting properties, decide if a GC-clamp is needed and on which primer it shall be attached. The GC-clamp should be put on the side of the fragment with the highest average melting temperature. If there is no obvious side to place the GC-clamp, then simulate both possibilities (“left” and “right”). After determining where to put the GC-clamp re-analyze the melting temperature of the fragment now including the GC-clamp. Inspect the melting curve to make sure that the low-melting domain decreases from the domain’s starting point near the clamp to the end of the DNA fragment. There should in no case be a rise in the low-melting domain and any other point further in the direction of the low-melting end.
6. Synthesis the primer or order the primers from a nucleic acid synthesis company. As the quality and quantity varies between the different companies, we have experienced that, Eurogentec (http://www.eurogentec.com/home.html) delivers good primers, but they are somewhat expensive with regards to long primers (>60bp). Another supplier, which has proven to deliver good quality oligomers, is Integrated DNA Technologies (http://www.idtdna.com/Home/Home.aspx).
Pause point
CRITICAL STEPS
Because laser induced fluorescence is very sensitivity the DNA amplification product has to be specific and clean with respect to the target sequence. Hence the DNA amplification optimization and subsequently amplification of samples are the most critical step of DCE
7. Optimize the DNA amplification condition with respect to, annealing temperature, [Mg+], [primer] and [dNTP].
8. Amplify samples by DNA amplification
Pause point
Samples can be left overnight at 4°C or frozen for up to several months at −20°C
9. Make the instrument ready for DCE, by set the denaturing temperature equal the theoretical melting temperature (or corrected (reduced) melting temperature by ≈ 3°C/Mole of urea) and by replacing the sieving matrix in the capillary.
10. Inject sample and run the electrophoresis according to the instruments manual. A comment protocol would be to inject the sample by applying 160V/cm for 20 seconds and running the electrophoresis at 145V/cm. Depending on the size of the fragment and the distance from the injection to the detection point the alleles should elute after 20 to 40 minutes.
Pause point
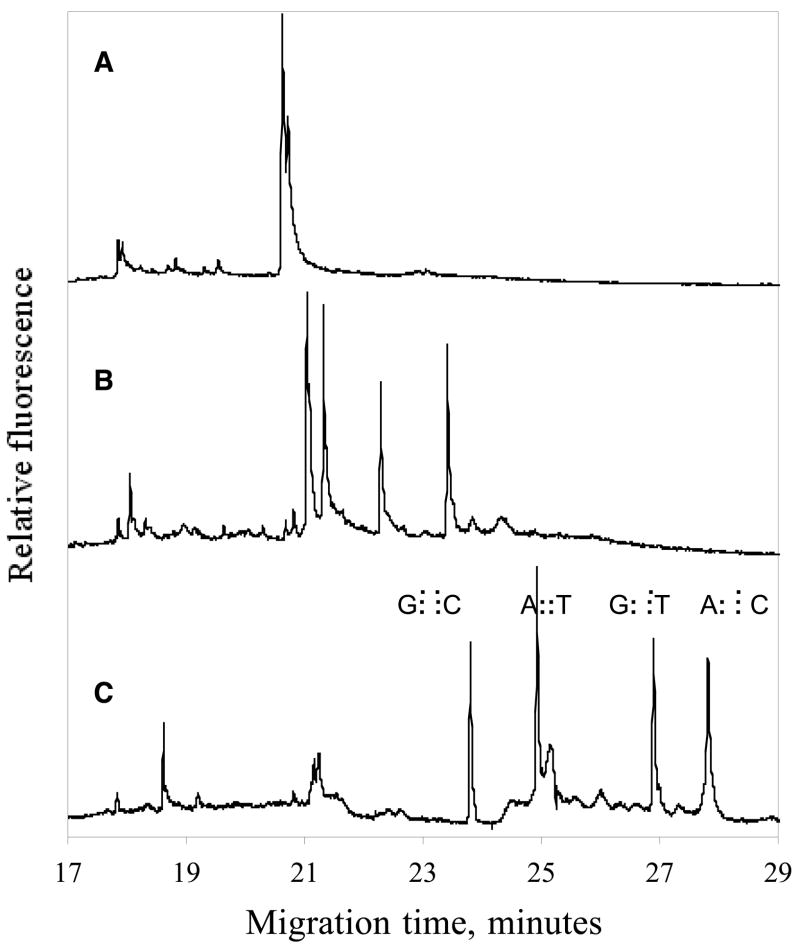
11. Evaluate the electropherogram, determine if the denaturing temperature is appropriate to separate the alleles (figure 9).
Figure 9. Effect on allele separation with increase in denaturing temperature.
Heterozygote sample where re-analyzed at three different CyDCE. With the lowest temperature cycling in the upper electropherogran and the highest denaturing temperature in the lower elecropherogram.
The figure 9 demonstrates the effect of increased alleles separation as increased cycling denaturing temperature is employed. At the lowest temperature setting no allele separation is seen (A). Panel B shows separation of the 4 alleles when the temperature was cycled between 48–45 ºC. However, better separation was obtained when the temperature is cycled between 49–46°C (C).
TIMING
Steps 1–6, is dependent on the personal computer skill, thus estimated time can be from 10 to 30 minutes pr. fragment. However this computer analysis can be automated to accommodate large-scale studies. The time used on step 7 is dependent on DNA amplification instruments and capillary electrophoresis instruments available. But could range from half a day up to a week. Steps 9–11 take about 50 minutes.
ANTICIPATED RESULTS
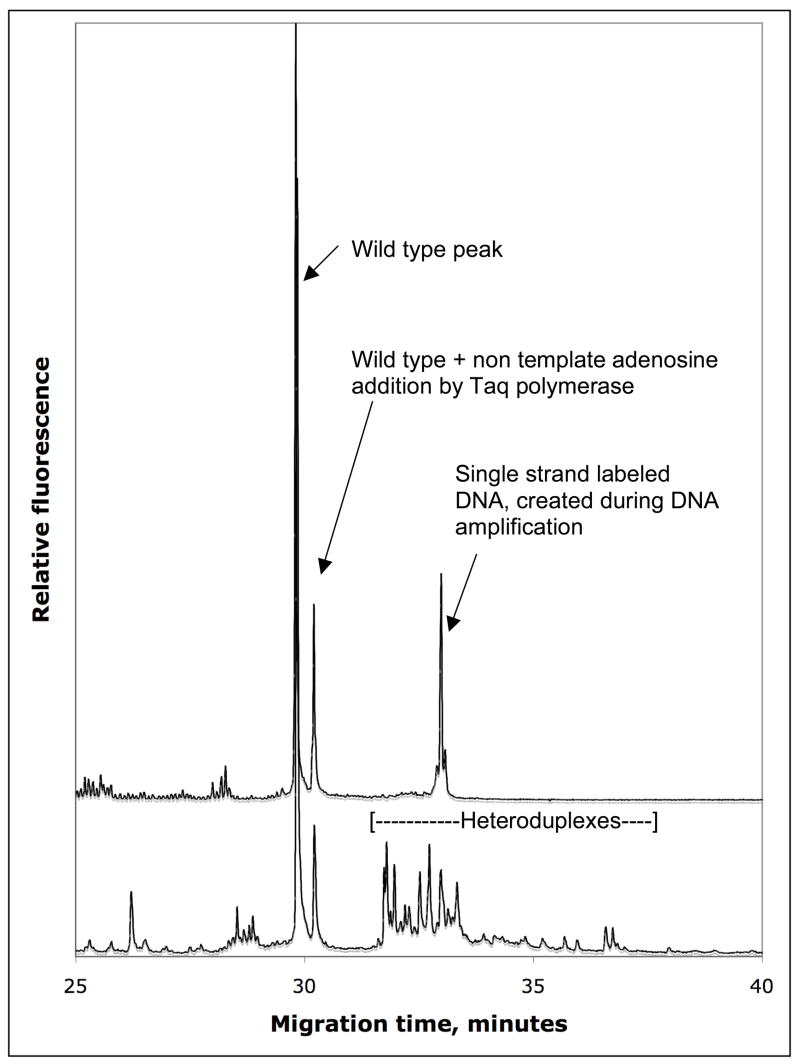
Selection of instrument type is base on the area of research. What are the specific requires, good limit of detection vs. sample throughput. If limit of detection were the main focus then a single capillary system would be the instruments choose. CDCE has a limit of detection down to 10−3 on a regular basis 9, 13, 15, 36, but has been used to study mutant fractions down to 10−6 35, 79. Furthermore, peak collection and enrichment can be performed on the single capillary system 34–37, 63, 70. The figure 10 demonstrates fraction collection of DNA polymerase induced mutation during DNA amplification. Wild type DNA was amplified with Taq DNA polymerase, which has been shown to induce mutants at about 10−5/base pair/doubling 49. After the DNA amplification the total mutant fraction is expect to be about 10−3, which can be divided over several hotspot, bringing the mutant fraction of each mutant down to 10−4. This is below the limit of detection for any mutation detection system. Thus heteroduplex enrichment is needed to visualize the mutants. Consequently the heteroduplex region of the original sample (upper electropherogram) was collected, re-amplified and rerunned by DCE. Now the heterodplexes of the Taq induced mutants are clearly observed (lower electropherogram, figure 10). Based on the area under the wild type and the heteroduplex region, the enrichment archived in this experiment was more than hundred-fold. The limit of detection and the possibility to enrich for mutants make DCE a unique method as compared to dHPLC, high-resolution DNA melting analysis, SSCP/SSCA or heteroduplex analysis where the limit of detection is 10 to 100 fold higher at the best. It should be noted that the quality of the results obtained by using a manual DCE instrument is to some extent is related to the operator’s skills.
Figure 10. Mutant enrichment by fraction collection of the heteroduplex region.
Taq polymerase induced mutants when amplifying wildtype DNA, enriched by fraction collection of the heteroduplex region, followed by re-amplification and separation by CyDEC (lower electropherogram).
For applications where resolution of individual peaks is critical, the efficiency of DCE separation may be further improved. Indeed, there is a trade-off between separation rate and separation efficiency. More precisely, efficiency is limited by the slow kinetics of DNA melting equilibrium 110. Thus increasing the separation time or improving the kinetics of DNA melting/reannealing (which includes increasing cation concentration and/or decreasing denaturant concentration with corresponding increase of the temperature) is expected to improve the resolution 110.
Instruments from Applied biosystems
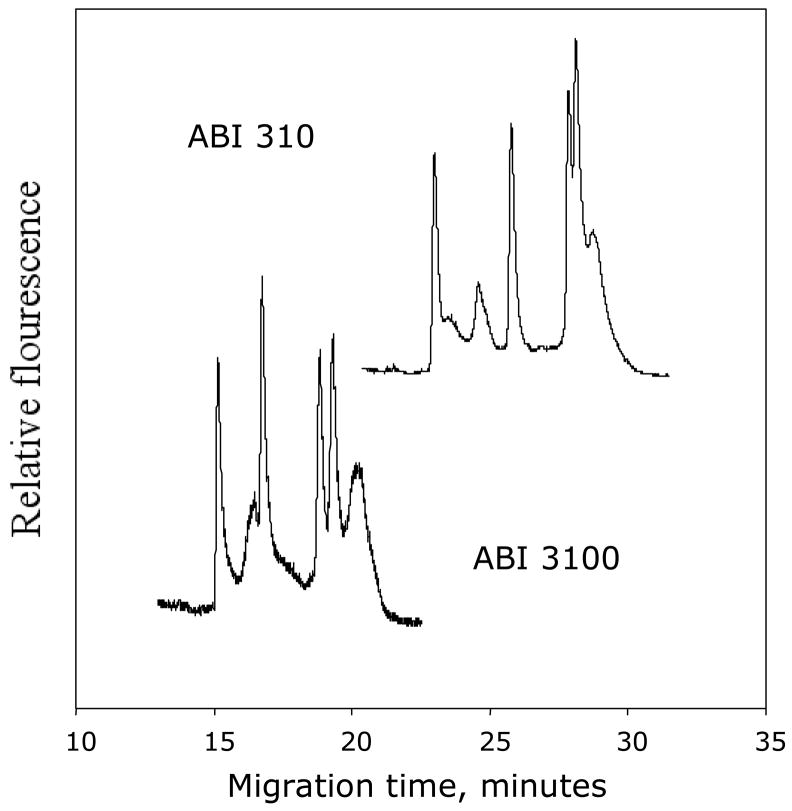
We have tested two different instruments from one of the leading manufactures of capillary DNA sequencing instruments with respect to their ability to separate alleles by DCE 76, 83, 89, 108. By use of standard genotyping or DNA sequencing protocols as given for the instruments manuals, except for the temperature setting, we have been able to automatically separate alleles by DCE on the single capillary instrument ABI 310 and the 16 capillary instrument ABI 3100 (figure 11). Thus DCE become an available method to every lab having accesses to such instruments. Below is representative electropherogram from DCE runs at each instrument. The differences in migration time are due to longer distances from injection point to the detector in the ABI 310. Please note the clear baseline separation between homoduplexes and between homoplexes and heteroduplexes, which are representative for the separation of alleles by DCE. This fare better separation than what is generally observed by dHPLC, SSCP/SSCA and heteroduplex analysis.
Figure 11. Constant denaturant capillary electrophoresis separation of alleles.
Allele separation of heterozygote sample by CDCE in ABI 310 and ABI 3100 DNA sequencing instruments (Applied Biosystems).
Instruments from GE Healthcare, Products for Life Sciences
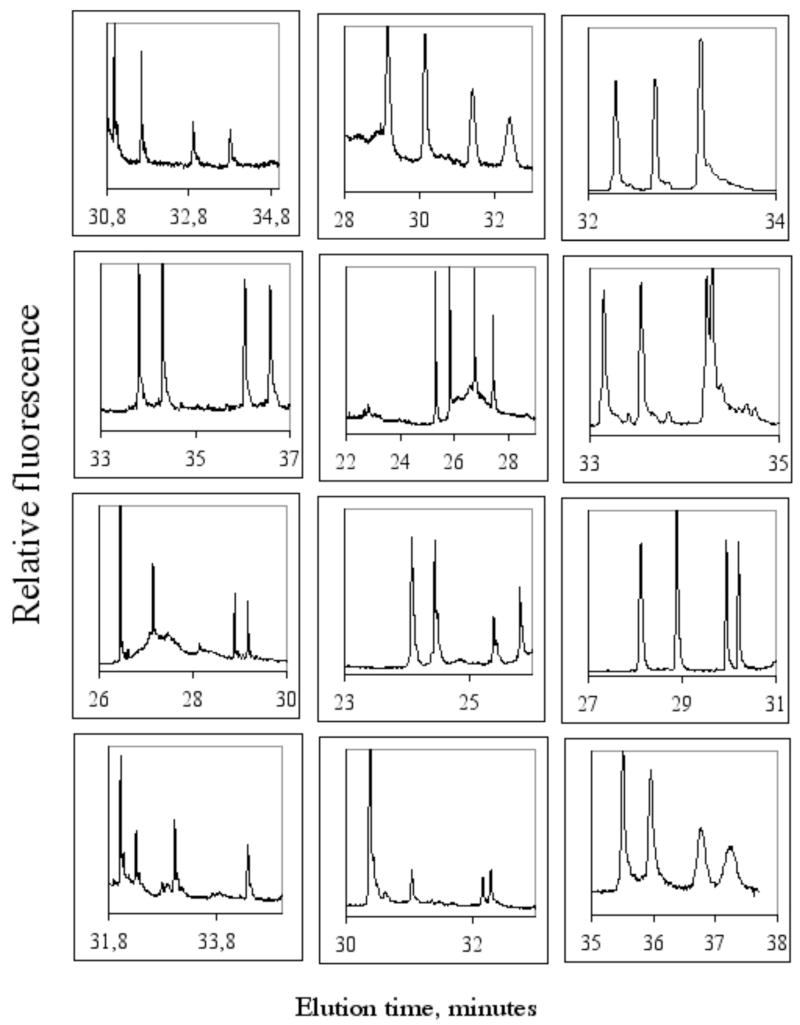
We have tested MegaBACE 500, 1000 and 4000, three different DNA capillary sequencing instruments from Molecular Dynamics, which was quires by Amersham, now part of GE Healthcare. All three instruments were able to separate alleles by DCE. Additionally these instruments facilitate, with minor modification, the use of cycling temperature CE (CyDCE). Additional, mutant enrichment has been performed on the MegaBACE 1000 instruments (data not published, patent pending). But the enrichment archived was somewhat less that what can be archived with single capillary instruments (figure 10). Below is depicted representative electropherograms obtained from twelve different fragments analyzed in the same CyDCE run using a 96 capillary instrument, MegaBACE 1000 (figure 12). The denaturing temperature was cycles going from 59–47ºC in 5 cycles. Please observe the baseline separation between the two homoduplexes and between homoduplexes and heteroduplexes in all electropherograms.
Figure 12. Separation of alleles in 12 different fragment using CyDCE.
Alleles in twelve different heterozygote samples from different fragments were separated in the same electrophoretic run by CyDCE. Running condition is as described elsewhere 26.
Instrument from Beckman Coulter
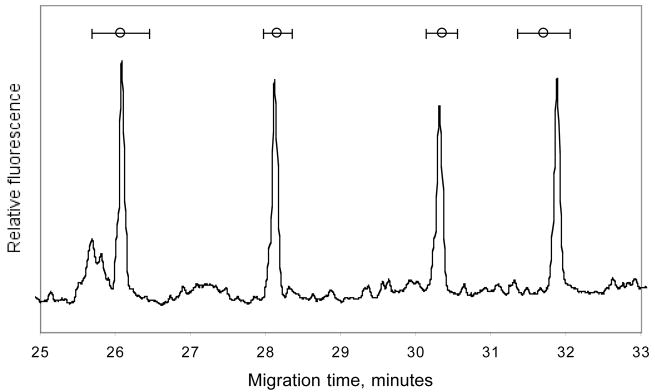
The instrument from Beckman coulter was used to separate alleles in a fragment with a common DNA point variation (NCBI reference number rs261587). The denaturing temperature was set slightly above the theoretical melting temperature. To demonstrate the repeatability of the allele separation, the same sample were analyze 96 times. The error bars shown is one standard deviation of the alleles elution time measured at peakmax from 96 repeated runs. Please note the baseline resolution between homoduplexes (figure 13). The results can be compared with similar results when the same fragment was analyzed 842 times on MegaBACE 1000 instrument 90. These data demonstrates the application of CyDCE on different instruments from different instrument suppliers.
Figure 13. Reproducibility of allele separation by CyDCE.
Alleles separated by DyDCE using standard running conditions (save for the running temperature) on a CEQ 8000 DNA sequencer (Beckman Coulter). Incorporated in the electropherogram is the average peakmax from 96 runs, ± 1 standard deviation.
CONCLUSION
DCE has proven to be an efficient method to investigate mutational spectra in human cells, tissues and populations. The simplicity and the sensitivity of detection of the protocol in the cycling temperature DCE mode should make this method attractive to the broad research community. As the CyDCE mode can be performed on many DNA sequencing instruments, CyDCE is available to most molecular genetics laboratories. Most important, DCE in the cycling temperature mode is adaptable to massively parallel instruments. Such instruments could perform pangenomic exonic scans of large case and control cohorts that we have determined to be necessary discover the genes carrying mutations conferring risk for common diseases and the genes in which somatic mutations are required for clonal diseases such as cancer and atherosclerosis80.
TROUBLESHOOTING
| Step number | Problem | Possible reason | Solution |
|---|---|---|---|
| 1 – 5 | Error in DNA sequence or wrong target sequence |
|
Use more than one data source. Blast the sequence and primers |
| 6 | Primer quality and quantity | Low efficiency when synthesizing the primer, or low labeling efficiency, or both. | Test the labeled primer in the capillary system. Run a primer dilution series to validate the quality. Re order / get new batch / change supplier |
| 7 – 8 | No DNA amplification product |
|
Try different template Check primer sequence information Amplify a different fragment to test DNA amplification components Observe/measure temperature |
| 7 – 8 | Weak DNA amplification product |
|
Analyze primer Re-optimize DNA amplification Try another template |
| 9 – 10 | No allele separation |
|
Increase temperature Use new polymer batch Lower the temperature |
| 9 – 10 | Weak signal |
|
Call service Confirm with user manuals, focus the capillaries Store samples in −20°C See steps 7– 8 Desalt the sample/ dilute 1:10 in H2O Check labeling |
| 9 – 10 | Interfering Single strand DNA |
|
Balance the labeled primer concentration, e.g. 2:1 unlabelled : labeled |
| 9 – 10 | Unstable current/voltage or peak broadening |
|
Replace polymer Centrifuge the polymer Change capillaries or switch to dynamic coating polymer |
| 9 – 10 | To much signal |
|
Reduce gain/voltage Load less Reduce [primer] |
Footnotes
Competing financial interests
The authors declare no competing financial interests. Beckman-Coulter, Inc. has licensed patents for constant temperature DCE technology and related applications from MIT. Drs. Khrapko, Li-Sucholeiki and Thilly as inventors receive a portion of annual royalties.
References
- 1.Watson J, Crick F. Molecular structure of nucleic acids - a structure for deoxyribose nucleic acid. Nature. 1953;171:737–738. doi: 10.1038/171737a0. [DOI] [PubMed] [Google Scholar]
- 2.Benzer S, Freese E. Induction of Specific Mutations with 5-Bromouracil. Proceedings of the National Academy of Sciences of the United States of America. 1958;44:112–119. doi: 10.1073/pnas.44.2.112. [DOI] [PMC free article] [PubMed] [Google Scholar]
- 3.Collins FS, Morgan M, Patrinos A. The Human Genome Project: lessons from large-scale biology. Science (New York, NY. 2003;300:286–290. doi: 10.1126/science.1084564. [DOI] [PubMed] [Google Scholar]
- 4.Venter JC, et al. The sequence of the human genome. Science (New York, N Y. 2001;291:1304–1351. doi: 10.1126/science.1058040. [DOI] [PubMed] [Google Scholar]
- 5.Shendure J, et al. Accurate multiplex polony sequencing of an evolved bacterial genome. Science (New York, NY. 2005;309:1728–1732. doi: 10.1126/science.1117389. [DOI] [PubMed] [Google Scholar]
- 6.Margulies M, et al. Genome sequencing in microfabricated high-density picolitre reactors. Nature. 2005;437:376–380. doi: 10.1038/nature03959. [DOI] [PMC free article] [PubMed] [Google Scholar]
- 7.Hall N. Advanced sequencing technologies and their wider impact in microbiology. J Exp Biol. 2007;210:1518–1525. doi: 10.1242/jeb.001370. [DOI] [PubMed] [Google Scholar]
- 8.Cha RS, Zarbl H, Keohavong P, Thilly WG. Mismatch amplification mutation assay (MAMA): application to the c-H-ras gene. PCR methods and applications. 1992;2:14–20. doi: 10.1101/gr.2.1.14. [DOI] [PubMed] [Google Scholar]
- 9.Bjørheim J, et al. Mutation analyses of KRAS exon 1 comparing three different techniques: temporal temperature gradient electrophoresis, constant denaturant capillary electrophoresis and allele specific polymerase chain reaction. Mutation Research-Fundamental And Molecular Mechanisms Of Mutagenesis. 1998;403:103–112. doi: 10.1016/s0027-5107(98)00057-8. [DOI] [PubMed] [Google Scholar]
- 10.Sudo H, et al. Distributions of five common point mutants in the human tracheal-bronchial epithelium. Mutation research. 2006;596:113–127. doi: 10.1016/j.mrfmmm.2005.12.008. [DOI] [PubMed] [Google Scholar]
- 11.Fischer S, Lumelsky N, Lerman L. Separation of dna fragments differing by single base substitution - application to beta-degrees-thalassemia identification. Dna-a journal of molecular & cellular biology. 1983;2:171–171. [Google Scholar]
- 12.Fischer SG, Lerman LS. DNA fragments differing by single base-pair substitutions are separated in denaturing gradient gels: correspondence with melting theory. Proceedings of the National Academy of Sciences of the United States of America. 1983;80:1579–1583. doi: 10.1073/pnas.80.6.1579. [DOI] [PMC free article] [PubMed] [Google Scholar]
- 13.Ekstrøm PO, Børresen-Dayle AL, Qvist H, Giercksky KE, Thilly WG. Detection of low-frequency mutations in exon 8 of the TP53 gene by constant denaturant capillary electrophoresis (CDCE) Biotechniques. 1999;27:128-+. doi: 10.2144/99271rr01. [DOI] [PubMed] [Google Scholar]
- 14.Kumar R, et al. Separation of transforming amino acid-substituting mutations in codons 12, 13 and 61 the N-ras gene by constant denaturant capillary electrophoresis (CDCE) Carcinogenesis. 1995;16:2667–2673. doi: 10.1093/carcin/16.11.2667. [DOI] [PubMed] [Google Scholar]
- 15.Khrapko K, et al. Constant denaturant capillary electrophoresis (CDCE): a high resolution approach to mutational analysis. Nucleic acids research. 1994;22:364–369. doi: 10.1093/nar/22.3.364. [DOI] [PMC free article] [PubMed] [Google Scholar]
- 16.Fodde R, Losekoot M. Mutation detection by denaturing gradient gel electrophoresis (DGGE) Human Mutation. 1994;3:83–94. doi: 10.1002/humu.1380030202. [DOI] [PubMed] [Google Scholar]
- 17.Smith-Sørensen B, Hovig E, Andersson B, Børresen AL. Screening for mutations in human HPRT cDNA using the polymerase chain reaction (PCR) in combination with constant denaturant gel electrophoresis (CDGE) Mutation research. 1992;269:41–53. doi: 10.1016/0027-5107(92)90159-y. [DOI] [PubMed] [Google Scholar]
- 18.Hovig E, Smith-Sørensen B, Uitterlinden AG, Børresen AL. Detection of DNA variation in cancer. Pharmacogenetics. 1992;2:317–328. doi: 10.1097/00008571-199212000-00011. [DOI] [PubMed] [Google Scholar]
- 19.Børresen AL, et al. Constant denaturant gel electrophoresis as a rapid screening technique for p53 mutations. Proceedings of the National Academy of Sciences of the United States of America. 1991;88:8405–8409. doi: 10.1073/pnas.88.19.8405. [DOI] [PMC free article] [PubMed] [Google Scholar]
- 20.Poland D. Recursion relation generation of probability profiles for specific-sequence macromolecules with long-range correlations. Biopolymers. 1974;13:1859–1871. doi: 10.1002/bip.1974.360130916. [DOI] [PubMed] [Google Scholar]
- 21.Gotoh O. Prediction of melting profiles and local helix stability for sequenced DNA. Advances in biophysics. 1983;16:1–52. doi: 10.1016/0065-227x(83)90007-2. [DOI] [PubMed] [Google Scholar]
- 22.Gotoh O, Tagashira Y. Locations of frequently opening regions on natural DNAs and their relation to functional loci. Biopolymers. 1981;20:1043–1058. doi: 10.1002/bip.1981.360200514. [DOI] [PubMed] [Google Scholar]
- 23.Tachibana H, Gotoh O, Wada A. High resolution thermal melting studies of DNA. Progress in clinical and biological research. 1981;64:299–313. [PubMed] [Google Scholar]
- 24.Poland D. DNA probability profiles: examples from the Treponema pallidum genome. Biophysical Chemistry. 2003;104:279–289. doi: 10.1016/s0301-4622(02)00382-4. [DOI] [PubMed] [Google Scholar]
- 25.Liu F, et al. The human genomic melting map. PLoS computational biology. 2007;3:e93. doi: 10.1371/journal.pcbi.0030093. [DOI] [PMC free article] [PubMed] [Google Scholar]
- 26.Ekstrøm PO, Bjørheim J, Thilly WG. Technology to accelerate pangenomic scanning for unknown point mutations in exonic sequences: cycling temperature capillary electrophoresis (CTCE) BMC Genet. 2007;8:54. doi: 10.1186/1471-2156-8-54. [DOI] [PMC free article] [PubMed] [Google Scholar]
- 27.Fischer SG, Lerman LS. Separation of random fragments of DNA according to properties of their sequences. Proceedings of the National Academy of Sciences of the United States of America. 1980;77:4420–4424. doi: 10.1073/pnas.77.8.4420. [DOI] [PMC free article] [PubMed] [Google Scholar]
- 28.Thilly WG. Potential use of gradient denaturing gel electrophoresis in obtaining mutational spectra from human cells. Carcinog Compr Surv. 1985;10:511–528. [PubMed] [Google Scholar]
- 29.Cariello NF, Scott JK, Kat AG, Thilly WG, Keohavong P. Resolution of a missense mutant in human genomic DNA by denaturing gradient gel electrophoresis and direct sequencing using in vitro DNA amplification: HPRT Munich. American journal of human genetics. 1988;42:726–734. [PMC free article] [PubMed] [Google Scholar]
- 30.Hovig E, Smith-Sørensen B, Brøgger A, Børresen AL. Constant denaturant gel electrophoresis, a modification of denaturing gradient gel electrophoresis, in mutation detection. Mutation research. 1991;262:63–71. doi: 10.1016/0165-7992(91)90108-g. [DOI] [PubMed] [Google Scholar]
- 31.Ruiz-Martinez MC, et al. DNA sequencing by capillary electrophoresis with replaceable linear polyacrylamide and laser-induced fluorescence detection. Analytical chemistry. 1993;65:2851–2858. doi: 10.1021/ac00068a023. [DOI] [PubMed] [Google Scholar]
- 32.Pariat YF, et al. Separation of DNA fragments by capillary electrophoresis using replaceable linear polyacrylamide matrices. J Chromatogr A. 1993;652:57–66. doi: 10.1016/0021-9673(93)80645-O. [DOI] [PubMed] [Google Scholar]
- 33.Piggee CA, Muth J, Carrilho E, Karger BL. Capillary electrophoresis for the detection of known point mutations by single-nucleotide primer extension and laser-induced fluorescence detection. J Chromatogr A. 1997;781:367–375. doi: 10.1016/s0021-9673(97)00637-7. [DOI] [PubMed] [Google Scholar]
- 34.Tomita-Mitchell A, et al. Mismatch repair deficient human cells: spontaneous and MNNG-induced mutational spectra in the HPRT gene. Mutation research. 2000;450:125–138. doi: 10.1016/s0027-5107(00)00020-8. [DOI] [PubMed] [Google Scholar]
- 35.Li-Sucholeiki XC, Thilly WG. A sensitive scanning technology for low frequency nuclear point mutations in human genomic DNA. Nucleic acids research. 2000;28:E44. doi: 10.1093/nar/28.9.e44. [DOI] [PMC free article] [PubMed] [Google Scholar]
- 36.Li-Sucholeiki XC, et al. Applications of constant denaturant capillary electrophoresis/high-fidelity polymerase chain reaction to human genetic analysis. Electrophoresis. 1999;20:1224–1232. doi: 10.1002/(SICI)1522-2683(19990101)20:6<1224::AID-ELPS1224>3.0.CO;2-O. [DOI] [PubMed] [Google Scholar]
- 37.Ekstrøm PO, Wasserkort R, Minarik M, Foret F, Thilly WG. Two-point fluorescence detection and automated fraction collection applied to constant denaturant capillary electrophoresis. Biotechniques. 2000;29:582-+. doi: 10.2144/00293rr01. [DOI] [PubMed] [Google Scholar]
- 38.Khrapko K, et al. Mitochondrial mutational spectra in human cells and tissues. Proceedings of the National Academy of Sciences of the United States of America. 1997;94:13798–13803. doi: 10.1073/pnas.94.25.13798. [DOI] [PMC free article] [PubMed] [Google Scholar]
- 39.Coller HA, et al. Mutational spectra of a 100-base pair mitochondrial DNA target sequence in bronchial epithelial cells: a comparison of smoking and nonsmoking twins. Cancer research. 1998;58:1268–1277. [PubMed] [Google Scholar]
- 40.Saiki RK, et al. Enzymatic amplification of beta-globin genomic sequences and restriction site analysis for diagnosis of sickle cell anemia. Science (New York, NY. 1985;230:1350–1354. doi: 10.1126/science.2999980. [DOI] [PubMed] [Google Scholar]
- 41.Kleppe K, Ohtsuka E, Kleppe R, Molineux I, Khorana H. Studies on polynucleotides.96. Repair replication of short synthetic dnas as catalyzed by dna polymerases. Journal of molecular biology. 1971;56:341-&. doi: 10.1016/0022-2836(71)90469-4. [DOI] [PubMed] [Google Scholar]
- 42.Bessman MJ, Muzyczka N, Goodman MF, Schnaar RL. Studies on the biochemical basis of spontaneous mutation. II. The incorporation of a base and its analogue into DNA by wild-type, mutator and antimutator DNA polymerases. Journal of molecular biology. 1974;88:409–421. doi: 10.1016/0022-2836(74)90491-4. [DOI] [PubMed] [Google Scholar]
- 43.Goodman MF, Bessman MJ, Bachur NR. Adriamycin and daunorubicin inhibition of mutant T4 DNA polymerases. Proceedings of the National Academy of Sciences of the United States of America. 1974;71:1193–1196. doi: 10.1073/pnas.71.4.1193. [DOI] [PMC free article] [PubMed] [Google Scholar]
- 44.Goodman MF, Gore WC, Muzyczka N, Bessman MJ. Studies on the biochemical basis of spontaneous mutation. III. Rate model for DNA polymerase-effected nucleotide misincorporation. Journal of molecular biology. 1974;88:243–235. doi: 10.1016/0022-2836(74)90492-6. [DOI] [PubMed] [Google Scholar]
- 45.Kunkel TA, Loeb LA, Goodman MF. On the fidelity of DNA replication. The accuracy of T4 DNA polymerases in copying phi X174 DNA in vitro. The Journal of biological chemistry. 1984;259:1539–1545. [PubMed] [Google Scholar]
- 46.Pless RC, Bessman MJ. Influence of local nucleotide sequence on substitution of 2-aminopurine for adenine during deoxyribonucleic acid synthesis in vitro. Biochemistry. 1983;22:4905–4915. doi: 10.1021/bi00290a006. [DOI] [PubMed] [Google Scholar]
- 47.Keohavong P, Kat AG, Cariello NF, Thilly WG. DNA amplification in vitro using T4 DNA polymerase. DNA (Mary Ann Liebert, Inc. 1988;7:63–70. doi: 10.1089/dna.1988.7.63. [DOI] [PubMed] [Google Scholar]
- 48.Kat AG, Thilly WG. Mutational spectra of endogenous genes in mammalian cells. IARC scientific publications. 1994:371–383. [PubMed] [Google Scholar]
- 49.Keohavong P, Thilly WG. Fidelity of DNA polymerases in DNA amplification. Proceedings of the National Academy of Sciences of the United States of America. 1989;86:9253–9257. doi: 10.1073/pnas.86.23.9253. [DOI] [PMC free article] [PubMed] [Google Scholar]
- 50.Cariello NF, Thilly WG, Swenberg JA, Skopek TR. Deletion mutagenesis during polymerase chain reaction: dependence on DNA polymerase. Gene. 1991;99:105–108. doi: 10.1016/0378-1119(91)90040-i. [DOI] [PubMed] [Google Scholar]
- 51.Keohavong P, Wang CC, Cha RS, Thilly WG. Enzymatic amplification and characterization of large DNA fragments from genomic DNA. Gene. 1988;71:211–216. doi: 10.1016/0378-1119(88)90094-7. [DOI] [PubMed] [Google Scholar]
- 52.Ling LL, Keohavong P, Dias C, Thilly WG. Optimization of the polymerase chain reaction with regard to fidelity: modified T7, Taq, and vent DNA polymerases. PCR methods and applications. 1991;1:63–69. doi: 10.1101/gr.1.1.63. [DOI] [PubMed] [Google Scholar]
- 53.Thilly WG, et al. Direct measurement of mutational spectra in humans. Genome / National Research Council Canada = Genome / Conseil national de recherches Canada. 1989;31:590–593. doi: 10.1139/g89-109. [DOI] [PubMed] [Google Scholar]
- 54.Andre P, Kim A, Khrapko K, Thilly WG. Fidelity and mutational spectrum of Pfu DNA polymerase on a human mitochondrial DNA sequence. Genome research. 1997;7:843–852. doi: 10.1101/gr.7.8.843. [DOI] [PMC free article] [PubMed] [Google Scholar]
- 55.Khrapko K, Coller HA, Hanekamp JS, Thilly WG. Identification of point mutations in mixtures by capillary electrophoresis hybridization. Nucleic acids research. 1998;26:5738–5740. doi: 10.1093/nar/26.24.5738. [DOI] [PMC free article] [PubMed] [Google Scholar]
- 56.Khrapko K, et al. Mutational spectrometry without phenotypic selection: human mitochondrial DNA. Nucleic acids research. 1997;25:685–693. doi: 10.1093/nar/25.4.685. [DOI] [PMC free article] [PubMed] [Google Scholar]
- 57.Khrapko K, Coller HA, Li-Sucholeiki XC, Andre PC, Thilly WG. High resolution analysis of point mutations by constant denaturant capillary electrophoresis (CDCE) Methods in molecular biology (Clifton, NJ. 2001;163:57–72. doi: 10.1385/1-59259-116-7:57. [DOI] [PubMed] [Google Scholar]
- 58.Marcelino LA, et al. Chemically induced mutations in mitochondrial DNA of human cells: mutational spectrum of N-methyl-N’-nitro-N-nitrosoguanidine. Cancer research. 1998;58:2857–2862. [PubMed] [Google Scholar]
- 59.Zheng W, Khrapko K, Coller HA, Thilly WG, Copeland WC. Origins of human mitochondrial point mutations as DNA polymerase gamma-mediated errors. Mutation research. 2006;599:11–20. doi: 10.1016/j.mrfmmm.2005.12.012. [DOI] [PubMed] [Google Scholar]
- 60.Coller HA, et al. High frequency of homoplasmic mitochondrial DNA mutations in human tumors can be explained without selection. Nature genetics. 2001;28:147–150. doi: 10.1038/88859. [DOI] [PubMed] [Google Scholar]
- 61.Coller HA, et al. Clustering of mutant mitochondrial DNA copies suggests stem cells are common in human bronchial epithelium. Mutation research. 2005;578:256–271. doi: 10.1016/j.mrfmmm.2005.05.014. [DOI] [PubMed] [Google Scholar]
- 62.Marcelino LA, Thilly WG. Mitochondrial mutagenesis in human cells and tissues. Mutation research. 1999;434:177–203. doi: 10.1016/s0921-8777(99)00028-2. [DOI] [PubMed] [Google Scholar]
- 63.Zheng W, Marcelino LA, Thilly WG. Scanning low-frequency point mutants in the mitochondrial genome using constant denaturant capillary electrophoresis. Methods in molecular biology (Clifton, NJ. 2002;197:93–106. doi: 10.1385/1-59259-284-8:093. [DOI] [PubMed] [Google Scholar]
- 64.Oller AR, Thilly WG. Mutational spectra in human B-cells. Spontaneous, oxygen and hydrogen peroxide-induced mutations at the hprt gene. Journal of molecular biology. 1992;228:813–826. doi: 10.1016/0022-2836(92)90866-i. [DOI] [PubMed] [Google Scholar]
- 65.Cariello NF, Keohavong P, Kat AG, Thilly WG. Molecular analysis of complex human cell populations: mutational spectra of MNNG and ICR-191. Mutation research. 1990;231:165–176. doi: 10.1016/0027-5107(90)90023-w. [DOI] [PubMed] [Google Scholar]
- 66.Chen J, Thilly WG. Mutational spectrum of chromium(VI) in human cells. Mutation research. 1994;323:21–27. doi: 10.1016/0165-7992(94)90040-x. [DOI] [PubMed] [Google Scholar]
- 67.Chen J, Thilly WG. Mutational spectra vary with exposure conditions: benzo[a]pyrene in human cells. Mutation research. 1996;357:209–217. doi: 10.1016/0027-5107(96)00107-8. [DOI] [PubMed] [Google Scholar]
- 68.Hemminki K, Thilly WG. IARC scientific publications. 2004. Implications of results of molecular epidemiology on DNA adducts, their repair and mutations for mechanisms of human cancer; pp. 217–235. [PubMed] [Google Scholar]
- 69.Singer S, et al. 13C- and 31P-NMR studies of human colon cancer in-vitro and in-vivo. Surgical oncology. 1993;2:7–18. doi: 10.1016/0960-7404(93)90039-2. [DOI] [PubMed] [Google Scholar]
- 70.Muniappan BP, Thilly WG. The DNA polymerase beta replication error spectrum in the adenomatous polyposis coli gene contains human colon tumor mutational hotspots. Cancer research. 2002;62:3271–3275. [PubMed] [Google Scholar]
- 71.Chen J, Thilly WG. Use of denaturing-gradient gel electrophoresis to study chromium-induced point mutations in human cells. Environmental health perspectives. 1994;102 (Suppl 3):227–229. doi: 10.1289/ehp.94102s3227. [DOI] [PMC free article] [PubMed] [Google Scholar]
- 72.Keohavong P, Thilly WG. Determination of point mutational spectra of benzo[a]pyrene-diol epoxide in human cells. Environmental health perspectives. 1992;98:215–219. doi: 10.1289/ehp.9298215. [DOI] [PMC free article] [PubMed] [Google Scholar]
- 73.Bjørheim J, Ekstrøm PO, Fossberg E, Børresen-Dale AL, Gaudernack G. Automated constant denaturant capillary electrophoresis applied for detection of KRAS exon 1 mutations. Biotechniques. 2001;30:972–975. doi: 10.2144/01305st01. [DOI] [PubMed] [Google Scholar]
- 74.Bjørheim J, Gaudernack G, Giercksky KE, Ekstrøm PO. Direct identification of all oncogenic mutants in KRAS exon 1 by cycling temperature capillary electrophoresis. Electrophoresis. 2003;24:63–69. doi: 10.1002/elps.200390032. [DOI] [PubMed] [Google Scholar]
- 75.Ekstrøm PO, Bjørheim J. Evaluation of sieving matrices used to separate alleles by cycling temperature capillary electrophoresis. Electrophoresis. 2006;27:1878–1885. doi: 10.1002/elps.200500642. [DOI] [PubMed] [Google Scholar]
- 76.Ekstrøm PO, Bjørheim J, Gaudernack G, Giercksky KE. Population screening of single-nucleotide polymorphisms exemplified by analysis of 8000 alleles. Journal Of Biomolecular Screening. 2002;7:501–506. doi: 10.1177/1087057102238623. [DOI] [PubMed] [Google Scholar]
- 77.Tomita-Mitchell A, Muniappan BP, Herrero-Jimenez P, Zarbl H, Thilly WG. Single nucleotide polymorphism spectra in newborns and centenarians: identification of genes coding for rise of mortal disease. Gene. 1998;223:381–391. doi: 10.1016/s0378-1119(98)00408-9. [DOI] [PubMed] [Google Scholar]
- 78.Li-Sucholeiki XC, Hu G, Perls T, Tomita-Mitchell A, Thilly WG. Scanning the beta-globin gene for mutations in large populations by denaturing capillary and gel electrophoresis. Electrophoresis. 2005;26:2531–2538. doi: 10.1002/elps.200410431. [DOI] [PubMed] [Google Scholar]
- 79.Li-Sucholeiki XC, et al. Detection and frequency estimation of rare variants in pools of genomic DNA from large populations using mutational spectrometry. Mutation research. 2005;570:267–280. doi: 10.1016/j.mrfmmm.2004.11.004. [DOI] [PubMed] [Google Scholar]
- 80.Morgenthaler S, Thilly WG. A strategy to discover genes that carry multi-allelic or mono-allelic risk for common diseases: A cohort allelic sums test (CAST) Mutation research. 2007;615:28–56. doi: 10.1016/j.mrfmmm.2006.09.003. [DOI] [PubMed] [Google Scholar]
- 81.Bjørheim J, Minarik M, Gaudernack G, Ekstrøm PO. Evaluation of denaturing conditions in analysis of DNA variants applied to multi-capillary electrophoresis instruments. Journal Of Separation Science. 2003;26:1163–1168. [Google Scholar]
- 82.Hinselwood DC, Abrahamsen TW, Ekstrøm PO. BRAF mutation detection and identification by cycling temperature capillary electrophoresis. Electrophoresis. 2005;26:2553–2561. doi: 10.1002/elps.200410427. [DOI] [PubMed] [Google Scholar]
- 83.Hinselwood DC, Warren DJ, Ekstrøm PO. High-throughput gender determination using automated denaturant gel capillary electrophoresis. Electrophoresis. 2005;26:2562–2566. doi: 10.1002/elps.200410392. [DOI] [PubMed] [Google Scholar]
- 84.Kristensen AT, Bjørheim J, Wiig J, Giercksky KE, Ekstrøm PO. DNA variants in the ATM gene are not associated with sporadic rectal cancer in a Norwegian population-based study. International Journal Of Colorectal Disease. 2004;19:49–54. doi: 10.1007/s00384-003-0519-7. [DOI] [PubMed] [Google Scholar]
- 85.Cavalli-Sforza LaB. In: WF in The genetics of human population. Kennedy DaPRB., editor. Vol. 124. W.H.Freeman and company; San Francisco: 1971. [Google Scholar]
- 86.Tøstesen E. Partly melted DNA conformations obtained with a probability peak finding method. Phys Rev E Stat Nonlin Soft Matter Phys. 2005;71:061922. doi: 10.1103/PhysRevE.71.061922. [DOI] [PubMed] [Google Scholar]
- 87.Fixman M, Freire JJ. Theory of DNA melting curves. Biopolymers. 1977;16:2693–2704. doi: 10.1002/bip.1977.360161209. [DOI] [PubMed] [Google Scholar]
- 88.Steger G. Thermal denaturation of double-stranded nucleic acids: prediction of temperatures critical for gradient gel electrophoresis and polymerase chain reaction. Nucleic acids research. 1994;22:2760–2768. doi: 10.1093/nar/22.14.2760. [DOI] [PMC free article] [PubMed] [Google Scholar]
- 89.Bjørheim J, Abrahamsen TW, Kristensen AT, Gaudernack G, Ekstrøm PO. Approach to analysis of single nucleotide polymorphisms by automated constant denaturant capillary electrophoresis. Mutation Research-Fundamental And Molecular Mechanisms Of Mutagenesis. 2003;526:75–83. doi: 10.1016/s0027-5107(03)00033-2. [DOI] [PubMed] [Google Scholar]
- 90.Bjørheim J, Ekstrøm PO. Review of denaturant capillary electrophoresis in DNA variation analysis. Electrophoresis. 2005;26:2520–2530. doi: 10.1002/elps.200410403. [DOI] [PubMed] [Google Scholar]
- 91.Bjørheim J, Gaudernack G, Ekstrøm PO. Melting gel techniques in single nucleotide polymorphism and mutation detection: From theory to automation. Journal Of Separation Science. 2002;25:637–647. [Google Scholar]
- 92.Myers RM, Fischer SG, Lerman LS, Maniatis T. Nearly all single base substitutions in DNA fragments joined to a GC-clamp can be detected by denaturing gradient gel electrophoresis. Nucleic acids research. 1985;13:3131–3145. doi: 10.1093/nar/13.9.3131. [DOI] [PMC free article] [PubMed] [Google Scholar]
- 93.Myers RM, Fischer SG, Maniatis T, Lerman LS. Modification of the melting properties of duplex DNA by attachment of a GC-rich DNA sequence as determined by denaturing gradient gel electrophoresis. Nucleic acids research. 1985;13:3111–3129. doi: 10.1093/nar/13.9.3111. [DOI] [PMC free article] [PubMed] [Google Scholar]
- 94.Kim AS, Thilly WG. Ligation of high-melting-temperature ‘clamp’ sequence extends the scanning range of rare point-mutational analysis by constant denaturant capillary electrophoresis (CDCE) to most of the human genome. Nucleic acids research. 2003;31:e97. doi: 10.1093/nar/gng099. [DOI] [PMC free article] [PubMed] [Google Scholar]
- 95.Aguilera A, Gomez F, Lospitao E, Amils R. A molecular approach to the characterization of the eukaryotic communities of an extreme acidic environment: methods for DNA extraction and denaturing gradient gel electrophoresis analysis. Systematic and applied microbiology. 2006;29:593–605. doi: 10.1016/j.syapm.2006.01.006. [DOI] [PubMed] [Google Scholar]
- 96.Cao W, Hashibe M, Rao JY, Morgenstern H, Zhang ZF. Comparison of methods for DNA extraction from paraffin-embedded tissues and buccal cells. Cancer detection and prevention. 2003;27:397–404. doi: 10.1016/s0361-090x(03)00103-x. [DOI] [PubMed] [Google Scholar]
- 97.Dedhia P, Tarale S, Dhongde G, Khadapkar R, Das B. Evaluation of DNA extraction methods and real time PCR optimization on formalin-fixed paraffin-embedded tissues. Asian Pac J Cancer Prev. 2007;8:55–59. [PubMed] [Google Scholar]
- 98.Fredricks DN, Smith C, Meier A. Comparison of six DNA extraction methods for recovery of fungal DNA as assessed by quantitative PCR. Journal of clinical microbiology. 2005;43:5122–5128. doi: 10.1128/JCM.43.10.5122-5128.2005. [DOI] [PMC free article] [PubMed] [Google Scholar]
- 99.McOrist AL, Jackson M, Bird AR. A comparison of five methods for extraction of bacterial DNA from human faecal samples. Journal of microbiological methods. 2002;50:131–139. doi: 10.1016/s0167-7012(02)00018-0. [DOI] [PubMed] [Google Scholar]
- 100.Mohlenhoff P, Muller L, Gorbushina AA, Petersen K. Molecular approach to the characterisation of fungal communities: methods for DNA extraction, PCR amplification and DGGE analysis of painted art objects. FEMS microbiology letters. 2001;195:169–173. doi: 10.1111/j.1574-6968.2001.tb10516.x. [DOI] [PubMed] [Google Scholar]
- 101.Sato Y, et al. Comparison of the DNA extraction methods for polymerase chain reaction amplification from formalin-fixed and paraffin-embedded tissues. Diagn Mol Pathol. 2001;10:265–271. doi: 10.1097/00019606-200112000-00009. [DOI] [PubMed] [Google Scholar]
- 102.Suenaga E, Nakamura H. Evaluation of three methods for effective extraction of DNA from human hair. Journal of chromatography. 2005;820:137–141. doi: 10.1016/j.jchromb.2004.11.028. [DOI] [PubMed] [Google Scholar]
- 103.Yang Zh H, Xiao Y, Zeng GM, Xu Zh Y, Liu Y. Comparison of methods for total community DNA extraction and purification from compost. Applied microbiology and biotechnology. 2007;74:918–925. doi: 10.1007/s00253-006-0704-z. [DOI] [PubMed] [Google Scholar]
- 104.Mullis K, et al. Specific enzymatic amplification of DNA in vitro: the polymerase chain reaction. Cold Spring Harb Symp Quant Biol. 1986;51(Pt 1):263–273. doi: 10.1101/sqb.1986.051.01.032. [DOI] [PubMed] [Google Scholar]
- 105.Kristensen AT, Bjørheim J, Ekstrøm PO. Detection of mutations in exon 8 of TP53 by temperature gradient 96-capillary array electrophoresis. Biotechniques. 2002;33:650–653. doi: 10.2144/02333pf01. [DOI] [PubMed] [Google Scholar]
- 106.Lind H, et al. Frequency of TP53 mutations in relation to Arg72Pro genotypes in non small cell lung cancer. Cancer Epidemiol Biomarkers Prev. 2007;16:2077–2081. doi: 10.1158/1055-9965.EPI-07-0153. [DOI] [PubMed] [Google Scholar]
- 107.Lorentzen AR, et al. Lack of association with the CD28/CTLA4/ICOS gene region among Norwegian multiple sclerosis patients. Journal of neuroimmunology. 2005;166:197–201. doi: 10.1016/j.jneuroim.2005.06.002. [DOI] [PubMed] [Google Scholar]
- 108.Bjørheim J, Gaudernack G, Ekstrøm PO. Mutation analysis of TP53 exons 5–8 by automated constant denaturant capillary electrophoresis. Tumor Biology. 2001;22:323–327. doi: 10.1159/000050634. [DOI] [PubMed] [Google Scholar]
- 109.Bjørheim J, Minarik M, Gaudernack G, Ekstrøm PO. Mutation detection in KRAS exon 1 by constant denaturant capillary electrophoresis in 96 parallel capillaries. Analytical Biochemistry. 2002;304:200–205. doi: 10.1006/abio.2002.5629. [DOI] [PubMed] [Google Scholar]
- 110.Khrapko K, Coller H, Thilly W. Efficiency of separation of DNA mutations by constant denaturant capillary electrophoresis is controlled by the kinetics of DNA melting equilibrium. Electrophoresis. 1996;17:1867–1874. doi: 10.1002/elps.1150171211. [DOI] [PubMed] [Google Scholar]


