Abstract
One controversial area in protein folding mechanisms is whether some small, ultra-fast-folding proteins exist in distinct native and denatured state ensembles, separated by an energy barrier, or if there is a continuum of states between native and denatured. In theory, the simplest way of distinguishing between single-state barrierless or “downhill” folding and conventional separate state folding is by single-molecule spectroscopy, which can detect either distinct populations of proteins or a continuum. But, the time resolution of approximately 1 ms of most confocal fluorescence microscopes for single-molecule fluorescence resonance energy transfer (SM-FRET) is longer than that for the structural relaxation of proteins such as BBL, whose mechanism of folding is controversial. We have constructed a highly sensitive confocal fluorescence microscope and measured the distribution of FRET efficiencies of appropriately labeled BBL in time bins of 50 and 200 μs under conditions in which its structural relaxation time is 340 μs or less. The experiments are at the very limits of detection because of signal artefacts from shot noise, photo-bleaching, and other events that broaden signals of individual states so they appear to coalesce. However, with appropriate tuning of the thresholds for detection and length of data collection, we clearly observed 2 distinct states of BBL, with FRET efficiencies corresponding to native and denatured states. The population of each state varied with GdmCl or urea during chemical denaturation transitions corresponding to conventional barrier-limited folding at 279 K and pH 7 and pH 5.8. The folding of BBL is accordingly barrier limited.
Keywords: downhill, protein a
Classical studies on protein folding invoke separate native (N) and denatured (D) and intermediate states as ensembles of structures in energy wells separated by energy barriers. But this “chemical” viewpoint has been challenged by the hypothesis of unimodal “downhill” folding in which there is only one ensemble of structures present under all conditions, with properties intermediate between D and N states according to conditions (1–5). The key protein in the unimodal hypothesis is BBL, a member of the peripheral subunit binding domain family, which is claimed to be a global downhill folder based especially on the dispersion of melting temperature for individual residues (2). It is extremely difficult to falsify unimodal folding because most equilibrium and kinetic data can be interpreted by numerous alternative mechanisms, especially when the rate of interconversion of D and N states is on a faster time scale than that of observation (6). The dependence of rates of folding and unfolding on denaturant concentration is good evidence for the nature of the mechanism—classical chevron plots with a steep limb are compatible with only a folding scenario with a free energy barrier and a transition state, so there is a significant change of solvent-accessible surface between the ground and transition states (6–8). That evidence combined with a rationalization of the anomalous behavior of BBL has been used as evidence that the folding of BBL can be accommodated by a barrier limited folding model, with some heterogeneity of the native state (9–12). Direct observation of distinct states of BBL in the transition region at equilibrium would provide compelling evidence for barrier limited folding (6, 13). The current method of choice is single-molecule fluorescence resonance energy transfer (SM-FRET) experiments, which has been widely applied in the studies of protein folding, structure, and function, and is especially useful in detection of heterogeneity of populations (14–21).
We have applied SM-FRET to the B-domain of Protein A (BDPA) and directly observed the denatured and native states of this protein in its transition region (6), the signature of barrier-limited folding. We were not able to use SM-FRET to resolve unambiguously the folding mechanism of BBL because it folds in a fraction of a millisecond at room temperature, whereas the typical time resolution of SM-FRET was, until very recently, typically 1 ms (6, 21, 22), in which time BBL would rapidly equilibrate and appear as a time-averaged structure of the separate states if it folds by a barrier limited transition (23, 24). Here we study the folding of the protein by using improved equipment that allows study in the appropriate sub-millisecond time range.
Results
FRET System.
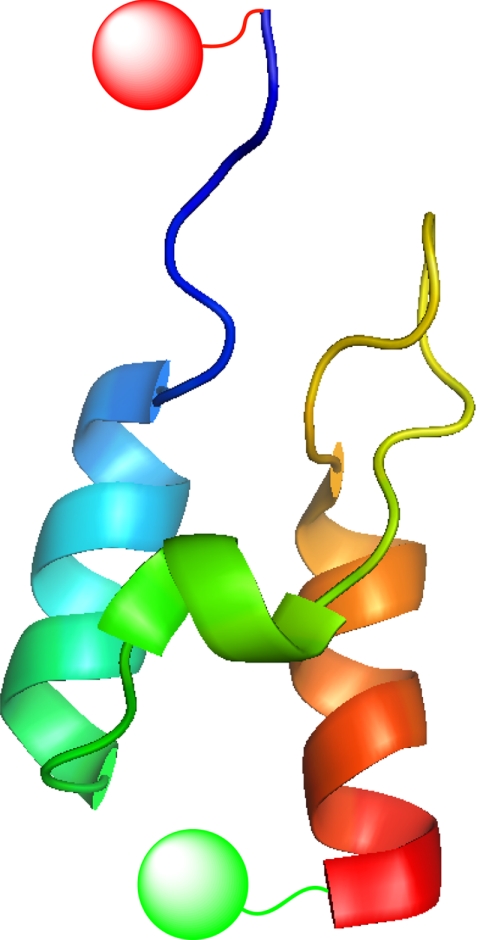
We introduced 2 Cys residues into BBL at the N- and C-termini and labeled them with Alexa Fluor 546 (AF546) and Alexa Fluor 647 (AF647; Fig. 1), with AF546 acting as FRET donor and AF647 as acceptor. The Förster critical distance is 63 Å. The midpoint for chemical denaturation of the labeled protein at pH 7 and 279 K was 4.07 ± 0.14 M GdmCl, within the experimental error of that of the unlabeled protein, 4.19 ± 0.11 M [supporting information (SI) Fig. S1].
Fig. 1.
The structure of BBL (Protein Data Bank code 1W4H) made with Pymol. The Gly and Ser residues at the N terminus and the inserted Cys residues were not shown. The red and green round spheres represent the labeled dyes.
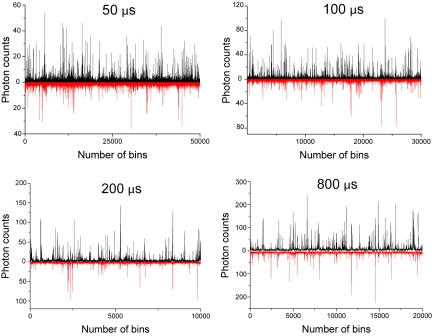
The average diffusion time of the BBL protein molecule in the observation volume of our laboratory-constructed confocal fluorescence microscope was approximately 180 μs, measured by fluorescence correlation spectroscopy (Fig. S2). As shown in Fig. 2, the confocal microscope had an extremely high detection efficiency (≈1 photon/μs), which ensured a high signal-to-noise ratio and high-quality SM-FRET histograms, and we could measure down to a time resolution of 50 μs. The 1-photon/μs detection efficiency was estimated with the highest bursts when the time bin was set to 50 or 100 μs (Fig. 2, panels 1 and 2). The bursts obtained with 200- or 800-μs time bins were not used to estimate the detection efficiency because the real observation time would be shorter than the set time bin because of the fast diffusion. As a result of the statistical distribution of the diffusion time, some of the molecules would be observed for more than 200 μs when the time bin was set to 800 μs, but the average observation time would certainly much shorter than 800 μs, which can be seen from the intensity of the highest bursts in the raw data (Fig. 2, panel 4). We optimized the data quality by adjusting the threshold for signal collection (i.e., the minimum number of photons observed in the donor and acceptor channel required to define a burst event) and the observation time.
Fig. 2.
The representative raw data (black for donor signal and red for acceptor signal) with time bins of 50 μs, 100 μs, 200 μs and 800 μs, respectively.
Effect of Observation Time.
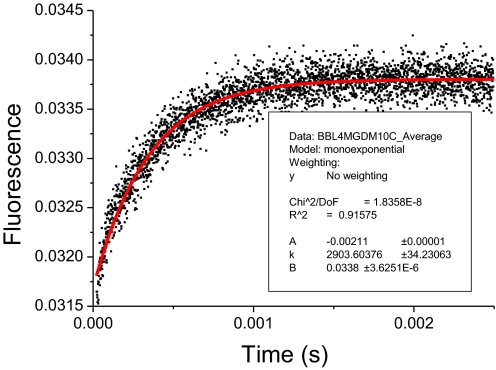
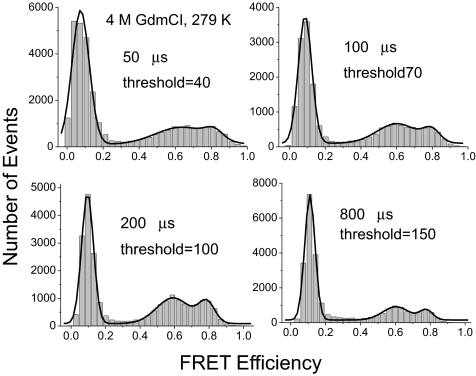
Two peaks representing 2 ensembles that are in exchange will become increasingly more poorly separated as the observation time in the SM-FRET increases through the transition time, and they eventually merge into 1 peak (23, 25). The relaxation rate of BBL in 4 M GdmCl at 6 °C was approximately 340 μs (Fig. 3), comparable to the observation times in the experiments of 50 μs to approximately 200 μs. Theoretically, the best separation of peaks is expected at the highest time resolution. We analyzed the BBL sample in 4 M GdmCl at 279 K at different time resolutions and time bin sizes. Interestingly, as can be seen in Fig. 4, although 2 peaks were observable (apart from the zero peak from the donor-only labeled or acceptor photo-bleached protein molecules), the peaks were not better separated at 50 and 100 μs time resolution than at 200 μs. The two peaks were still well separated at the 800-μs bin time because the residence time in the detection volume is only 180 μs. As discussed next, the threshold is a crucial factor, which could be set to only 40 and 70, respectively, at 50 μs and 100 μs time resolution, whereas the threshold could be set to 100 and 150 when the time bin was set to 200 μs and 800 μs, respectively.
Fig. 3.
Temperature-jump signal of BBL in 4 M GdmCl at 279 K (black indicates data fitted to a mono-exponential equation).
Fig. 4.
Effects of bin time on SM-FRET histogram of BBL. Data were acquired in 4 M GdmCl at 279 K.
Influence of the Threshold Settings on Peak Width.
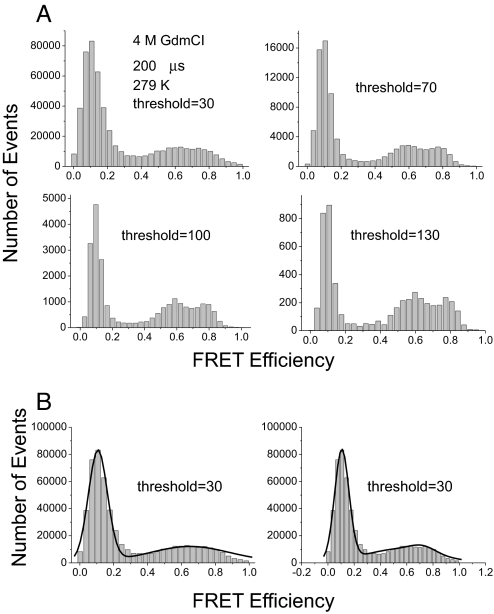
We checked the influence of the threshold for the same set of data obtained for BBL in 4 M GdmCl at 279 K (Fig. 5A). There was good separation of the native and denatured peak when the threshold was set to 100 or 130, but these merged into an apparent single, very broad peak on decreasing the threshold to 30, although the data still fitted better to 2 peaks rather than to a single peak (Fig. 5B). Some of the apparent broadening may result from the statistical noise increasing relatively with the decrease of the threshold and dominating the signal—the statistical fluctuations are inversely proportional to the square root of the threshold, σ = , where E is the mean FRET efficiency and NT is the threshold (24).
Fig. 5.
(A) Effects of threshold on SM-FRET histogram of BBL. Data were acquired in 4 M GdmCl at 279 K with observation time of 200 μs but different thresholds. (B) Fitting the data with a 30-photon threshold to a single (Left) or 2 (Right) Gaussian curves.
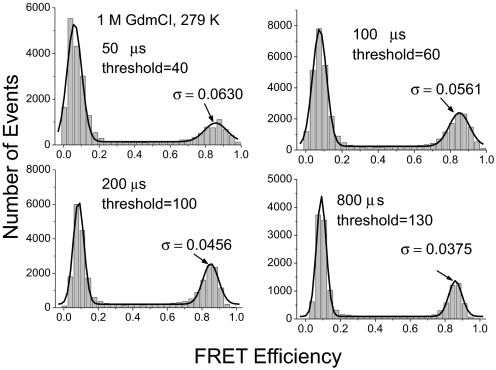
To check how the breadth of the histogram peak changes with the time bin size and threshold, we carried out another control experiment in 1 M GdmCl, in which the protein has only a native state and the peak position is well separated from the value of 1 so that good fitting could be obtained (Fig. 6). The control threshold was set to the highest value at which good statistics were still available. The standard deviation of the Gaussian fit of the native peak to the histogram decreased significantly from 0.063 (at 50 μs time resolution) to 0.038 (at 800 μs time resolution), i.e., the peak was much sharper at 200 μs or 800 μs time resolution, where 2 close peaks are therefore better separated.
Fig. 6.
Effects of threshold on width of SM-FRET histogram of native BBL. Data were acquired in 1 M GdmCl at 279 K. The time bin size and threshold were as shown in each panel. The histograms were fitted to Gaussian distribution and the σ shown in the panel is the SD of the Gaussian distribution.
Effects of Temperature.
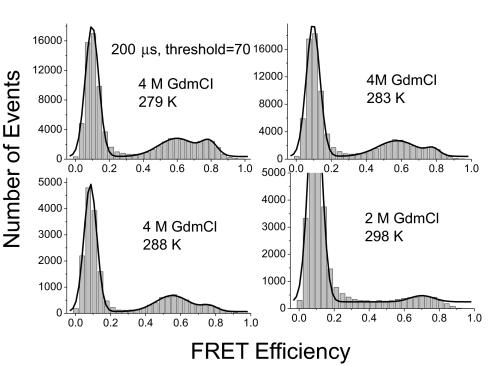
The native and denatured peaks could still be separated at temperatures as high as 15 °C (Fig. 7). However, at 298 K the 2 peaks merged because of the much faster relaxation rate. (The experiment at 298 K was carried out in 2 M GdmCl because of the lower stability at higher temperature.)
Fig. 7.
Effects of temperature on SM-FRET histogram of BBL at different temperatures. Data were acquired with time bin size of 200 μs and the threshold was set to 70 in data analysis. The histograms obtained at 279, 283, and 288 K were fitted to 2 Gaussian distributions and the one obtained at 298 K was fitted to a single Gaussian distribution.
SM-FRET Histograms.
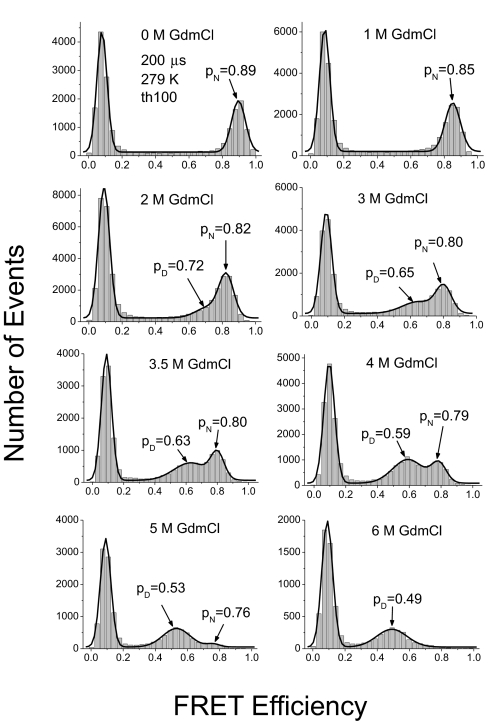
The 200-μs bin time was optimal for the experiments because it was the best compromise between time resolution and the ability to detect a sufficiently large number of photons to have a high threshold. Fig. 8 shows the SM-FRET histogram of BBL in Mops buffer (pH 7) and in different concentrations of GdmCl during a denaturation curve at 200 μs bin time and a threshold of 100 photons for a signal. As expected, the histogram obtained in buffer alone had only one peak, corresponding to the native state of BBL, with apparent FRET efficiency of 0.89. At a GdmCl concentration of 3 M, another peak with lower FRET efficiency appeared, which corresponded to a more expanded state of BBL, the denatured state. The amplitude of the denatured peak increased further with GdmCl concentration and was clearly obvious at 3.5 M GdmCl. The amplitudes of the native and the denatured peaks were similar at 4 M GdmCl, which is in good agreement with bulk CD experiments of denaturation (Fig. S1). At more than 5 M GdmCl, the native peak was no longer obvious because of the low proportion of native state. The denatured peak shifted significantly to lower FRET efficiency with the increase of GdmCl concentration (from FRET efficiency of 0.65 at 3 M GdmCl to 0.49 at 6 M GdmCl), which was likely caused by the expansion of the denatured state at higher denaturant concentration, as observed in previous studies (6, 21). There was a much less, but still observable, shift for the native peak between 0 and 2 M GdmCl (from 0.89 to 0.82 in FRET efficiency). This shift could result from the change of the local environment of the dyes, perhaps from weak hydrophobic interactions between the dye and the protein in buffer, which were eliminated at higher concentrations of GdmCl. The total shift was most likely a combination of this effect with the increase of refractive index (resulting in a decrease of Förster distance), the change in fluorescence quantum yield, and the expanding of the intrinsically disordered fragment at the N terminus (Q126 to S132; Fig. 1) and the linkers between dyes and protein with increasing concentration of GdmCl. Only a very slight shift of the native peak was observed between 2 and 4 M GdmCl (from 0.82 to 0.79 in FRET efficiency), consistent with a native state of constant structure. A slight shift of the native peak with increasing GdmCl concentration is also seen with BDPA (6). The native and denatured peaks were not as well separated as found for BDPA (6) because of the smaller difference in distance between donor and acceptor in the native and denatured states of BBL, which is approximately 20 residues shorter than BDPA, and the faster relaxation of BBL. We obtained similar data at pH 5.8 in phosphate buffer (Fig. S3), indicating the reproducibility of our observations.
Fig. 8.
SM-FRET histogram for BBL in GdmCl at 279 K. Data were acquired with time bin of 200 μs and the threshold was set to 100 in data analysis. pN and pD are the peak position of the native and denatured peaks, respectively.
We did not analyze quantitatively the distances between the dyes in the native and denatured states as it was not necessary for this study and, in any case, there would be severe practical problems in a fine analysis. We just performed calculations that the observed FRET efficiencies were reasonable. The major problem is that the distance between the dyes in the native state will be much longer than the distance between the Cαs of the relevant residues in the folded core, and difficult to analyze: the long disordered N terminus (see Fig. 1) and the linkers between the dyes and protein allow a wide range of conformations and distances. [There may also be a difference in detection efficiency between the detectors and a systematic deviation caused by the difference in Förster critical distance and the distance between dyes (26).] We estimated from an approximate analysis of the distance distributions obtained from the NMR structure of BBL (Protein Data Bank code 1W4H) a FRET efficiency of approximately 0.91, which is close to the observed value of 0.89. For the denatured state, we used the reported distance for a 47-residue denatured protein (27) to estimate a FRET efficiency of approximately 0.57, compared with the range of 0.49 to 0.65 observed with changing concentration of denaturant. We chose a FRET pair with a large Förster critical distance relative to that measured in the native state to prevent the peak corresponding to the denatured state from moving into the zero peak at high denaturant concentration, which we had observed previously (6).
Effects of Changing Denaturant.
The denaturation of BBL was also studied in urea at the same temperature, at which very similar results were obtained (Fig. S4). There was very good separation of the native and denatured peaks in the SM-FRET histogram in 6 M urea at 279 K when the threshold was set to 70 and 100, whereas a merged broad peak was observed when a lower threshold was applied.
Discussion
Fast Time Resolution SM-FRET and Ensuing Problems.
The key direct method to distinguish between barrier-limited folding, with its separate ensembles of states, and unimodal downhill folding, with its single ensemble, is to measure the number of ensembles. In practice, it is very difficult to do the necessary experiments on ultra-fast-folding proteins that equilibrate within the time scale of observation of most biophysical methods (6). SM-FRET, for example, has, until recently, been limited by the intrinsic physical properties of the fluorescent dyes and the detection efficiency of the confocal fluorescence microscope to a time resolution of approximately 1 ms, which is too long for the detection of 2 ensembles that exchange at >10,000 s−1. We have constructed in the laboratory a confocal fluorescence microscope, which has a 10- to 20-fold higher time resolution, and is suitable for application to the folding of BBL, whose mechanism of folding is controversial.
To obtain the highest-quality data we had to optimize the experimental conditions, which may be applicable to other experiments under similar conditions. There is inherent statistical noise in SM-FRET data because of the low flux of photons. Accordingly, a threshold is applied to minimize the number of spurious bursts of photons, which is typically set to 25 to 30 photons (6, 17, 22, 28). At this threshold, our instrument can easily achieve 50 μs time resolution because of its high flux of photons (see Fig. 2). Although this threshold would be suitable for many experiments, here it does not achieve adequate separation of 2 closely located peaks that represent 2 fast-exchanging ensembles. The experiments are at the very limits of detection and are broadened by shot noise, the effects of photo-bleaching, light scattering, photo-physical processes, and molecules that have only short residence times in the observation volume. The statistical noise blurs the signals (Figs. 5 and 6). A higher threshold is necessary to get sharper peaks, which requires 100- to 200-μs time bins to collect more photons. Therefore, we selected an optimal compromise observation time of 200 μs. This time resolution is short enough to be comparable to the relaxation time of BBL in denaturant at low temperature but sufficiently long to allow us to harvest enough photons so we can observe clearly separate native and denatured states at equilibrium.
Campos-Prieto and colleagues have just reported (29) that they have also performed SM-FRET experiments at 278 K at pH 7 on BBL with long extension tails to carry the dyes, but have opposite conclusions from ours. Using a binning time of 50 μs with a similar or slightly less sensitive machine than ours (photon fluxes in the range of 0.5–0.7 photons/μs), they report unimodal FRET efficiency distributions with a maximum that shifts monotonically from high to low FRET values as the concentration of chemical denaturant increases, in support of unimodal folding. The use of 50 μs binning with concomitant low thresholds is the setting in which statistical noise caused our data for separate peaks to merge artefactually into what appears to be a single peak. The use of dyes with long extension tails in their construct may also make changes in FRET efficiency more difficult to detect because of the smaller differences between native and denatured states.
Two-State Ensembles of BBL at Equilibrium.
We clearly observed (Fig. 8) 2 states of BBL in equilibrium, which inter-convert on the time scale seen in bulk temperature jump measurements (Fig. 3) and change their proportions as expected from equilibrium denaturation (Fig. S1).
The shallow minimum between 2 peaks in a SM-FRET histogram and extensive overlap does not mean there is a very small folding energy barrier. The SM-FRET histogram does not equate to the conformational distribution of a protein at equilibrium, and the height of the minimum between the 2 peaks does not represent the number of molecules on the transition state. The area under the SM-FRET histogram reflects the number of molecules in each state but is not a direct measure of the conformational distribution. The first set of reasons for the shape of the curves stems from the actual measurements. The histograms are broadened by factors such as photo-physics processes, photo-bleaching, and statistical noise. This broadening is evident from the experiment in Fig. 6, where it is seen that the width of the native state ensemble varies with the threshold in data analysis. Similarly, in Fig. 5, it is seen that distributions of native and denatured states appear to change with the threshold. There are also fundamental reasons why the observed distributions are not part of an energy landscape. First, each measured FRET efficiency or inter-dye distance is an average of many different conformations of the protein and dye—the SM-FRET histogram is therefore a simplified “conformational distribution.” Second, the time resolution of SM-FRET is on the microsecond time scale whereas the dynamics of proteins is on a scale of picoseconds to nanoseconds, which means the protein molecule can sample thousands of conformations during the observation. In addition, for 2 fast inter-exchanging ensembles, the protein may be present as different ensembles within the observation time. Accordingly, we cannot obtain the free energy landscape from the shape of the histogram. For example, as shown by Schuler and colleagues, there is a very shallow minimum for GspTm in its SM-FRET histogram, but the calculated energy barrier is 4 kBT to 11 kBT (17).
Most of the previous experiments on BBL based on bulk measurements are consistent with both unimodal downhill folding and barrier-limited folding with a heterogeneous native state, but the steep chevron plot favors a conventional folding mechanism with a transition state (7, 29–31). The SM-FRET experiments here show directly that BBL does occupy native and denatured states separated by an energy barrier.
Experimental Section.
Two Cys residues were inserted into BBL at the N- and C-termini (GSCQNNDALSPAIRRLLAEHNLDASAIKGTGVGGRLTREDVEKHLAKAC). The protein was expressed and purified as previously described. The purified protein was labeled with AF546 and AF647 through Cys residues. Unlabeled and single-labeled proteins were removed with HPLC.
SM-FRET experiments were carried out on a home-built dual-channel confocal fluorescence microscope based on a Nikon Eclipse TE2000-U unit (Nikon). The FRET sample was excited by a diode-pumped solid-state laser (Compass 115M-15; Coherent) with 15 mW at 532 nm, which was reduced to 150 μW with neutral density filters. The donor and acceptor fluorescence were collected simultaneously through an oil-immersion objective (Nikon CFI Plan Apochromat VC 100×, numerical aperture 1.4; Nikon), separated by a dichroic mirror (FF494/540/650-Di01; Semrock), filtered by long-pass and bandpass filters and detected separately by 2 photon-counting modules (SPCM-AQR15; PerkinElmer). The output of the 2 detectors was recorded by a digital correlator (Flex02–01D/C; Correlator.com). Sample solutions of 50 to 100 pM diluted in 1 μM unlabeled BBL in Mops buffer (pH 7.0, 50 mM Mops with NaCl, total ionic strength of 250 mM) for GdmCl titration or phosphate buffer (pH 7.0, 20 mM phosphate with NaCl, total ionic strength of 250 mM) for urea titration were used. All experiments were carried out at 6 °C. The time bin size was set to 50, 100, 200, or 800 μs. A threshold of 30 to 150 counts per burst for the sum of the donor and acceptor fluorescence signals was used to differentiate single molecule bursts from the background. Apparent FRET efficiencies of each burst were calculated according to thw following equation: E = nA/(nA + nD), where nA and nD are the background corrected acceptor and donor counts, respectively. Measurements were repeated at different denaturant concentrations and SM-FRET histograms were built accordingly.
Temperature jump data were acquired on a modified PTJ-64 temperature-jump apparatus (Hi-Tech Scientific) with a 5-mm by 5 mm-cell, as described previously (6). Temperature jumps of 3 °C to a final temperature of 6 °C were used. Solutions of 2 μM protein in Mops buffer (pH 7, with appropriate concentrations of denaturant) were excited with a mercury-xenon lamp with excitation filter (Brightline fluorescence filter 542/50; Semrock) and the fluorescence was acquired at wavelengths of greater than 630 nm. Circular dichroism titration was carried out on a J-815 CD Spectrometer (Jasco) at 6 °C.
Supplementary Material
Acknowledgments.
We thank Dr. Christopher Johnson for invaluable help in building the equipment and Dr. Giovanni Settanni for writing the data analysis program and for constructive discussions.
Footnotes
The authors declare no conflict of interest.
This article contains supporting information online at www.pnas.org/cgi/content/full/0909126106/DCSupplemental.
References
- 1.Sabelko J, Ervin J, Gruebele M. Observation of strange kinetics in protein folding. Proc Natl Acad Sci USA. 1999;96:6031–6036. doi: 10.1073/pnas.96.11.6031. [DOI] [PMC free article] [PubMed] [Google Scholar]
- 2.Sadqi M, Fushman D, Muñoz V. Atom-by-atom analysis of global downhill protein folding. Nature. 2006;442:317–321. doi: 10.1038/nature04859. [DOI] [PubMed] [Google Scholar]
- 3.Muñoz V, Sanchez-Ruiz JM. Exploring protein-folding ensembles: A variable-barrier model for the analysis of equilibrium unfolding experiments. Proc Natl Acad Sci USA. 2004;101:17646–17651. doi: 10.1073/pnas.0405829101. [DOI] [PMC free article] [PubMed] [Google Scholar]
- 4.Li P, Oliva FY, Naganathan AN, Muñoz V. Dynamics of one-state downhill protein folding. Proc Natl Acad Sci USA. 2009;106:103–108. doi: 10.1073/pnas.0802986106. [DOI] [PMC free article] [PubMed] [Google Scholar]
- 5.Garcia-Mira MM, Sadqi M, Fischer N, Sanchez-Ruiz JM, Muñoz V. Experimental identification of downhill protein folding. Science. 2002;298:2191–2195. doi: 10.1126/science.1077809. [DOI] [PubMed] [Google Scholar]
- 6.Huang F, Sato S, Sharpe TD, Ying L, Fersht AR. Distinguishing between cooperative and unimodal downhill protein folding. Proc Natl Acad Sci USA. 2007;104:123–127. doi: 10.1073/pnas.0609717104. [DOI] [PMC free article] [PubMed] [Google Scholar]
- 7.Ferguson N, et al. Ultra-fast barrier-limited folding in the peripheral subunit-binding domain family. J Mol Biol. 2005;353:427–446. doi: 10.1016/j.jmb.2005.08.031. [DOI] [PubMed] [Google Scholar]
- 8.Neuweiler H, et al. Downhill versus barrier-limited folding of BBL 2: mechanistic insights from kinetics of folding monitored by independent tryptophan probes. J Mol Biol. 2009;387:975–985. doi: 10.1016/j.jmb.2008.12.056. [DOI] [PubMed] [Google Scholar]
- 9.Zhou Z, Bai Y. Structural biology: analysis of protein-folding cooperativity. Nature. 2007;445:E16–E17. doi: 10.1038/nature05644. [DOI] [PubMed] [Google Scholar]
- 10.Ferguson N, Sharpe TD, Johnson CM, Schartau PJ, Fersht AR. Structural biology: analysis of ‘downhill’ protein folding. Nature. 2007;445:E14–E15. doi: 10.1038/nature05643. [DOI] [PubMed] [Google Scholar]
- 11.Arbely E, Rutherford TJ, Sharpe TD, Ferguson N, Fersht AR. Downhill versus barrier-limited folding of BBL 1: energetic and structural perturbation effects upon protonation of a histidine of unusually low pKa. J Mol Biol. 2009;387:986–992. doi: 10.1016/j.jmb.2008.12.055. [DOI] [PubMed] [Google Scholar]
- 12.Settanni G, Fersht AR. Downhill versus barrier-limited folding of BBL. 3. heterogeneity of the native state of the bbl peripheral subunit binding domain and its implications for folding mechanisms. J Mol Biol. 2009;387:993–1001. doi: 10.1016/j.jmb.2009.02.014. [DOI] [PubMed] [Google Scholar]
- 13.Knott M, Chan HS. Criteria for downhill protein folding: calorimetry, chevron plot, kinetic relaxation, and single-molecule radius of gyration in chain models with subdued degrees of cooperativity. Proteins. 2006;65:373–391. doi: 10.1002/prot.21066. [DOI] [PubMed] [Google Scholar]
- 14.Best RB, et al. Effect of flexibility and cis residues in single-molecule FRET studies of polyproline. Proc Natl Acad Sci USA. 2007;104:18964–18969. doi: 10.1073/pnas.0709567104. [DOI] [PMC free article] [PubMed] [Google Scholar]
- 15.Deniz AA, et al. Single-molecule protein folding: Diffusion fluorescence resonance energy transfer studies of the denaturation of chymotrypsin inhibitor 2. Proc Natl Acad Sci USA. 2000;97:5179–5184. doi: 10.1073/pnas.090104997. [DOI] [PMC free article] [PubMed] [Google Scholar]
- 16.Laurence TA, Kong X, Jäger M, Weiss S. Probing structural heterogeneities and fluctuations of nucleic acids and denatured proteins. Proc Natl Acad Sci USA. 2005;102:17348–17353. doi: 10.1073/pnas.0508584102. [DOI] [PMC free article] [PubMed] [Google Scholar]
- 17.Schuler B, Lipman EA, Eaton WA. Probing the free-energy surface for protein folding with single-molecule fluorescence spectroscopy. Nature. 2002;419:743–747. doi: 10.1038/nature01060. [DOI] [PubMed] [Google Scholar]
- 18.Schuler B, Eaton WA. Protein folding studied by single-molecule FRET. Curr Opin Struc Biol. 2008;18:16–26. doi: 10.1016/j.sbi.2007.12.003. [DOI] [PMC free article] [PubMed] [Google Scholar]
- 19.Majumdar DS, et al. Single-molecule FRET reveals sugar-induced conformational dynamics in LacY. Proc Natl Acad Sci USA. 2007;104:12640–12645. doi: 10.1073/pnas.0700969104. [DOI] [PMC free article] [PubMed] [Google Scholar]
- 20.Weiss S. Fluorescence spectroscopy of single biomolecules. Science. 1999;283:1676–1683. doi: 10.1126/science.283.5408.1676. [DOI] [PubMed] [Google Scholar]
- 21.Kuzmenkina EV, Heyes CD, Nienhaus GU. Single-molecule Förster resonance energy transfer study of protein dynamics under denaturing conditions. Proc Natl Acad Sci USA. 2005;102:15471–15476. doi: 10.1073/pnas.0507728102. [DOI] [PMC free article] [PubMed] [Google Scholar]
- 22.Merchant KA, Best RB, Louis JM, Gopich IV, Eaton WA. Characterizing the unfolded states of proteins using single-molecule FRET spectroscopy any molecular simulations. Proc Natl Acad Sci USA. 2007;104:1528–1533. doi: 10.1073/pnas.0607097104. [DOI] [PMC free article] [PubMed] [Google Scholar]
- 23.Gopich IV, Szabo A. Single-molecule FRET with diffusion and conformational dynamics. J Phys Chem B. 2007;111:12925–12932. doi: 10.1021/jp075255e. [DOI] [PubMed] [Google Scholar]
- 24.Gopich I, Szabo A. Theory of photon statistics in single-molecule Förster resonance energy transfer. J Chem Phys. 2005;122:1–18. doi: 10.1063/1.1812746. [DOI] [PubMed] [Google Scholar]
- 25.Nir E, et al. Shot-noise limited single-molecule FRET histograms: Comparison between theory and experiments. J Phys Chem B. 2006;110:22103–22124. doi: 10.1021/jp063483n. [DOI] [PMC free article] [PubMed] [Google Scholar]
- 26.Huang F, Settanni G, Fersht AR. Fluorescence resonance energy transfer analysis of the folding pathway of Engrailed homeodomain. Protein Eng Des Sel. 2008;21:131–146. doi: 10.1093/protein/gzm069. [DOI] [PubMed] [Google Scholar]
- 27.Zhou HX. Dimensions of denatured protein chains from hydrodynamic data. J Phys Chem B. 2002;106:5769–5775. [Google Scholar]
- 28.Sherman E, Haran G. Coil-globule transition in the denatured state of a small protein. Proc Natl Acad Sci USA. 2006;103:11539–11543. doi: 10.1073/pnas.0601395103. [DOI] [PMC free article] [PubMed] [Google Scholar]
- 29.Campos-Prieto LA, Liu J, Wang X, English D, Muñoz V. Watching the progressive (dis)ordering of one-state downhill protein folding in single molecules. VIII European Symposium of The Protein Society 2009, Book of Abstracts; 2009. pp. 37–38. [Google Scholar]
- 30.Spector S, et al. Cooperative folding of a protein mini domain: the peripheral subunit-binding domain of the pyruvate dehydrogenase multienzyme complex. J Mol Biol. 1998;276:479–489. doi: 10.1006/jmbi.1997.1522. [DOI] [PubMed] [Google Scholar]
- 31.Ferguson N, Schartau PJ, Sharpe TD, Sato S, Fersht AR. One-state downhill versus conventional protein folding. J Mol Biol. 2004;344:295–301. doi: 10.1016/j.jmb.2004.09.069. [DOI] [PubMed] [Google Scholar]
- 32.Sharpe TD, Ferguson N, Johnson CM, Fersht AR. Conservation of transition state structure in fast folding peripheral subunit-binding domains. J Mol Biol. 2008;383:224–237. doi: 10.1016/j.jmb.2008.06.081. [DOI] [PubMed] [Google Scholar]
Associated Data
This section collects any data citations, data availability statements, or supplementary materials included in this article.


