Abstract
Signal flow direction is one of the most important features of the protein-protein interactions in signaling networks. However, almost all the outcomes of current high-throughout techniques for protein-protein interactions mapping are usually supposed to be non-directional. Based on the pairwise interaction domains, here we defined a novel parameter protein interaction directional score and then used it to predict the direction of signal flow between proteins in proteome-wide signaling networks. Using 5-fold cross-validation, our approach obtained a satisfied performance with the accuracy 89.79%, coverage 48.08%, and error ratio 16.91%. As an application, we established an integrated human directional protein interaction network, including 2,237 proteins and 5,530 interactions, and inferred a large amount of novel signaling pathways. Directional protein interaction network was strongly supported by the known signaling pathways literature (with the 87.5% accuracy) and further analyses on the biological annotation, subcellular localization, and network topology property. Thus, this study provided an effective method to define the upstream/downstream relations of interacting protein pairs and a powerful tool to unravel the unknown signaling pathways.
The development of high-throughput technologies has produced large scale protein interaction data for multiple species, and significant efforts have been made to analyze the data in order to establish the protein networks and to understand their functions (1–6). In protein interaction networks, physical interactions are usually supposed to be non-directional. In fact, there widely exist regulation relationship and upstream/downstream relations between interacting proteins when they are involved in various networks of signal transduction, transcriptional regulation, cell cycle, or metabolism, etc.
Several groups have developed methods to infer signaling pathways based on protein interactions. Steffen et al. (7) presented an automated approach for modeling signal transduction networks in Saccharomyces cerevisiae by integrating protein interactions and gene expression data. Hautaniemi et al. (8) applied a decision tree approach to facilitate elucidation of signal-response cascade relations and generate experimentally testable predictions. Shlomi et al. (9) established a comprehensive framework, QPath, efficiently searched the network for homologous pathways. These evolutionarily conserved pathways provided clues to infer the upstream/downstream relations of protein interactions in unknown signaling pathways. Nguyen et al. (10) proposed a method of predicting signaling domain-domain interactions using inductive logic programming and discovering signal transduction networks in yeast. However, all the methods mentioned above focused on the automated generation of the signaling pathways using PPI and gene expression data. They could obtain a part of signaling pathways with a limited length and low accuracy only in the simple eukaryote yeast. Meanwhile, there was no efficient method to identify the direction of signal flows in pairwise interaction proteins.
Domains are elements of proteins in a sense of structure and function. Most proteins interact with each other through their domains. Therefore, it is crucial and useful to understand PPIs based on the domains (11, 12). In this paper, we introduced a novel method to predict the direction of signal flows through protein pairs in signaling networks according to their constituent interacting domains. First, we defined a measure F to evaluate the direction of domain interactions and computed the F values of domain interactions using the training set of PPIs in multiple species. Then, we defined a novel parameter Protein Interaction Directional Score (PIDS)1 to measure their directions. Furthermore, we evaluated the method using 5-fold cross-validation protocol. Finally, we applied it to infer novel signaling pathways from human proteome-wide interactions.
MATERIALS AND METHODS
High-confidence Domain Interaction Dataset
Total 6,163 high-confidence domain interactions were downloaded from DOMINE (13), including 4,349 interactions inferred from PDB entries and 3,143 interactions predicted by eight different computational approaches, using Pfam domain definitions. In this paper, these domain interactions were examined to discover their directions.
Protein Interaction Dataset in Signaling Networks
All the signaling networks of human, mouse, rat, fly, and yeast were downloaded from KEGG (14). There are 2,803 protein interactions involved in activation, inhibition, phosphorylation, dephosphorylation, and ubiquitination and 649 protein complexes. Protein domain information is based on the Pfam-A domains (15).
Integrated Human Protein Interaction Dataset
We obtained 45,238 non-redundant human protein interactions from HPRD (6), DIP (16), MINT (17), BIND (18) database, and the previous resources (19, 20), which have corresponding Entrez Gene ID index and not reported in protein complex. These interactions were obtained by experiments and did not contain the prediction results, which composed the integrated human protein interaction dataset. The dataset is relatively credible and comprehensive to cover most of human protein interactions detected (21).
The Function F for the Direction Prediction of Domain Interactions
The enrichment of domain pairs was assessed with the domain enrichment ratio D (22), which is calculated as the probability (Pr) of a given pair of domains in a set of known interacting proteins divided by the product of the probabilities of each given domain pair independently. Based on D, we proposed a novel function F to indicate the direction of interacting domain pairs, which is defined by subtracting the backward domain enrichment ratio from the forward ratio,
 |
where dm and dn are two protein domains, and they can interact with each other, Pr(dm) and Pr(dn) is the probability of domain dm and dn appearing in interacting proteins, Pr(dm → dn) is the probability of protein interactions in which one protein has dm and the other has dn, through which signal transfer from dm to dn. If F(dmn) > 0, then signal transfers from dm to dn, otherwise from dn to dm.
The Parameter PIDS for the Direction Prediction of Protein Interactions
Given two interacting proteins Pi and Pj, if signal transfers from Pi to Pj in signaling networks, then Pij > 0; otherwise Pij < 0. On the basis of the F function in domain interactions, the parameter PIDS for the interaction from Pi to Pj is
 |
where dmn ϵ Pij denotes that domains dm and dn belong to proteins Pi and Pj, respectively, and domain dm can interact with domain dn. Nij is the number of domain interactions between Pi and Pj, where F absolute values are bigger than zero. The threshold of PIDS as t, if PIDSij > t and Pij > 0 or PIDSij < −t and Pij < 0, then the direction of Pi to Pj is correctly predicted.
RESULTS
Signaling Directions of Protein Interactions and Domain Interactions
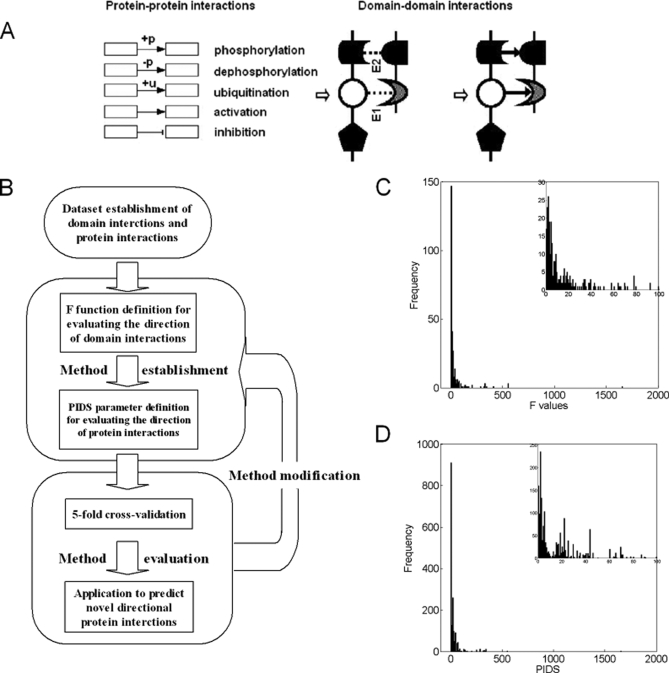
In the signaling networks, the direction of protein interactions is defined as the direction of signal flow between them. The interaction types we investigated include activation, inhibition, phosphorylation, dephosphorylation, and ubiquination, which are all direction-related. In human, rat, mouse, fly, and yeast, 76.40% proteins have one or more Pfam domains. Interaction between two proteins typically involves binding between specific domains. Thus, the identification of interacting domain pairs is an important step toward understanding protein interactions (23) and the direction of signal flow between them. Therefore, it is supposed that there exist upstream/downstream relations in domain interactions as those in protein interactions. Fig. 1, A and B illustrates the method of inferring the directions in domain interactions from the directions in protein interactions.
Fig. 1.
Diagram of the method and its workflow. A, a diagram of the direction between interacting domains. E1 and E2 represent two pairs of interacting domains. B, the work flow of the method. C, distribution of absolute F values in domain interactions. D, distribution of absolute PIDS values in protein interactions.
A Novel Function to Measure Signaling Direction of Domain Interaction
We defined a function F to evaluate the direction of domain interactions and applied it to discover the directions in high-confidence domain interaction dataset. Using 2,803 protein interactions with known directions as the positive training set, 364 domain interactions are found to be involved in the protein interactions of signaling networks. As a result, 286 domain pairs (78.57%) have positive or negative F values (supplemental Table S1). The distribution of their F absolute values is shown in Fig. 1C, with mean value 39.84 and standard error (S. E.) 7.39. They could provide clues about the upstream and downstream relation between a given protein pair in signaling networks. The domain interaction with the largest F is ubiquitin activating enzyme and ubiquitin-conjugating enzyme, the F value of which is high up to 1,658.34.
A Novel Parameter to Predict the Signaling Direction of Protein Interactions Based on Domain Interactions
Based on F of domain interactions, we defined a parameter PIDS to measure the signal flow direction of their corresponding proteins' interaction. According to the domains of pairwise proteins, we computed their PIDS in protein interaction dataset of signaling networks (Fig. 1D). In principle, the protein interactions categorized into activation, inhibition, phosphorylation, dephosphorylation, and ubiquination are directional, while protein complexes, assumed to be non-directional, are used as controls.
Evaluation of the Method using 5-fold Cross-Validation
Using 5-fold cross-validation, we evaluated the performance of this method, in which protein pairs with known directions are used as the positive training set and protein complexes as the negative test set. When some protein pairs in the test set do not include the directional domain interactions, it is impossible to predict the signaling directions of those protein interactions with this method. Coverage is estimated by the number of test protein interactions divided by the number of protein pairs including domain pairs we investigated; and Accuracy, by the percentage of protein pairs, the directions of which are correctly predicted. Error ratio is defined as the percentage of protein pairs in the negative test set, which are falsely predicted with certain directions.
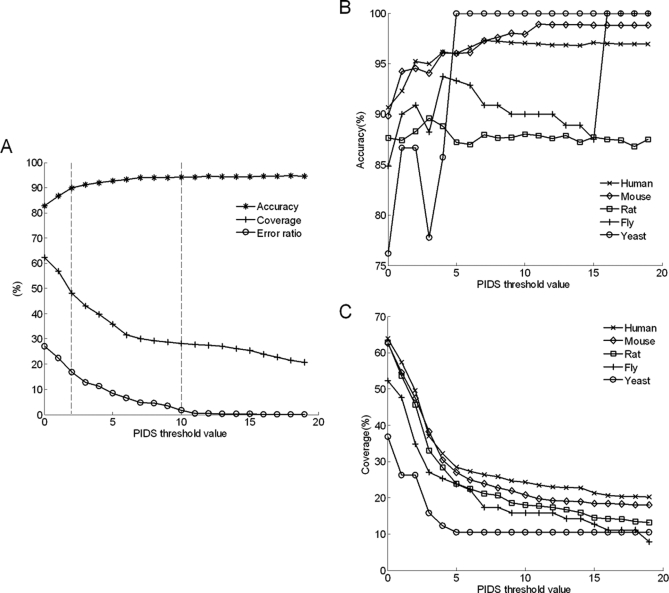
By selecting different threshold values for PIDS, we compared the accuracy, coverage, and error ratio in both the positive/negative test sets, as shown in Fig. 2A. When taking the threshold value as 2, accuracy, coverage, and error ratio are 89.79%, 48.08%, and 16.91%, respectively. While the threshold value goes up to 10, accuracy increases to 94.19% with the coverage 28.21%, and error ratio descends to 1.82%. With the increasing of the threshold value, it could provide higher accuracy and lower error ratio at the cost of smaller predicting capacity. In the practice, users could choose different threshold values of PIDS to meet their own requirements.
Fig. 2.
Performance evaluation of the method. A, accuracy, coverage, and error ratio versus different thresholds of PIDS using 5-fold cross-validation. The upright lines mark the recommendatory thresholds of PIDS with 2 and 10. B, predicting accuracy versus threshold values across different species. C, predicting coverage versus threshold values across different species.
Performance of Cross-Species Prediction for Directional Protein-Protein Interactions
Furthermore, we compared the accuracy and coverage across different species to evaluate the performance of this method, as shown in Fig. 2 (B and C). Since the five species share major Pfam domains, it is feasible to predict the signal flow of PPIs in one species according to the directional PPIs in other species. 84.06% domains in human, 89.36% domains in mouse, 89.30% domains in rat, 82.07% domains in fly, and 64.76% domains in yeast proteins can be found in other four species. Taking the protein interactions of one species as the test set and all the other species as the training set, we identified the set of directional domain-domain interactions based on the training sets and used these domain-domain interactions to predict the directional protein-protein interactions in test dataset. We compared the predicting accuracy and coverage among five species, including human, mouse, rat, fly, and yeast. In conclusion, the method gained better performance in more evolutionarily advanced species. By taking threshold value 2, we achieved accuracy 95.23% and coverage 49.54% in human test set.
Proteome-wide Prediction of Signal Flow Directions in Human Protein Interaction Network
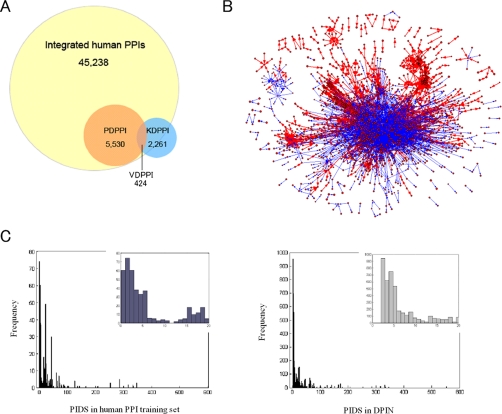
As an application, we used this method to comprehensively predict signal flow directions of proteome-wide protein interactions in the integrated human protein interaction dataset (see under “Materials and Methods”). In the 45,238 integrated human protein interactions, 5,530 protein interactions are predicted with directions (supplemental Table S2), with the threshold value of PIDS 2. Of them, 424 (7.67%) predicted directional protein interactions are reported in the known signaling pathway databases. The predicted directions of 87.5% (371/424) protein interactions accord with those from KEGG (14), BioCarta, or NCI-Nature_-curated database, indicating again that the method is of high accuracy. Obviously, the firstly predicted 5,106 directional protein interactions should be a valuable resource (Fig. 3A).
Fig. 3.
Proteome-wide prediction of directional protein interactions from the integrated human protein interaction dataset. A, the proportion of directional protein interactions in all human interactions. PDPPI, predicted directional PPIs; KDPPI, known directional PPIs in signaling databases; and VDPPI, verified directional PPIs, which are the overlaps of PDPPI and KDPPI. B, the human DPIN predicted by the method. According to the PIDSs, the inferred directional protein interactions are marked with different colors. The protein interactions with 10 > |PIDS| ≥ 2 are marked with blue and one line widths, and those of |PIDS| ≥ 10 with red and two widths. These figures are drawn by Pajek software (31). C, comparison of the PIDS distribution in human PPI training set and DPIN.
As a result, we established the first predicted human directional protein interaction network (DPIN) including 2,237 proteins and 5,530 interactions, with PIDS 19.97 ± 0.57 (S. E.) (Fig. 3B). We found that the distribution of PIDS in human PPI training set and DPIN is similar (Fig. 3C). Furthermore, we characterized DPIN from the views of biological function, subcellular localization, and topology property as follows.
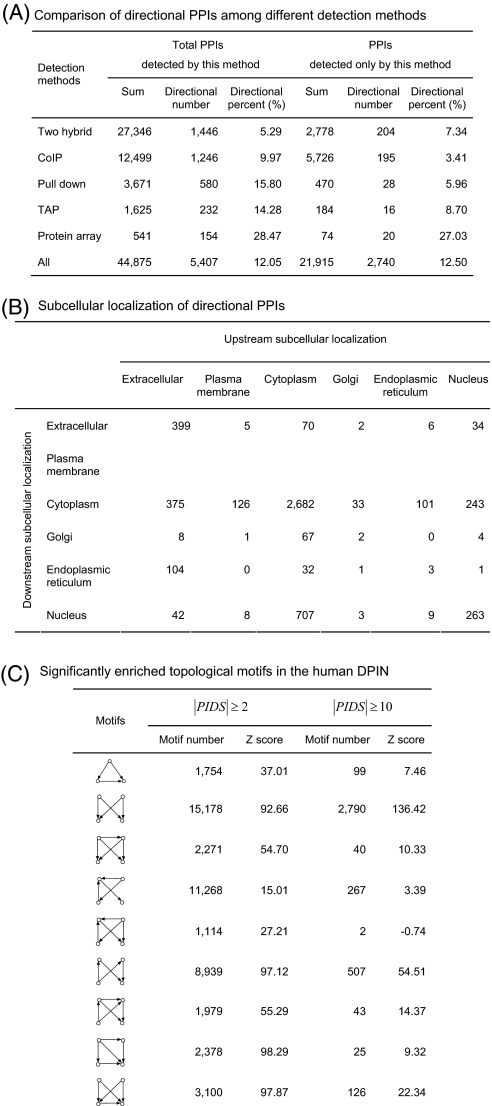
According to the interaction detection methods, there are 22,278 protein interactions in the integrated human protein interaction dataset detected only by one method, such as coimmunoprecipitation, tandem affinity purification, and two hybrid (Table IA). Compared the PPIs detected in vivo with those in vitro, we found 11.30% PPIs in vivo and 15.14% PPIs in vitro were directional. Among these methods, the PPIs from protein array method are of directional with the highest ratio up to 27.03%; whereas those from coimmunoprecipitation method are the lowest with 3.41%, implying that the coimmunoprecipitation method is relatively weak in detecting directional protein interactions in signaling networks.
Table I. Interaction detection method, subcellular localization and topology property of the human DPIN.
Functional Annotation for the Directional Human Protein Interactions
Using Gene Ontology (24), we functionally annotated the proteins in the human DPIN. Among the human training set, 62.2% proteins (453/728) are categorized into signal transduction. In comparison with the integrated human protein interaction dataset, of which 20.9% proteins (2,120/10,146) are annotated as signal transduction, 46.0% proteins (1,029/2,237) in the DPIN are classified as signal transduction, demonstrating the significant enrichment of signal transducers in DPIN (p = 1.67 × 10−212) and then the powerful capacity of our predicting method.
Subcellular Localization for Directional Human Protein Interactions
Using PA-SUB (25), we marked the subcellular localization of proteins in the human DPIN. Table IB indicates in no doubt that the predicted directions of protein interactions are mostly from the exterior to the nucleus of cells, i.e. the protein interactions with the direction from extracellular to cytoplasm are significantly more than those from cytoplasm to extracellular, and these from cytoplasm to nucleus more than those from nucleus to cytoplasm. Obviously, the global patterns of signal flow of protein interactions predicted by our method are perfectly in accord with the general law of signal pathways from the view of the subcellular localization, i.e. along the way from outside to inside of cells.
In addition, we paid attention to the protein interactions through which signal flows reversely from inside to outside of cells, including those from plasma membrane to extracellular, cytoplasm to plasma membrane, cytoplasm to extracellular, and nucleus to cytoplasm. Totally, we found 390 such protein interactions, with PIDS mean 16.35 ± 1.43 (S. E.) (supplemental Table S3). These protein interactions might play roles in feedback regulation of signal transduction.
Topology Property of the Human DPIN
Using MFinder 1.2 (26), we computed the topological motifs of the human DPIN and found that a large amount of 3-node and 4-node motifs are significantly enriched in this network (Table IC). Intriguingly, most of the significantly abundant motifs are feed-forward loops rather than feedback ones. These feed-forward loops have been reported to be widely present in the signaling networks, but absent in transcription networks (27), and could combine to form multi-layer perceptron motifs that are composed of three or more layers of signaling proteins (28). Also, such patterns can potentially carry out elaborate functions on multiple input signals and show graceful degradation of performance upon loss of components (29, 30).
Novel Signaling Pathways Inferred from the Human DPIN
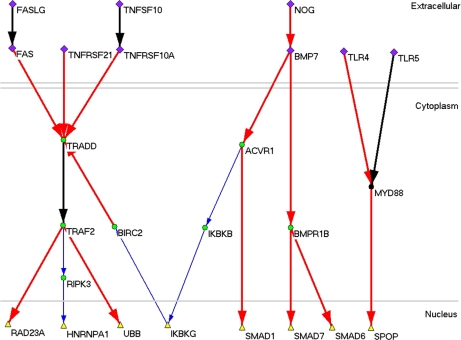
From the human DPIN, we inferred a large amount of novel signaling pathways. By defining the extracellular proteins as the input, which could only deliver to but not accept signal from other proteins and those nuclear proteins as the output, which could only accept from but not deliver to any other protein, we found 292 input proteins and 219 output proteins. Then we searched all the possible pathways from the input layer to the output and generated 973,628 pathways with PIDS mean 14.66 ± 0.01 (S. E.) and average path length 8.61, which highlighted by the pathway from TNFRSF21 to UBB with the highest PIDS mean 122.63. The number of pathways is very large in that signaling networks have the character of multi-pathways, and only a part of pathways are verified from the biological point. We paid special attention to the shortest pathways between the input and output. As a result, we found 1,457 novel signaling pathways (supplemental Table S4) and presented top 10 predicted pathways (Fig. 4). Meanwhile, we compared the average PIDS and path length of shortest pathways and found the significant negative correlation between them with Spearman correlation coefficient −0.315 (p = 10−6), suggesting that the shorter pathways tend to have stronger signal flow directions.
Fig. 4.
Top 10 pathways inferred from the human DPIN. The proteins located in extracellular are marked with diamond, those in cytoplasm ellipse, and those in nucleus triangle. The protein interactions of 10 > |PIDS| ≥ 2 are marked with blue and one line widths, those of |PIDS| ≥ 10 with red and two widths, and known PPIs in signaling databases with black and two widths.
DISCUSSION
The direction of protein interactions is the prerequisite of forming various signaling networks. We proposed a method to infer the signaling directions between protein interactions based on their constitutive domains. Compared with the previous researches (7–10), our method focused on the prediction of the direction between pairwise interacting proteins, which is easier to be evaluated. Especially, this method could be applied to predict signal flow direction in proteome-wide protein interactions and provide a global directional annotation of the protein interaction network. The method we proposed is powerful not only in defining unknown direction of protein interactions, but also in providing comprehensive insight into the signaling networks.
The method was successfully applied to establish a novel human DPIN, which was strongly supported by the highly accurate prediction of known signaling pathways and further analysis on the biological annotation, subcellular localization, and topology property. The predicted directional proteins are significantly enriched in signal transduction, and the global directions of protein interactions accord with the general laws in the signaling networks. Based on the evident DPIN, we uncovered several very interesting features of directional protein interaction networks as follows: the direction of signal flow based on protein interactions goes frequently along the way from the outside to inside of the cells; feed-forward loops more widely exist than the feedback loops; the shorter pathways tend to have stronger signal flow directions. Of course, these conclusions are drawn based on the incomplete human dataset. Although these conclusions may be biased, so far there is still no complete protein interaction network. Our conclusions based on the current dataset can imply the topology property of human protein-protein interaction networks. With more protein interactions and domain interactions are discovered; our method can be applied to find more signaling pathways and further validate the features of signaling networks reported above.
Supplementary Material
Acknowledgments
We thank Drs. Jiangqi Li, Lei Dou, and Songfeng Wu for their excellent advice and assistance as well as all the members in the bioinformatics lab of Beijing Proteome Research Center for helpful discussions.
Footnotes
* This work was supported by grants from the Chinese Ministry of Science and Technology (2006CB910803, 2006CB910706, 2006AA02A312), National Science Foundation of China (30800200), Creative Research Group Science Foundation of China (30621063), and Beijing Municipal Science and Technology Project (H030230280590).
 The on-line version of this article (available at http://www.mcponline.org) contains supplemental material.
1 The abbreviations used are:
- PIDS
- protein interaction directional score
- Pr
- probability
- DPIN
- directional protein interaction network
- PPI
- protein-protein interaction.
REFERENCES
- 1.Mewes H. W., Frishman D., Güldener U., Mannhaupt G., Mayer K., Mokrejs M., Morgenstern B., Münsterkötter M., Rudd S., Weil B. (2002) MIPS: a database for genomes and protein sequences. Nucleic Acids Res 30, 31–34 [DOI] [PMC free article] [PubMed] [Google Scholar]
- 2.Uetz P., Giot L., Cagney G., Mansfield T. A., Judson R. S., Knight J. R., Lockshon D., Narayan V., Srinivasan M., Pochart P., Qureshi-Emili A., Li Y., Godwin B., Conover D., Kalbfleisch T., Vijayadamodar G., Yang M., Johnston M., Fields S., Rothberg J. M. (2000) A comprehensive analysis of protein-protein interactions in Saccharomyces cerevisiae. Nature 403, 623–627 [DOI] [PubMed] [Google Scholar]
- 3.Ito T., Chiba T., Ozawa R., Yoshida M., Hattori M., Sakaki Y. (2001) A comprehensive two-hybrid analysis to explore the yeast protein interactome. Proc. Natl. Acad. Sci. U. S. A 98, 4569–4574 [DOI] [PMC free article] [PubMed] [Google Scholar]
- 4.Li S., Armstrong C. M., Bertin N., Ge H., Milstein S., Boxem M., Vidalain P. O., Han J. D., Chesneau A., Hao T., Goldberg D. S., Li N., Martinez M., Rual J. F., Lamesch P., Xu L., Tewari M., Wong S. L., Zhang L.V., Berriz G. F., Jacotot L., Vaglio P., Reboul J., Hirozane-Kishikawa T., Li Q., Gabel H. W., Elewa A., Baumgartner B., Rose D. J., Yu H., Bosak S., Sequerra R., Fraser A., Mango S. E., Saxton W. M., Strome S., Van Den Heuvel S., Piano F., Vandenhaute J., Sardet C., Gerstein M., Doucette-Stamm L., Gunsalus K. C., Harper J. W., Cusick M. E., Roth F. P., Hill D. E., Vidal M. (2004) A map of the interactome network of the metazoan C. elegans. Science 303, 540–543 [DOI] [PMC free article] [PubMed] [Google Scholar]
- 5.Giot L., Bader J. S., Brouwer C., Chaudhuri A., Kuang B., Li Y., Hao Y. L., Ooi C. E., Godwin B., Vitols E., Vijayadamodar G., Pochart P., Machineni H., Welsh M., Kong Y., Zerhusen B., Malcolm R., Varrone Z., Collis A., Minto M., Burgess S., McDaniel L., Stimpson E., Spriggs F., Williams J., Neurath K., Ioime N., Agee M., Voss E., Furtak K., Renzulli R., Aanensen N., Carrolla S., Bickelhaupt E., Lazovatsky Y., DaSilva A., Zhong J., Stanyon C. A., Finley R. L., Jr., White K. P., Braverman M., Jarvie T., Gold S., Leach M., Knight J., Shimkets R. A., McKenna M. P., Chant J., Rothberg J. M. (2003) A protein interaction map of Drosophila melanogaster. Science 302, 1727–1736 [DOI] [PubMed] [Google Scholar]
- 6.Peri S., Navarro J. D., Amanchy R., Kristiansen T. Z., Jonnalagadda C. K., Surendranath V., Niranjan V., Muthusamy B., Gandhi T. K., Gronborg M., Ibarrola N., Deshpande N., Shanker K., Shivashankar H. N., Rashmi B. P., Ramya M. A., Zhao Z., Chandrika K. N., Padma N., Harsha H. C., Yatish A. J., Kavitha M. P., Menezes M., Choudhury D. R., Suresh S., Ghosh N., Saravana R., Chandran S., Krishna S., Joy M., Anand S. K., Madavan V., Joseph A., Wong G. W., Schiemann W. P., Constantinescu S. N., Huang L., Khosravi-Far R., Steen H., Tewari M., Ghaffari S., Blobe G. C., Dang C. V., Garcia J. G., Pevsner J., Jensen O. N., Roepstorff P., Deshpande K. S., Chinnaiyan A. M., Hamosh A., Chakravarti A., Pandey A. (2003) Development of human protein reference database as an initial platform for approaching systems biology in humans. Genome Res 13, 2363–2371 [DOI] [PMC free article] [PubMed] [Google Scholar]
- 7.Steffen M., Petti A., Aach J., D'haeseleer P., Church G. (2002) Automated modelling of signal transduction networks. BMC Bioinformatics 3, 34. [DOI] [PMC free article] [PubMed] [Google Scholar]
- 8.Hautaniemi S., Kharait S., Iwabu A., Wells A., Lauffenburger D. A. (2005) Modeling of signal-response cascades using decision tree analysis. Bioinformatics 21, 2027–2035 [DOI] [PubMed] [Google Scholar]
- 9.Shlomi T., Segal D., Ruppin E., Sharan R. (2006) QPath: a method for querying pathways in a protein-protein interaction network. BMC Bioinformatics 7, 199. [DOI] [PMC free article] [PubMed] [Google Scholar]
- 10.Nguyen T. P., Ho T. B. (2006) Discovering signal transduction networks using signaling domain-domain interactions. Genome Inform 17, 35–45 [PubMed] [Google Scholar]
- 11.Wojcik J., Schächter V. (2001) Protein-protein interaction map inference using interaction domain profile pairs. Bioinformatics 17, S296–305 [DOI] [PubMed] [Google Scholar]
- 12.Deng M., Mehta S., Sun F., Chen T. (2002) Inferring domain-domain interactions from protein-protein interactions. Genome Res 12, 1540–1548 [DOI] [PMC free article] [PubMed] [Google Scholar]
- 13.Raghavachari B., Tasneem A., Przytycka T. M., Jothi R. (2008) DOMINE: A database of protein domain interactions. Nucleic Acids Res 36, D656–D661 [DOI] [PMC free article] [PubMed] [Google Scholar]
- 14.Kanehisa M., Goto S. (2000) KEGG: kyoto encyclopedia of genes and genomes. Nucleic Acids Res 28, 27–30 [DOI] [PMC free article] [PubMed] [Google Scholar]
- 15.Finn R. D., Tate J., Mistry J., Coggill P. C., Sammut S. J., Hotz H. R., Ceric G., Forslund K., Eddy S. R., Sonnhammer E. L., Bateman A. (2008) The Pfam protein families database. Nucleic Acids Res 36, D281–D288 [DOI] [PMC free article] [PubMed] [Google Scholar]
- 16.Xenarios I., Rice D. W., Salwinski L., Baron M. K., Marcotte E. M., Eisenberg D. (2000) DIP: The database of interacting proteins. Nucleic Acids Res 28, 289–291 [DOI] [PMC free article] [PubMed] [Google Scholar]
- 17.Zanzoni A., Montecchi-Palazzi L., Quondam M., Ausiello G., Helmer-Citterich M., Cesareni G. (2002) MINT: a molecular INTeraction database. FEBS Lett 513, 135–140 [DOI] [PubMed] [Google Scholar]
- 18.Bader G. D., Donaldson I., Wolting C., Ouellette B. F., Pawson T., Hogue C. W. (2001) BIND—The biomolecular interaction network database. Nucleic Acids Res 29, 242–245 [DOI] [PMC free article] [PubMed] [Google Scholar]
- 19.Stelzl U., Worm U., Lalowski M., Haenig C., Brembeck F. H., Goehler H., Stroedicke M., Zenkner M., Schoenherr A., Koeppen S., Timm J., Mintzlaff S., Abraham C., Bock N., Kietzmann S., Goedde A., Toksöz E., Droege A., Krobitsch S., Korn B., Birchmeier W., Lehrach H., Wanker E. E. (2005) A human protein-protein interaction network: a resource for annotating the proteome. Cell 122, 957–968 [DOI] [PubMed] [Google Scholar]
- 20.Rual J. F., Venkatesan K., Hao T., Hirozane-Kishikawa T., Dricot A., Li N., Berriz G. F., Gibbons F. D., Dreze M., Ayivi-Guedehoussou N., Klitgord N., Simon C., Boxem M., Milstein S., Rosenberg J., Goldberg D. S., Zhang L. V., Wong S. L., Franklin G., Li S., Albala J. S., Lim J., Fraughton C., Llamosas E., Cevik S., Bex C., Lamesch P., Sikorski R. S., Vandenhaute J., Zoghbi H. Y., Smolyar A., Bosak S., Sequerra R., Doucette-Stamm L., Cusick M. E., Hill D. E., Roth F. P., Vidal M. (2005) Towards a proteome-scale map of the human protein-protein interaction network. Nature 437, 1173–1178 [DOI] [PubMed] [Google Scholar]
- 21.Stumpf M. P., Thorne T., de Silva E., Stewart R., An H. J., Lappe M., Wiuf C. (2008) Estimating the size of the human interactome. Proc. Natl. Acad. Sci. U. S. A 105, 6959–6964 [DOI] [PMC free article] [PubMed] [Google Scholar]
- 22.Rhodes D. R., Tomlins S. A., Varambally S., Mahavisno V., Barrette T., Kalyana-Sundaram S., Ghosh D., Pandey A., Chinnaiyan A. M. (2005) Probabilistic model of the human protein-protein interaction network. Nature Biotech 23, 951–959 [DOI] [PubMed] [Google Scholar]
- 23.Guimarães K. S., Jothi R., Zotenko E., Przytycka T. M. (2006) Predicting domain-domain interactions using a parsimony approach. Genome Biol 7, R104. [DOI] [PMC free article] [PubMed] [Google Scholar]
- 24.Ashburner M., Ball C. A., Blake J. A., Botstein D., Butler H., Cherry J. M., Davis A. P., Dolinski K., Dwight S. S., Eppig J. T., Harris M. A., Hill D. P., Issel-Tarver L., Kasarskis A., Lewis S., Matese J. C., Richardson J. E., Ringwald M., Rubin G. M., Sherlock G. (2000) Gene ontology: tool for the unification of biology. The gene ontology consortium. Nat. Genet 25, 25–29 [DOI] [PMC free article] [PubMed] [Google Scholar]
- 25.Lu Z., Szafron D., Greiner R., Lu P., Wishart D. S., Poulin B., Anvik J., Macdonell C., Eisner R. (2004) Predicting subcellular localization of proteins using machine-learned classifiers. Bioinformatics 20, 547–556 [DOI] [PubMed] [Google Scholar]
- 26.Milo R., Shen-Orr S., Itzkovitz S., Kashtan N., Chklovskii D., Alon U. (2002) Network motifs: simple building blocks of complex networks. Science 298, 824–827 [DOI] [PubMed] [Google Scholar]
- 27.Alon U. (2007) Network motifs: theory and experimental approaches. Nat. Rev. Genet 8, 450–461 [DOI] [PubMed] [Google Scholar]
- 28.Itzkovitz S., Levitt R., Kashtan N., Milo R., Itzkovitz M., Alon U. (2005) Coarse-graining and self-dissimilarity of complex networks. Phys. Rev. E Stat. Nonlin. Soft Matter Phys 71, 016127 [DOI] [PubMed] [Google Scholar]
- 29.Hertz J., Krogh A., Palmer R. G. (1991) Introduction to the Theory of Neural Computation. Studies in the Sciences of Complexity Lecture Notes Addison-Wesley, Santa Fe Institute, New Mexico [Google Scholar]
- 30.Bray D. (1995) Protein molecules as computational elements in living cells. Nature 376, 307–312 [DOI] [PubMed] [Google Scholar]
- 31.Batagelj V., Mrvar A. (2003) Pajek - Analysis and Visualization of Large Networks, pp. 77–103, Springer (Series Mathematics and Visualization), Berlin [Google Scholar]
Associated Data
This section collects any data citations, data availability statements, or supplementary materials included in this article.


