Abstract
Sensitive biomarkers are needed to detect kidney injury at the earliest stages. The objective of this study was to determine whether the appearance of kidney injury molecule-1 (Kim-1) protein ectodomain in urine and kidney injury molecule-1/hepatitis A viral cellular receptor-1 (Kim-1/Havcr1) gene expression in kidney tissue may be more predictive of renal injury after exposure to nephrotoxicants when compared to traditionally used biomarkers. Male Sprague-Dawley rats were injected with a range of doses of gentamicin, mercury (Hg; HgCl2), or chromium (Cr; K2Cr2O7). The results showed that increases in urinary Kim-1 and kidney Kim-1/Havcr1 gene expression paralleled the degree of severity of renal histopathology and were detected at lower doses of nephrotoxicants when compared to blood urea nitrogen (BUN), serum creatinine, and urinary N-acetyl-β-D-glucosaminidase (NAG). In a time course study, urinary Kim-1 was elevated within 24 h after exposure to gentamicin (100 mg/kg), Hg (0.25 mg/kg), or Cr (5 mg/kg) and remained elevated through 72 h. NAG responses were nephrotoxicant dependent with elevations occurring early (gentamicin), late (Cr), or no change (Hg). At 72 h, after treatment with any of the three nephrotoxicants, there was increased Kim-1 immunoreactivity and necrosis involving ∼50% of the proximal tubules; however, only urinary Kim-1 was significantly increased, while BUN, serum creatinine, and NAG were not different from controls. In rats treated with the hepatotoxicant galactosamine (1.1 mg/kg), serum alanine aminotransferase was increased, but no increase in urinary Kim-1 was observed. Urinary Kim-1 and kidney Kim-1/Havcr1 expression appear to be sensitive and tissue-specific biomarkers that will improve detection of early acute kidney injury following exposure to nephrotoxic chemicals and drugs.
Keywords: acute kidney injury, nephrotoxicity biomarkers, kidney injury molecule-1, mercury, chromium, gentamicin
Renal insufficiency, in some form, has been reported to occur in ∼11% of the U.S. population (Nally, 2002). Acute kidney injury (AKI) or acute renal failure (ARF) occurs in 2–5% of patients admitted to general hospitals in the United States, and AKI is associated with a high rate (up to 50%) of mortality (Chertow et al., 2005; Nally, 2002). The annual health care expenditures attributable to hospital-acquired AKI based on conservative assumptions are estimated to exceed $10 billion (Chertow et al., 2005). Patients with subclinical renal injury may be more sensitive to AKI following exposure to potentially nephrotoxic drugs and/or compounds released unintentionally from medical device materials (e.g., residues, leachates, wear debris) (Idee, 2000; Matzke and Frye, 1997). The traditional, routinely used nephrotoxicity biomarkers, such as increases in blood urea nitrogen (BUN) and serum creatinine, often do not indicate renal injury until a significant degree of renal function is lost (Schnellman, 2001). The insensitivity of these biomarkers may allow candidate drugs and medical devices to pass preclinical safety criteria only to be found nephrotoxic in patients during clinical trials or postmarket clinical use. The Food and Drug Administration’s Critical Path Inititative calls for the development of improved methods for a “better product safety toolkit,” including more sensitive and predictive biomarkers of toxicity (FDA, 2004). Easily quantifiable, sensitive, and early biomarkers of nephrotoxicity are valuable in drug discovery, preclinical safety evaluation of drugs and medical device materials, clinical trials, early therapy intervention, postmarket studies, and exposure to environmental toxicants.
Kidney injury molecule-1 (Kim-1) is a type 1 transmembrane protein that is not detectable in healthy kidney tissue. Transcript levels for the gene that encodes Kim-1 (Kim-1/Havcr1) are strongly upregulated in dedifferentiated proximal tubule epithelial cells in kidney after ischemic or toxic injury. (The gene symbol for the rat kidney injury molecule-1 gene, a homolog of the human and mouse hepatitis A virus cellular receptor-1 genes, is Havcr1. For increased clarity in this report, we will use Kim-1/Havcr1 to designate this gene.) Furthermore, the Kim-1 protein ectodomain is cleaved and released into urine as demonstrated in a number of nephrotoxic models in rats and in humans with AKI following exposure to chemical agents, ischemia, and protein overload (Han et al., 2002; Ichimura et al., 2004). The objectives of the present study were to: (1) determine if elevated levels of Kim-1 protein in urine and increases in Kim-1/Havcr1 gene expression in kidney represent more sensitive biomarkers of AKI compared to traditional, routinely used biomarkers of nephrotoxicity; (2) compare the temporal relationship between Kim-1 and NAG excretion in urine; (3) determine the correlation of the appearance of Kim-1 in urine and Kim-1/Havcr1 expression in kidney with changes in nephropathology and Kim-1 immunoreactivity of renal tissue; and (4) evaluate the specificity of the appearance of Kim-1 in urine for renal injury. The study was conducted using three well-established animal models of AKI: inorganic mercury (Hg)-, hexavalent chromium (Cr)-, and gentamicin-induced nephrotoxicity.
MATERIALS AND METHODS
Animal care and treatments
All procedures requiring the use of animals were conducted in accordance with the U.S. Public Health Service Guide for the Care and Use of Laboratory Animals in an Association for Assessment and Accreditation of Laboratory Animal Care International-accredited facility. Male Sprague-Dawley rats (Harlan, Indianapolis, IN), weighing 270–300 g (10–12 weeks old) were housed in standard plastic cages and maintained on a 12-h light/dark cycle at 22°C–24°C with access to food and water ad libitum. In the dose-response study of gentamicin, rats received a daily sc injection for 3 days of gentamicin sulfate (Sigma, St Louis, MO) (25, 50, 100, 150, 200, and 400 mg gentamicin/kg) in distilled water at an injection volume of 2 ml/kg. In the dose-response study of Hg and Cr, rats were anesthetized with isoflurane and injected with HgCl2 (Sigma) (0.1, 0.25, 0.5, or 1 mg Hg/kg, iv) or K2Cr2O7 (Sigma) (1, 2.5, 5, 10, and 20 mg Cr/kg, sc) in 0.9% saline at an injection volume of 2 ml/kg. Immediately following the single injection of Hg and Cr or 24 h after the third injection of gentamicin, rats were placed individually in plastic metabolism cages with free access to food and water and urine collected for 24 h. For the gentamicin time course study, rats received a sc injection of 100 mg/kg gentamicin daily for 3 days. A 24-h prestudy urine sample was collected prior to the injections of gentamicin, and urine was collected from the same rats at intervals of 0–4, 4–8, 8–24, 24–48, and 48–72 h commencing immediately after the third sc injection. For the Hg and Cr time course studies, rats were given a single injection of 0.25 mg/kg Hg, iv, or 5 mg/kg Cr, sc. A 24-h prestudy urine sample was collected, and urine was collected from the same rats at intervals of 0–4, 4–8, 8–24, 24–48, and 48–72 h commencing immediately after the single injection. All control rats received either an iv or sc injection of 0.9% saline (Hg and Cr vehicle) or a daily sc injection of distilled water (gentamicin vehicle) for 3 days. Urines were centrifuged at 3000 × g for 10 min at 4°C, and supernatants were collected and stored in multiple aliquots at - 80°C. At the end of each experiment, rats were euthanized by terminal exsanguination under isofluorane anesthesia. Blood was collected from the inferior vena cava in heparinized syringes for biochemical analyses. Kidneys were removed immediately and sections preserved for histopathologic and immunohistochemcial studies and in RNAlater (Ambion, Austin, TX) to preserve RNA for determination of Kim-1/Havcr1 expression.
To determine that the increase of urinary Kim-1 is specific for renal injury, a separate group of rats received a single ip injection of the hepatotoxicant galactosamine (Sigma) (1.1 g/kg) or saline vehicle. At 12 and 24 h after treatment, blood and urine were collected for measurement of alanine aminotransferase (ALT) (Vetscan serum chemistry analyzer; Abaxis, Union City, CA) and Kim-1 protein, respectively.
Biochemical analyses for renal injury
Heparinized blood was analyzed for BUN and creatinine using a Reflotron Clinical Chemistry Analyzer (Boehringer Mannheim-Roche Diagnostics, Indianapolis, IN). Urine N-acetyl-β-D-glucosaminidase (NAG) was measured by NAG assay kit (Bio-quant, San Diego, CA). Urine creatinine was determined using QuantiChrom creatinine assay kit (BioAssay Systems, Hayward, CA). Urine Kim-1 protein was measured using Microsphere-based Luminex xMAPTM technology with monoclonal antibodies raised against rat Kim-1 in the V.S.V/J.V.B laboratory. This technique is an adaptation of the recently developed and validated sandwich enzyme-linked immunosorbent assay (ELISA) described in Vaidya et al. (2005), J. Am. Soc. Nephrol. 16, 192A, [abstract]. This assay has been extensively evaluated with respect to its assay range (4–40,000 pg/ml), sensitivity (lowest limit of detection: 8.8 pg/ml), specificity, recovery analysis (90–100% recovery), precision profile (inter- and intra-assay variability < 10%), and dilution linearity. The validation studies showed a significant correlation (92%) between the ELISA and microbead-based assay. This assay has been used to determine urinary levels of Kim-1 in several recent studies using rat models (de Borst et al., 2007; Perez-Rojas et al., 2007; van Timmeren et al., 2006).
RNA isolation and Kim-1/Havcr1 mRNA quantitation
Cross-sections of kidney were placed in RNAlater and stored at 4°C for 24 h to allow RNAlater to penetrate tissues. RNAlater was then removed, and the samples were stored at - 80°C. RNA was isolated using RNeasy Maxi kits (Qiagen, Valencia, CA). Frozen kidney sections were homogenized using a VirTis Tempest rotor-stator homogenizer (VirTis, Gardiner, NY) in Qiagen RNA lysis buffer and processed according to RNeasy kit protocols. Qualitative analyses were performed on each sample using the RNA 6000 Nano Assay on an Agilent 2100 bioanalyzer (Agilent Technologies, Palo Alto, CA). All samples had an RNA integrity number of 8 or greater. RNA samples were quantitated on a NanoDrop ND-1000 spectrophotometer (NanoDrop Technologies, Wilmington, DE), aliquoted, and frozen at - 80°C.
Real-time quantitative PCR was used for relative quantitation of Kim-1/Havcr1 mRNA levels. cDNA was generated from total RNA using random hexamer primers with TaqMan Reverse Transcription Reagents kits (Applied Biosystems, Foster City, CA). PCR was performed using SYBR Green PCR Master Mix reagents (Applied Biosystems) with the ABI Prism 7900HT sequence detection system as described in User Bulletin #2 (updated 10/2001) using four replicate wells per sample. Relative amounts of target were calculated from standard curves for Kim-1/Havcr1 and the endogenous reference (ribosomal protein L7) prepared from five fourfold serial dilutions of a positive control sample (cDNA prepared from kidney RNA pooled from three Sprague-Dawley rats treated with 400 mg/kg gentamicin for 3 days). Gene expression data were normalized by dividing the amount of target mRNA by the endogenous reference. Relative fold changes in gene expression were calculated for individual animals by dividing the amount of normalized target mRNA by the mean of the three control animals for any given dose.
Primer sequences used in reverse transcriptase (RT)–PCR—Kim-1/Havcr1 forward primer: 5′-GTGAGTGGACCAGGCACACA-3′ and Kim-1/Havcr1 reverse primer: 5′-AATCCCTTGATCCATTGTTTTCTT-3′.
Histopathology and immunohistochemistry
Kidneys were fixed in 10% zinc-formalin (Anatech Ltd, Battle Creek, MI) for ∼48 h and then stored in 70% ethanol at room temperature prior to processing. Kidney sections were mounted on glass slides and stained with hematoxylin and eosin for histopathologic evaluation. Nephropathy scores were assigned semiquantitatively by light microscopy on a scale of 0–5: 0 = normal histology; 1 = degeneration only without necrosis; and 2–5 = < 25, < 50, < 75, and > 75%, respectively, of epithelial cells of the proximal convoluted tubules showing necrosis, degeneration, regeneration, tubular dilatation, protein casts, and interstitial lymphocytic infiltration. For detection of immunoreactivity of renal tissues, formalin-fixed, paraffin-embedded renal tissue sections were mounted to glass slides coated with poly-L-Lysine (American HistoLabs, Inc., Gaithersburg, MD). Preparation of these slides included microwave irradiation of the sections in a pressure cooker with antigen retrieval Citra solution (BioGenex, San Ramon, CA). For blocking endogenous peroxidase activity, sections were incubated with 0.3% hydrogen peroxidase in methanol for 30 min and then with 5% normal horse serum for 30 min. Sections were incubated overnight at 4°C with mouse monoclonal antibody against Kim-1 (Brigham and Women’s Hospital and Harvard Medical School, Boston, MA) at a dilution of 1:50, followed by incubation with a biotinylated secondary antibody (Vector, Burlingame, CA) for 1 h, and then with avidin-biotinylated horseradish peroxidase complex (Vector) for 30 min. The peroxidase reaction was carried out with 0.05% 3′3′-diaminobenzidine in 0.1M Tris-HCL buffer and 0.01% hydrogen peroxide for 10 min. The sections were counterstained with hematoxylin for 5 min. For negative staining, the primary antibody was omitted from the incubation step.
Statistical analyses
Data for biomarker assays are expressed as fold changes to make appropriate comparisons between biomarkers. For dose-response studies, fold-change data are expressed as box-and-whisker plots and show median, 25th and 75th percentiles, and the smallest and largest values in the range of data, to help illustrate and define the data distribution. For the time course studies using same rats to collect urine at sequential intervals, fold-change data are expressed as mean ± SD. A one-way ANOVA followed by a Bonferroni post hoc test was employed to compare differences between the treatment groups and control group. A Kruskal-Wallis rank test was used to assess the differences in the nephropathology scores. All analyses were conducted using GraphPad Prism version 4.03 for Windows (GraphPad Software, San Diego, CA). A two-tailed p value < 0.05 was considered statistically significant.
RESULTS
Renal Pathology and Immunohistochemistry
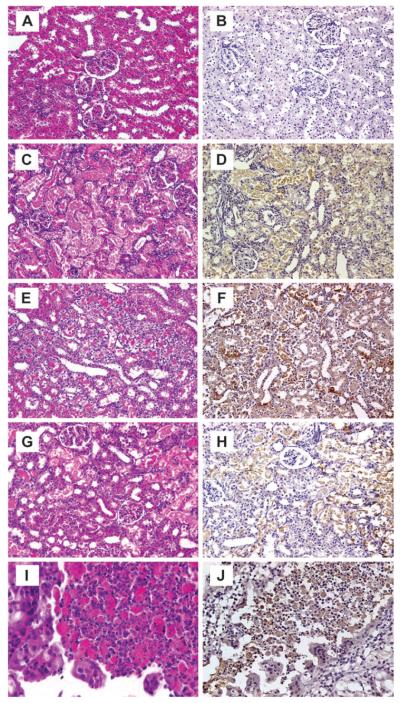
Representative photomicrographs of lesions in rat kidney 72 h after administration of nephrotoxic agents are presented in Figure 1. No lesions were found in the kidney from control rats (Fig. 1A). Gentamicin-, Hg-, or Cr-induced renal lesions were basically similar and consisted mainly of epithelial cell necrosis (Figs. 1C, E, and G), degeneration, and regeneration of the proximal convoluted tubules. Dilatation of the tubules, protein casts in the tubular lumina, glomerular vacuolization, and interstitial lymphocytic infiltration were also observed. In the time course study of Cr, two of six rats had severe tubular necrosis and regeneration in addition to renal cell carcinoma (Fig. 1I) and adenofibroma. These tumors were unlikely to be age related or related to treatment due to the short exposure time. Immunoperoxidase staining for Kim-1 was not evident in control kidneys (Fig. 1B). In contrast, positive immunoperoxidase staining for Kim-1 was observed in tubular epithelial cells of the kidneys from gentamicin-, Hg-, or Cr-treated rats (Fig. 1D, F, and H), including in the renal tumor-positive rats (Fig. 1J).
FIG. 1.
Representative photomicrographs of renal lesions and Kim-1 immunoreactivity in rats at 72 h following treatment with gentamicin, Hg, or Cr. Panels A, C, E, and G (X200) and I (X630), H&E stain; B, D, F, and H (X200) and J (X400), immunoperoxidase staining for Kim-1. Treatments represented in panels are as follows: panels A and B—saline: no renal lesion and no immunoperoxidase staining for Kim-1; panels C and D—gentamicin, 100 mg/kg, sc: necrotic tubular epithelial cells in proximal tubules showing positive Kim-1 immunoreactivity; Panels E and F—Hg, 0.25 mg/kg, iv: necrotic and vacuolated proximal tubules showing a strong positive reaction for Kim-1; panels G and H—Cr, 5 mg/kg, sc: severe necrotic cell in proximal tubules associated with Kim-1 immunoreactivity; panels I and J—Cr, 5 mg/kg, sc: cancer cells of renal cell carcinoma showing a strong positive reaction for Kim-1.
Dose-Response Studies
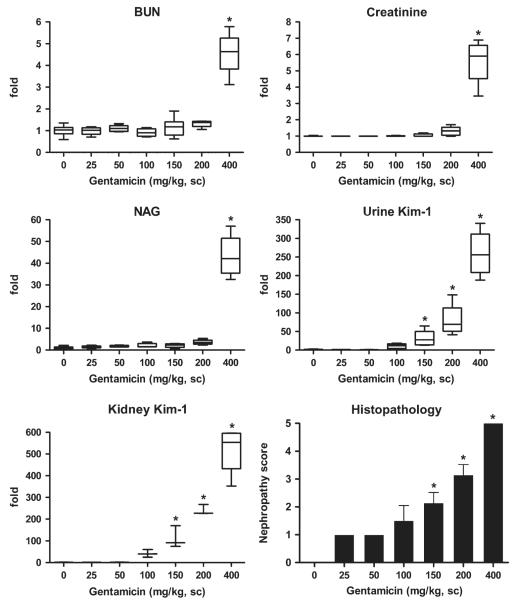
In the gentamicin dose-response study, BUN, serum creatinine, and urinary NAG levels in rats were significantly elevated above control values only at the highest dose of 400 mg/kg, a dose sufficient to produce ARF (Fig. 2). The mean relative fold changes were 5, 6, and 43 for BUN, blood creatinine, and urinary NAG, respectively, which were statistically significant. In contrast, both urinary Kim-1 protein and kidney Kim-1/Havcr1 mRNA expression levels increased in a dose-related manner after injection of gentamicin at doses ≥ 100 mg/kg. The mean increases of urinary Kim-1 were 11-, 30-, 82-, and 260-fold higher than control urinary Kim-1 (165.9 ± 141 pg/mg creatinine) and the mean increases of kidney Kim-1/Havcr1 mRNA levels were 41-, 112-, 240-, and 514-fold higher than control for gentamicin doses of 100, 150, 200, and 400 mg/kg, respectively. Moreover, the increase of urine Kim-1 and kidney Kim-1/Havcr1 expression paralleled dose-dependent changes in nephropathy score (Fig. 2).
FIG. 2.
Comparison of urinary Kim-1 and kidney Kim-1/Havcr1 gene expression with routinely used biomarkers BUN, serum creatinine, and urinary NAG and nephropathy score after various doses of gentamicin. Following the third daily injection of gentamicin as described in the Materials and Methods, rats were placed individually in plastic metabolism cages and urine collected for 24 h, after which rats were euthanized and blood and kidneys were collected. Urinary NAG and Kim-1 are normalized by urinary creatinine. Relative fold changes of BUN, creatinine, NAG, urinary Kim-1, and kidney Kim-1/Havcr1 expression for each animal were calculated by dividing the value for each individual animal level by the level averaged from all corresponding vehicle (saline or distilled water)-treated animals and are displayed in box and whisker plots. BUN (control) = 16.6 ± 3.3 mg/dL; serum creatinine (control) = 0.5 ± 0.0 mg/dL; urinary NAG (control) = 20.3 ± 10.6 (U/g creatinine); urinary Kim-1 (control) = 165.9 ± 141 (pg/mg creatinine); kidney Kim-1/Havcr1 (control) = 1.2 ± 0.7. Asterisks indicate statistically significant difference ( p < 0.05) compared to control group (n = 6 for each group).
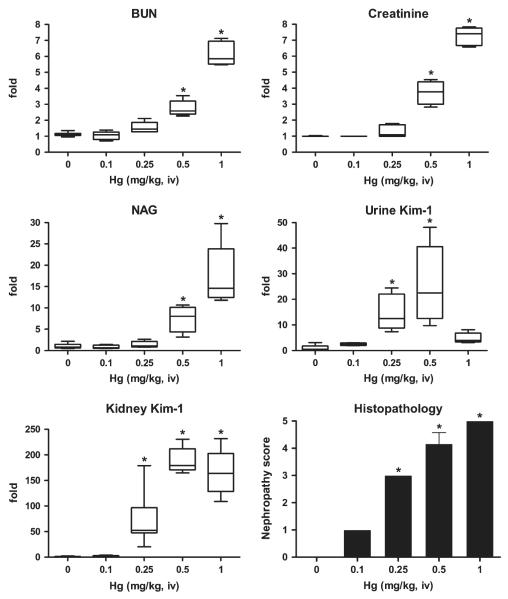
BUN, blood creatinine, and urinary NAG levels significantly increased during 24 h posttreatment only at doses of Hg 0.5 mg/kg (Fig. 3). At Hg doses of 0.5 and 1 mg/kg, BUN, creatinine, and urinary NAG increased 3- and 6-fold, 4- and 7-fold, 8- and 17-fold, respectively, compared to control. In contrast, urinary Kim-1 protein values were 14- and 25-fold higher than control values (165.9 ± 141 pg/mg creatinine) at Hg doses of 0.25 and 0.5 mg/kg, respectively; these increases paralleled changes in nephropathy scores. Unexpectedly, urinary Kim-1 only increased fivefold after injection of 1 mg/kg Hg, which is not statistically a significant, compared to control, likely due to severe renal damage. From our previous experience, this dose of Hg leads to significant mortality rate after 48–72 h, which may account for this result. Kidney Kim-1/Havcr1 mRNA expression increased 71-, 187-, and 167-fold at Hg doses of 0.25, 0.5, and 1 mg/kg, respectively, compared to control. Elevations in Kim-1/Havcr1 gene expression paralleled dose-dependent changes in nephropathy scores.
FIG. 3.
Comparison of urinary Kim-1 and kidney Kim-1/Havcr1 expression with routinely used biomarkers BUN, creatinine, and NAG and nephropathy score after treatment with various doses of Hg (HgCl2). Immediately following the single injection of Hg as described in the Materials and Methods, rats were placed individually in plastic metabolism cages and urine collected for 24 h, after which rats were euthanized and blood and kidneys were collected. Urinary NAG and Kim-1 are normalized by urinary creatinine. Relative fold changes of BUN, serum creatinine, urinary NAG, urinary Kim-1, and kidney Kim-1/Havcr1 expression for each animal were calculated by dividing the value for each individual animal level by the level averaged from all corresponding vehicle (saline or distilled water)-treated animals and are displayed in box and whisker plots. BUN (control) = 16.6 ± 3.3 mg/dL; creatinine (control) = 0.5 ± 0.0 mg/dL; NAG (control) = 20.3 ± 10.6 (U/g creatinine); urinary Kim-1 (control) = 165.9 ± 141 (pg/mg creatinine); kidney Kim-1/Havcr1 = 1.2 ± 0.7. Asterisks indicate statistically significant difference ( p < 0.05) compared to control group (n = 6 for each group).
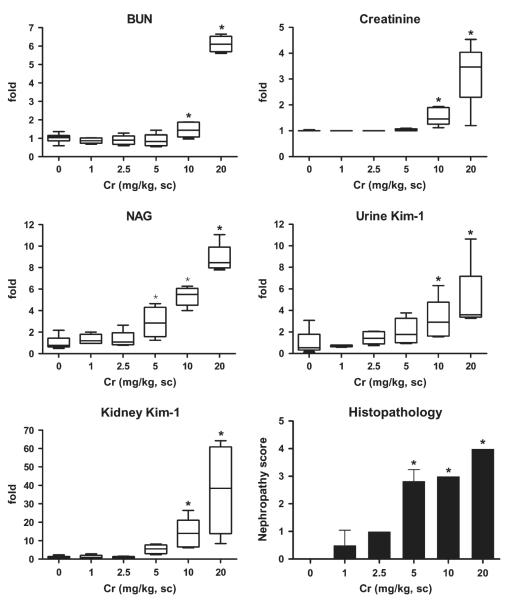
In the Cr dose-response study, BUN and blood creatinine levels both significantly increased by 1.5-fold after injection of 10 mg/kg (Fig. 4). At 20 mg/kg Cr, BUN and creatinine increased six- and threefold above control, respectively. A statistically significant elevation in urine NAG was observed at Cr doses as low as 5 mg/kg and higher; NAG levels were three- , five- and eightfold higher than control at 5, 10, and 20 mg Cr/kg, respectively. Urinary Kim-1 values were twofold higher than control (165.9 ± 141 pg/mg creatinine) at Cr doses of 5 mg/kg; three- and fivefold increases were observed at doses of 10 and 20 mg/kg, respectively, which were statistically significant. Kidney Kim-1/Havcr1 gene expression increased 5-, 14-, and 37-fold at doses of 5, 10, and 20 mg/kg Cr, respectively. The increases in urinary NAG, Kim-1, and Kim-1/Havcr1 gene expression in kidney are consistent with the nephropathy scores (Fig. 4).
FIG. 4.
Comparison of urine Kim-1 and kidney Kim-1/Havcr1 expression with routinely used biomarkers BUN, creatinine, and NAG and nephropathy score after treatment with various doses of Cr (K2Cr2O7). Immediately following the single injection of Cr as described in the Materials and Methods, rats were placed individually in plastic metabolism cages and urine collected for 24 h, after which rats were euthanized and blood and kidneys were collected. Urinary NAG and Kim-1 are normalized by urinary creatinine. Relative fold changes of BUN, creatinine, NAG, urinary Kim-1, and kidney Kim-1 expression for each animal were calculated by dividing the value for each individual animal level by the level averaged from all corresponding vehicle (saline or distilled water)-treated animals and are displayed in box and whisker plots. BUN (control) = 16.6 ± 3.3 mg/dL; serum creatinine (control) = 0.5 ± 0.0 mg/dL; NAG (control) =20.3 ± 10.6 (U/g creatinine); urinary Kim-1 (control) = 165.9 ± 141 (pg/mg creatinine); kidney Kim-1/Havcr1 = 1.2 ± 0.7. Asterisks indicate statistically significant difference (p < 0.05) compared to control group (n = 6 for each group).
Time Course Studies
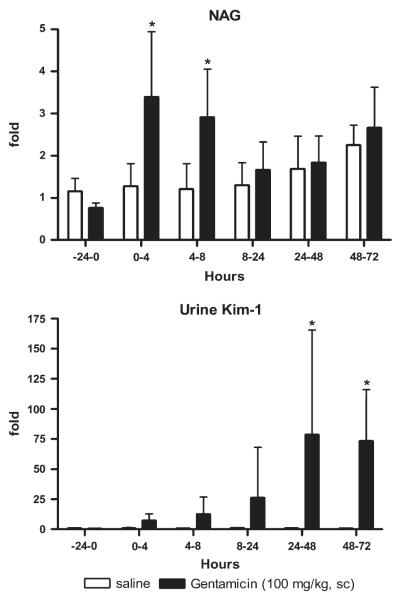
A statistically significant, threefold increase in urinary NAG was observed during 0–4 and 4–8 h after the third sc injection of 100 mg/kg gentamicin (Fig. 5). In subsequent collection intervals encompassing 8–72 h, NAG values were lower and not significantly different from controls. In contrast, urine Kim-1 increased 7-, 12-, 26-, 78-, and 73-fold for the 0- to 4, 4- to 8, 8- to 24, 24- to 48, and 48- to 72 h intervals, respectively, above controls (59.1 ± 17.6 pg/mg creatinine), and the increases were statistically significant compared to controls for intervals between 24–72 h (Fig. 5).
FIG. 5.
NAG and Kim-1 levels in urine collected for various intervals after treatment with gentamicin (100 mg/kg, sc). A 24-h preinjection urine sample was collected prior to the injections of gentamicin as described in Materials and Methods, and urine was collected from the same rats in metabolism cages at intervals of 0–4, 4–8, 8–24, 24–48, and 48–72 h commencing immediately after the third sc injection. Urinary NAG and Kim-1 are normalized to urinary creatinine. Relative fold changes of NAG and urinary Kim-1 for each animal at each time interval were calculated by dividing the amount by the average amount from pretreatment (-24–0 h) samples of all animals including control and chemical-treated groups. NAG (pretreatment) = 12.7 ± 3.9 U/g creatinine; urinary Kim-1 (pretreatment) = 59.1 ± 17.6 pg/mg creatinine. Asterisks indicate statistically significant difference (p < 0.05) compared to control group (n = 6 for each group).
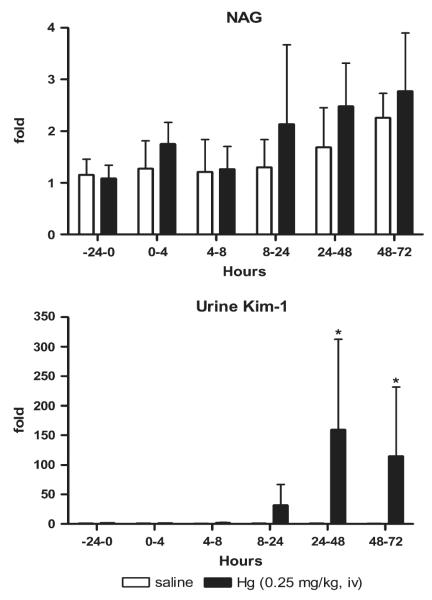
After treatment with 0.25 mg Hg/kg, no significant increases in urinary NAG were observed relative to controls for all intervals from 0 to 72 h (Fig. 6). In contrast, urinary Kim-1 increased 30-, 140-, 114-fold at the 8- to 24, 24- to 48, and 48- to 72 h intervals, respectively, above controls (59.1 ± 17.6 pg/mg creatinine) and the increases were statistically significant compared to saline controls between 24 and 72 h.
FIG. 6.
NAG and Kim-1 levels in urine for various intervals after treatment with Hg (0.25 mg/kg, iv). A 24-h preinjection urine sample was collected, and urine was collected from the same rats in metabolism cages at intervals of 0–4, 4–8, 8–24, 24–48, and 48–72 h commencing immediately after the single injection. Urinary NAG and Kim-1 are normalized to urinary creatinine. Relative fold changes of NAG and urinary Kim-1 for each animal at each time interval were calculated by dividing the amount by the average amount from pretreatment samples of all animals including control and chemical-treated groups. NAG (pretreatment) = 12.7 ± 3.9 U/g creatinine; urinary Kim-1 (pretreatment) = 59.1 ± 17.6 pg/mg creatinine. Asterisks indicate statistically significant difference ( p < 0.05) compared to control group (n = 6 for each group).
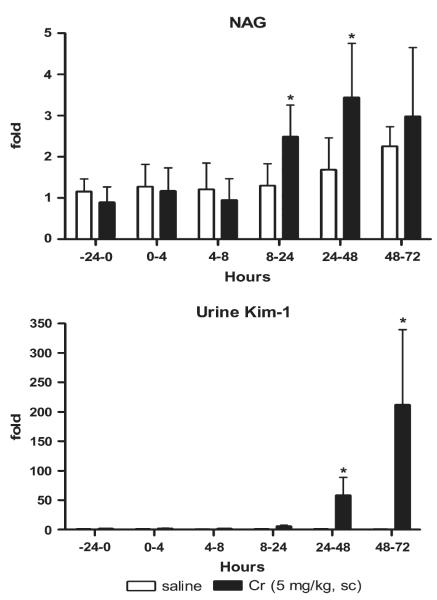
After treatment with 5 mg Cr/kg, urinary NAG increased twofold higher than controls for the 8- to 24, 24- to 48, and 48- to 72 h intervals, but the increases were statistically significant only at the earlier two intervals (Fig. 7). Urinary Kim-1 concentrations increased 6-, 58- and 212-fold at the 8- to 24, 24- to 48, and 48- to 72 h intervals, respectively, above controls (59.1 ± 17.6 pg/mg creatinine) and were statistically different from controls from 24 to 72 h.
FIG. 7.
NAG and Kim-1 in urine for various intervals following treatment with Cr (5 mg/kg). A 24-h preinjection urine sample was collected, and urine was collected from the same rats in metabolism cages at intervals of 0–4, 4–8, 8–24, 24–48, and 48–72 h commencing immediately after the single injection. Urinary NAG and Kim-1 are normalized by urinary creatinine. Relative fold changes of NAG and urinary Kim-1 for each animal at each time interval were calculated by dividing the amount by the average amount from pretreatment samples of all animals including control and chemical-treated groups. NAG (pretreatment) = 12.7 ± 3.9 U/g creatinine; urinary Kim-1 (pretreatment) = 59.1 ± 17.6 pg/mg creatinine. Asterisks indicate statistically significant difference ( p < 0.05) compared to control group (n = 6 for each group).
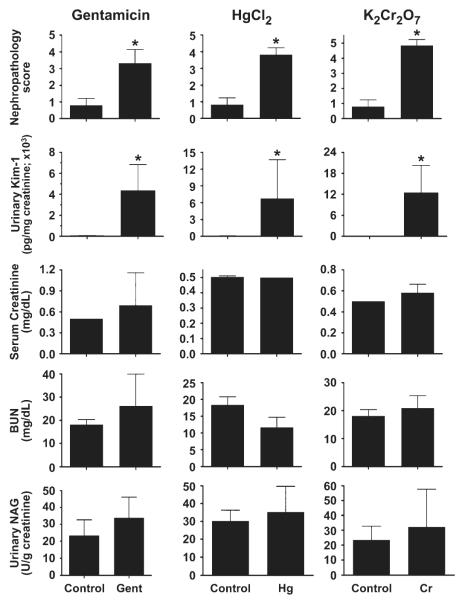
At 72 h after treatment with any of the three nephrotoxicants, rats were euthanized and blood collected for BUN and blood creatinine analyses and kidneys preserved for histopathological and immunohistochemical evaluation. These data were compared with urinary biomarkers for the last collection interval (48–72 h; Fig. 8). Renal histopathology scores indicated a significant degree of renal injury compared to controls after treatment with gentamicin (100 mg/kg), Hg (0.25 mg/kg), or Cr (5 mg/kg). Urinary Kim-1 levels significantly increased after exposure to each nephrotoxicant and were statistically significant, in parallel with the nephropathy scores. Other biomarkers—BUN, creatinine, and urinary NAG—were not different from controls 72 h after treatments.
FIG. 8.
Comparison of urinary Kim-1 with routinely used biomarkers BUN, creatinine, and NAG and nephropathy score for tubule injury 72 h after gentamicin (100 mg/kg, sc), Hg (0.25 mg/kg, iv), Cr (5 mg/kg, sc) administration. Urinary NAG and Kim-1 are normalized to urinary creatinine. Asterisks indicate statistically significant difference ( p < 0.05) compared to control group (n = 6 for each group).
Galactosamine Hepatotoxicity and Urinary Kim-1
At 12 and 24 h after treatment with galactosamine, serum ALT activity was markedly elevated, suggestive of frank liver injury (Table 1). In contrast, no increase in urinary Kim-1 was detected with galactosamine-induced hepatotoxicity compared to saline controls, indicating that Kim-1 excretion in urine is a specific marker of renal injury and not hepatic injury.
TABLE 1.
Serum ALT Activity and Urinary Kim-1 Levels 12 and 24 h After Administration of a Hepatotoxic Dose of Galactosamine (1.1 g/kg, ip)
| Treatment | Serum ALT (U/l) | Urinary Kim-1 (pg/ml) |
|---|---|---|
| Control | 45 ± 6 | 102.8 ± 49.2 |
| Galactosamine, 12 h | 557 ± 355* | 73.6 ± 13.2 |
| Galactosamine, 24 h | 2377 ± 1851* | 90.5 ± 34.9 |
p < 0.05 compared to control group (n = 5 for each group).
DISCUSSION
The development of sensitive, specific, and early biomarkers of AKI will enhance the detection of the nephrotoxic potential of drug candidates and compounds released unintentionally from medical devices during preclinical studies. Better nephrotoxicity biomarkers will permit earlier diagnosis of AKI and allow medical personnel to intervene sooner to preserve residual renal function in the clinical or hospital setting and improve health outcomes. In the present study, our goal was to determine if Kim-1, a new nephrotoxicity biomarker, represents a more sensitive and early biomarker of acute tubular injury compared to traditional, routinely used biomarkers of nephrotoxicity.
Kim-1 is a type 1 transmembrane protein that contains immunoglobulin (Ig) and highly O- and N-glycosylated mucin domains in its ectodomain and a relatively short cytoplasmic tail (Ichimura et al., 1998). The upregulation of Kim-1/Havcr1 gene expression and the presence of the Kim-1 ectodomain in the urine has been reported in postischemic rat kidney; in a nontoxic model of acute massive proteinuria, protein-overload nephropathy; in humans with ischemic acute tubular necrosis and renal cell carcinoma; and after exposure to nephrotoxicants with different mechanisms of action: S-(1,1,2,2-tetrafluoroethyl)-L-cysteine, folic acid, and cisplatin (Han et al., 2002, 2005; Ichimura et al., 2004; Kuehn et al. 2002; Vaidya et al., 2006; van Timmeren et al., 2006). Therefore, Kim-1 has been suggested to serve as a useful general biomarker for renal proximal tubule injury in preclinical and clinical studies of drug safety evaluation, chemicalrelated renal injury, and the monitoring of renal disease states. In the current study, three well-established AKI models—gentamicin, a clinically relevant aminoglycoside antibiotic, and Hg and Cr, two nephrotoxic metals—were used to compare the sensitivity of Kim-1 to BUN and serum creatinine, two routinely used biomarkers in preclinical and clinical regimens, and urinary NAG, a lysosomal enzyme found predominantly in proximal tubules. Furthermore, the relationship between urinary Kim-1 excretion and kidney Kim-1/Havcr1 gene expression with renal pathology was investigated.
In the dose-response study, urinary Kim-1 and kidney Kim-1/Havcr1 mRNA expression are very sensitive to the renal injury produced by gentamicin, a potent broad-spectrum aminoglycoside that is commonly used in the treatment of severe Gramnegative bacterial infections (Cunha and Schor, 2002). Gentamicin accumulates in the epithelial cells of renal proximal tubules, leading to structural changes and functional impairments of the plasma membrane, mitochondria, and lysosome (Ali, 1995; Olbricht et al., 1991). Nephrotoxicity is a dose-limiting side effect of gentamicin. In the present study, histopathology observations showed that a single dose of 150 mg/kg gentamicin for 3 days produced a modest degree of renal tubule injury (necrosis in ≤ 25% of the tubules). At this low degree of injury, urinary Kim-1 protein increased 30-fold and kidney Kim-1/Havcr1 expression increased 112-fold, while BUN, serum creatinine, and urinary NAG did not change after treatment with this dose. In fact, these routinely used nephrotoxicity biomarkers were not significantly elevated except at the highest dose of 400 mg/kg, a dose used to produce AKI and tubular necrosis in laboratory animal models.
The results of the current study indicated that urinary Kim-1 and kidney Kim-1/Havcr1 expression were more sensitive biomarkers for nephrotoxicity induced by Hg. Kidney proximal tubules, in particular the pars recta or S3 segments, are the primary targets where mercuric ions accumulate and express toxicity after exposure to elemental or inorganic forms of Hg; convoluted portions (S1 and S2 segments) of the proximal tubule can also be involved when the toxic effect is more severe (Diamond and Zalups, 1998). Hg has a strong affinity for sulfhydryl groups on molecules such as glutathione, cysteine, metallothionein, and other proteins in the body (Johnson, 1982; Zalups, 2000). Binding to key enzymes and structural or functional proteins has been proposed to cause the Hg toxicity (Boadi et al., 1991). The effects of Hg on intracellular thiol metabolism, oxidative stress, lipid peroxidation, mitochondrial function, and intracellular distribution of calcium ions may also play a role in nephropathy induced by Hg (Mahboob et al., 2001; Zalups, 2000). In the current study, a dose of 0.25 mg/kg Hg induced renal injury involving 25–50% of the proximal tubules while a dose of 0.5 mg/kg Hg induced histopathologic lesions involving 50–75% of tubules. Increases of urinary Kim-1 (14-fold) and kidney Kim-1/Havcr1 mRNA (71-fold) were detected following a single injection of 0.25 mg/kg Hg. Increases in BUN, creatinine, and urinary NAG were evident only at doses of 0.5 mg Hg/kg or higher, and the fold-increase was much smaller than that of Kim-1. An unusual response was observed at the highest dose of Hg, 1 mg/kg, where mean urinary Kim-1 elevated fivefold, but this level was not significantly different from control levels while kidney Kim-1/Havcr1 expression increased by 167-fold. A possible explanation for the markedly reduced appearance of Kim-1 in urine may be related to the severe renal injury produced at the highest dose of 1 mg/kg which resulted in a marked decrease in Kim-1 protein synthesis. In our experience, a high rate of mortality is observed in rats treated with 1 mg/kg after 3–4 days of exposure. Other possible mechanisms may explain this unexpected response. First, the urinary excretion of Hg increases due to the administration of high-dose Hg in part due to the release of Hg from necrotic proximal tubular epithelial cells (Madsen and Hansen, 1980). The Ig domain of Kim-1 contains six cysteine residues. The high bonding affinity between Hg and sulfhydryl groups in cysteine might change the structure of Kim-1 Ig domain. The sandwich Kim-1 ELISA assay employed in this study uses monoclonal antibodies made against the purified ectodomain of Kim-1. Therefore, the high concentration of urinary Hg may interfere with the Kim-1 assay while not affecting kidney Kim-1/Havcr1 mRNA expression measured by RT-PCR via a similar mechanism. Alternatively, the cleavage of Kim-1 ectodomain into urine has been suggested to be mediated by a matrix metalloproteinase (Bailly et al., 2002). A high dose of Hg has been reported to markedly inhibit the activities of several enzymes, e.g., glutathione disulfide reductase and glutathione peroxidase in proximal tubule epithelial cells (Addya et al., 1984; Chung et al., 1982). The metalloproteinase might be inhibited after a high dose of Hg but not at lower doses of Hg. Another possibility is that the structure of the proteolytic site of Kim-1 might be altered by Hg which blocked the cleavage and shedding of the ectodomain, resulting in a reduced Kim-1 excretion into urine.
Acute tubular necrosis induced by Cr salts has been used as a model to study AKI (Biber et al., 1968; Wedeen and Qian, 1991). Convoluted proximal tubules (S1 and S2 segments) constitute the site where Cr selectively accumulates and produces necrosis (Wedeen and Qian, 1991). Oxidative and nitrosative stress-related injury has been associated with Cr-induced nephrotoxicity (Barrera et al., 2003; Pedraza-Chaverri et al., 2005). In the current study, results from the Cr dose-response suggested that urinary NAG is a good biomarker for Cr nephrotoxicity. An increase of NAG by threefold at 5 mg/kg Cr was observed which was statistically significant from control. At the same dose, a trend for increases in urinary Kim-1 (twofold) and kidney Kim-1/Havcr1 expression (fivefold) were observed; however, statistically significant increases in these two markers were not evident except at higher doses ≥ 10 mg/kg Cr, an outcome related perhaps to the high variability in the urinary Kim-1 data in the control group for the Cr experiments.
A time-dependent increase in nephrotoxicity was observed for each of the three nephrotoxic agents for intervals from 0 to 72 h posttreatment. With gentamicin, a progressive increase in urinary Kim-1 levels was observed as early as 0–4 h and levels continuously increased to 72-fold compared to controls at 24–48 h and 48–72 h. An unexpected early and transient response for urinary NAG was observed after gentamicin treatment. Following treatment with either Hg or Cr, the appearance of Kim-1 in urine was evident as early as 8–24 h after treatment with Hg (30-fold increase) and Cr (fivefold increase). Marked increases in urinary Kim-1 of magnitudes ranging from 50- to 200-fold were observed from 24–48 h and 48–72 h after treatment with Hg or Cr. While the histopathology indicated ∼50–75% injured tubules at 72 h after nephrotoxicant treatment (Fig. 8), only Kim-1 increased dramatically while some nonresponses (e.g., Hg) or transient, mild responses after some treatments (gentamicin, Cr) were observed with NAG. Thus, the marked increases of Kim-1 at 48–72 h posttreatment were consistently correlated to the degree of nephropathology severity. These responses are in agreement with the possible function of Kim-1. As a putative epithelial cell adhesion molecule, Kim-1 may play an important role in proliferation and regeneration of epithelial cells to restore the function and morphological integrity of kidneys (Ichimura et al., 1998). Depending on the kinetics of the upregulation of Kim-1/Havcr1 mRNA expression and Kim-1 protein synthesis, the repair process might occur a few hours later than the toxic cell injury. The immunohistochemical experiments confirmed that Kim-1 protein is present in damaged renal tubular cells, which provides additional evidence for its role in cellular repair (Fig. 1).
In this study, two of six rats treated with 5 mg/kg Cr presented with renal cell carcinoma or adenofibroma at necropsy, an unexpected and extremely rare observation. Due to the very short exposure time and experimental design, these tumors were unlikely related to Cr treatment or age (10–12 weeks of age at time of injections) and may have been spontaneous. Nonetheless, urinary Kim-1 levels were significantly elevated in these two rats while BUN, serum creatinine, and NAG did not significantly change. Positive Kim-1 immunostaining was also evident in the tumor cells. Urinary human Kim-1 (hKIM-1) levels were reported to be significantly higher in patients with clear cell renal cell carcinoma while serum creatinine remained similar to the normal group (Han et al., 2005). Immunohistochemical expression of hKIM-1 was found to be specific for several subtypes of renal cell carcinoma but not in most other human neoplasms tested (Lin et al., 2007). These results support other studies that suggest that urinary Kim-1 may serve as a new biomarker for early detection of renal cell carcinoma; however, the current study was not designed to test whether an increase in urinary Kim-1 was able to differentiate carcinoma from other renal injury.
The specificity of urinary Kim-1 as a renal injury biomarker was investigated in rats injected with the hepatotoxicant galactosamine. Galactosamine treatment produced marked increases in serum ALT after 12 and 24 h, demonstrating severe hepatic injury; however, urinary concentrations of Kim-1 at these same time points were no different from controls. This experiment was critical because a splice variant of Kim-1/Havcr1, a gene isolated from monkey kidney cells that codes for a receptor for the hepatitis A virus, is expressed in liver (Kaplan et al., 1996) and several human organs and tissues (Feigelstock et al., 1998). In studies interrogating the liver genome after treatment with hepatotoxic agents, no increase in HAVcr-1 gene expression has been reported (Jessen et al., 2003). Results from the current study and other genomic studies suggest that the appearance of Kim-1 in urine is tightly linked to the renal injury and not liver injury.
The value of a biomarker also relies on whether the method of assay is simple, cheap, and fast. A sensitive high-throughput method has been developed to quantify urinary Kim-1 by a sandwich ELISA (Vaidya et al., 2006) and now a Luminex-based bead assay (Liangos et al., 2007). Another methodological advantage of Kim-1 is that it is stable in urine and no stabilizing buffer needed for the collected urine samples prior to freezing and storage for later analysis.
In conclusion, a consistent pattern of marked elevations in urinary Kim-1 concentrations and kidney Kim-1/Havcr1 expression was observed using three different agents with known nephrotoxic potential. Under the experimental conditions of the current studies, these two biomarkers were elevated earlier during renal tubular pathogenesis than the currently accepted, routinely used nephrotoxicity biomarkers and, hence, appear to be more sensitive nephrotoxicity biomarkers. The increases in urinary Kim-1 protein and kidney Kim-1/Havcr1 mRNA levels in response to the three nephrotoxicants were also more closely anchored to the increases in severity in renal histopathology than BUN and serum creatinine. As a noninvasive indicator of renal proximal tube injury, urinary Kim-1 was elevated at early stages of the injury, and the elevations were sustained throughout the progression of cell injury to proliferation and regeneration. Positive immunoreactivity of Kim-1 in kidneys from rats treated with nephrotoxicants confirmed that this protein is synthesized in response to renal injury. Additional studies are needed to establish the kinetics and potential recovery/reversibility of these responses under chronic exposure conditions to wider spectrum of nephrotoxicants and control compounds. Therefore, the data presented in the report suggest that urinary Kim-1 and kidney Kim-1/Havcr1 gene expression may serve as potentially valuable nephrotoxicity biomarkers. These biomarkers could improve the identification of nephrotoxic compounds in preclinical evaluations of compounds, for monitoring the progression of renal pathogenesis in clinical evaluations of drugs and exposures to residues and contaminants associated with medical devices, and for exposures to toxicants in occupational and environmental exposures.
ACKNOWLEDGMENTS
We thank Ms Zoreh Vakili and Ms Ashley Johnson for assistance in conducting biochemical analyses and Ms Jacintha Tolson for assistance with animal treatments and sample collection.
FUNDING U.S. Food and Drug Administration and National Institutes of Health grants DK 039773, DK 072831, and DK 074099 (to J.V.B.); the American Heart Association (Scientist Development grant 0535492T to V.S.V.). Y.Z. was supported in part by an appointment to the Research Fellowship Program administered by the Oak Ridge Associated Universities through a contract with the U.S. Food and Drug Administration.
REFERENCES
- Addya S, Chakravarti K, Basu A, Santra M, Haldar S, Chatterjee GC. Effects of mercuric chloride on several scavenging enzymes in rat kidney and influence of vitamin E supplementation. Acta Vitaminol. Enzymol. 1984;101(1):159–170. [PubMed] [Google Scholar]
- Ali BH. Gentamicin nephrotoxicity in humans and animals: Some recent research. Gen. Pharmacol. 1995;26(7):1477–1487. doi: 10.1016/0306-3623(95)00049-6. [DOI] [PubMed] [Google Scholar]
- Bailly V, Zhang Z, Meier W, Cate R, Sanicola M, Bonventre JV. Shedding of kidney injury molecule-1, a putative adhesion protein involved in renal regeneration. J. Biol. Chem. 2002;277(42):39739–39748. doi: 10.1074/jbc.M200562200. [DOI] [PubMed] [Google Scholar]
- Barrera D, Maldonado PD, Medina-Campos ON, Hernandez-Pando R, Ibarra-Rubio ME, Pedraza-Chaverri J. HO-1 induction attenuates renal damage and oxidative stress induced by K2Cr2O7. Free. Radic. Biol. Med. 2003;34(11):1390–1398. doi: 10.1016/s0891-5849(03)00068-6. [DOI] [PubMed] [Google Scholar]
- Biber TU, Mylle M, Baines AD, Gottschalk CW, Oliver JR, MacDowell MC. A study by micropuncture and microdissection of acute renal damage in rats. Am. J. Med. 1968;44(5):664–705. doi: 10.1016/0002-9343(68)90251-9. [DOI] [PubMed] [Google Scholar]
- Boadi WY, Urbach J, Barnea ER, Brandes JM, Yannai S. In vitro effect of mercury on aryl hydrocarbon hydroxylase, quinone reductase, catecholamine-O-methyltransferase and glucose-6-phosphate dehydrogenase activities in term human placenta. Pharmacol. Toxicol. 1991;68(5):317–321. doi: 10.1111/j.1600-0773.1991.tb01246.x. [DOI] [PubMed] [Google Scholar]
- Chertow GM, Burdick E, Honour M, Bonventre JV, Bates DW. Acute kidney injury, mortality, length of stay, and costs in hospitalized patients. J. Am. Soc. Nephrol. 2005;16(11):3365–3370. doi: 10.1681/ASN.2004090740. [DOI] [PubMed] [Google Scholar]
- Chung AS, Maines MD, Reynolds WA. Inhibition of the enzymes of glutathione metabolism by mercuric chloride in the rat kidney: Reversal by selenium. Biochem. Pharmacol. 1982;31(19):3093–3100. doi: 10.1016/0006-2952(82)90085-5. [DOI] [PubMed] [Google Scholar]
- Cunha MA, Schor N. Effects of gentamicin, lipopolysaccharide, and contrast media on immortalized proximal tubular cells. Ren. Fail. 2002;24(6):687–690. doi: 10.1081/jdi-120015662. [DOI] [PubMed] [Google Scholar]
- de Borst MH, van Timmeren MM, Vaidya VS, de Boer RA, van Dalen MB, Kramer AB, Schuurs TA, Bonventre JV, Navis G, van Goor H. Induction of kidney injury molecule-1 in homozygous Ren2 rats is attenuated by blockade of the renin-angiotensin system or p38 MAP kinase. Am. J. Physiol. Renal. Physiol. 2007;292(1):F313–F320. doi: 10.1152/ajprenal.00180.2006. [DOI] [PubMed] [Google Scholar]
- Diamond GL, Zalups RK. Understanding renal toxicity of heavy metals. Toxicol. Pathol. 1998;26(1):92–103. doi: 10.1177/019262339802600111. [DOI] [PubMed] [Google Scholar]
- Feigelstock D, Thompson P, Mattoo P, Zhang Y, Kaplan GG. The human homolog of HAVcr-1 codes for a hepatitis A virus cellular receptor. J. Virol. 1998;72(8):6621–6628. doi: 10.1128/jvi.72.8.6621-6628.1998. [DOI] [PMC free article] [PubMed] [Google Scholar]
- Food and Drug Administration (FDA) Challenge and Opportunity on the Critical Path to New Medical Products. U.S. Dept. Health and Human Services; 2004. www.fda.gov/oc/initiatives/criticalpath. [Google Scholar]
- Han WK, Alinani A, Wu CL, Michaelson D, Loda M, McGovern FJ, Thadhani R, Bonventre JV. Human kidney injury molecule-1 is a tissue and urinary tumor marker of renal cell carcinoma. J. Am. Soc. Nephrol. 2005;16(4):1126–1134. doi: 10.1681/ASN.2004070530. [DOI] [PMC free article] [PubMed] [Google Scholar]
- Han WK, Bailly V, Abichandani R, Thadhani R, Bonventre JV. Kidney injury molecule-1 (KIM-1): A novel biomarker for human renal proximal tubule injury. Kidney Int. 2002;62(1):237–244. doi: 10.1046/j.1523-1755.2002.00433.x. [DOI] [PubMed] [Google Scholar]
- Ichimura T, Bonventre JV, Bailly V, Wei H, Hession CA, Cate RL, Sanicola M. Kidney injury molecule-1 (KIM-1), a putative epithelial cell adhesion molecule containing a novel immunoglobulin domain, is up-regulated in renal cells after injury. J. Biol. Chem. 1998;273(7):4135–4142. doi: 10.1074/jbc.273.7.4135. [DOI] [PubMed] [Google Scholar]
- Ichimura T, Hung CC, Yang SA, Stevens JL, Bonventre JV. Kidney injury molecule-1: A tissue and urinary biomarker for nephrotoxicant-induced renal injury. Am. J. Physiol. Renal Physiol. 2004;286(3):F552–F563. doi: 10.1152/ajprenal.00285.2002. [DOI] [PubMed] [Google Scholar]
- Idee JM. Renal safety pharmacology: Value of sensitized experimental models. Therapie. 2000;55(1):91–96. [PubMed] [Google Scholar]
- Jessen BA, Mullins JS, De PA, Stevens GJ. Assessment of hepatocytes and liver slices as in vitro test systems to predict in vivo gene expression. Toxicol. Sci. 2003;75(1):208–222. doi: 10.1093/toxsci/kfg172. [DOI] [PubMed] [Google Scholar]
- Johnson DR. Role of renal cortical sulfhydryl groups in development of mercury-induced renal toxicity. J. Toxicol. Environ. Health. 1982;9(1):119–126. doi: 10.1080/15287398209530147. [DOI] [PubMed] [Google Scholar]
- Kaplan G, Totsuka A, Thompson P, Akatsuka T, Moritsugu Y, Feinstone SM. Identification of a surface glycoprotein on African green monkey kidney cells as a receptor for hepatitis A virus. EMBO J. 1996;15(16):4282–4296. [PMC free article] [PubMed] [Google Scholar]
- Kuehn EW, Park KM, Somlo S, Bonventre JV. Kidney injury molecule-1 expression in murine polycystic kidney disease. Am. J. Physiol. Renal Physiol. 2002;283(6):F1326–F1336. doi: 10.1152/ajprenal.00166.2002. [DOI] [PubMed] [Google Scholar]
- Liangos O, Perianayagam MC, Vaidya VS, Han WK, Wald R, Tighiouart H, Mackinnon RW, Li L, Balakrishnan VS, Pereira BJ, et al. Urinary N-acetyl-{beta}-(D)-glucosaminidase activity and kidney injury molecule-1 level are associated with adverse outcomes in acute renal failure. J. Am. Soc. Nephrol. 2007;18:904–912. doi: 10.1681/ASN.2006030221. [DOI] [PubMed] [Google Scholar]
- Lin F, Zhang PL, Yang XJ, Shi J, Blasick T, Han WK, Wang HL, Shen SS, Teh BT, Bonventre JV. Human kidney injury molecule-1 (hKIM-1): A useful immunohistochemical marker for diagnosing renal cell carcinoma and ovarian clear cell carcinoma. Am. J. Surg. Pathol. 2007;31(3):371–381. doi: 10.1097/01.pas.0000213353.95508.67. [DOI] [PubMed] [Google Scholar]
- Madsen KM, Hansen JC. Subcellular distribution of mercury in the rat kidney cortex after exposure to mercuric chloride. Toxicol. Appl. Pharmacol. 1980;54(3):443–453. doi: 10.1016/0041-008x(80)90171-4. [DOI] [PubMed] [Google Scholar]
- Mahboob M, Shireen KF, Atkinson A, Khan AT. Lipid peroxidation and antioxidant enzyme activity in different organs of mice exposed to low level of mercury. J. Environ. Sci. Health B. 2001;36(5):687–697. doi: 10.1081/PFC-100106195. [DOI] [PubMed] [Google Scholar]
- Matzke GR, Frye RF. Drug administration in patients with renal insufficiency. Minimising renal and extrarenal toxicity. Drug Saf. 1997;16(3):205–231. doi: 10.2165/00002018-199716030-00005. [DOI] [PubMed] [Google Scholar]
- Nally JV., Jr. Acute renal failure in hospitalized patients. Cleve. Clin. J. Med. 2002;69(7):569–574. doi: 10.3949/ccjm.69.7.569. [DOI] [PubMed] [Google Scholar]
- Olbricht CJ, Fink M, Gutjahr E. Alterations in lysosomal enzymes of the proximal tubule in gentamicin nephrotoxicity. Kidney Int. 1991;39(4):639–646. doi: 10.1038/ki.1991.76. [DOI] [PubMed] [Google Scholar]
- Pedraza-Chaverri J, Barrera D, Medina-Campos ON, Carvajal RC, Hernandez-Pando R, Macias-Ruvalcaba NA, Maldonado PD, Salcedo MI, Tapia E, Saldivar L, et al. Time course study of oxidative and nitrosative stress and antioxidant enzymes in K2Cr2O7-induced nephrotoxicity. BMC Nephrol. 2005;6(1):4. doi: 10.1186/1471-2369-6-4. [DOI] [PMC free article] [PubMed] [Google Scholar]
- Perez-Rojas J, Blanco JA, Cruz C, Trujillo J, Vaidya VS, Uribe N, Bonventre JV, Gamba G, Bobadilla NA. Mineralocorticoid receptor blockade confers renoprotection in preexisting chronic cyclosporine nephrotoxicity. Am. J. Physiol. Renal Physiol. 2007;292(1):F131–F139. doi: 10.1152/ajprenal.00147.2006. [DOI] [PubMed] [Google Scholar]
- Schnellman RG. Toxic response of the kidney. In: Klaassen CD, editor. Casarett and Doull’s Toxicology—The Basic Science of Poisons. McGraw-Hill; New York: 2001. pp. 491–514. [Google Scholar]
- Vaidya VS, Ramirez V, Bobadilla NA, Bonventre JV. A microfluidics based assay to measure kidney injury molecule-1 (Kim-1) in the urine as a biomarker for early diagnosis of acute kidney injury. J. Am. Soc. Nephrol. 2005;16:192A. (Abstract) [Google Scholar]
- Vaidya VS, Ramirez V, Ichimura T, Bobadilla NA, Bonventre JV. Urinary kidney injury molecule-1: A sensitive quantitative biomarker for early detection of kidney tubular injury. Am. J. Physiol. Renal Physiol. 2006;290(2):F517–F529. doi: 10.1152/ajprenal.00291.2005. [DOI] [PubMed] [Google Scholar]
- van Timmeren MM, Bakker SJ, Vaidya VS, Bailly V, Schuurs TA, Damman J, Stegeman CA, Bonventre JV, van Goore H. Tubular kidney injury molecule-1 in protein-overload nephropathy. Am. J. Physiol. Renal Physiol. 2006;291(2):F456–F464. doi: 10.1152/ajprenal.00403.2005. [DOI] [PubMed] [Google Scholar]
- Wedeen RP, Qian LF. Chromium-induced kidney disease. Environ. Health Perspect. 1991;92:71–74. doi: 10.1289/ehp.92-1519395. [DOI] [PMC free article] [PubMed] [Google Scholar]
- Zalups RK. Molecular interactions with mercury in the kidney. Pharmacol. Rev. 2000;52(1):113–143. [PubMed] [Google Scholar]


