Abstract
Profiling changes in the concentration of functionally related peptide hormones is critical to understanding the etiology of many diseases and therapies. We present novel data utilizing nano LC-MS to simultaneously measure a select group of vasoactive peptides (angiotensin, bradykinin and related hormones) in 50 μl plasma samples enabling repeated sampling in rodent models. By chromatographically resolving target peptides and using “multiple reaction monitoring” to enhance MS sensitivity, linear responses down to 10−17 mol were achieved. Purification of plasma peptides by either methanol precipitation or offline HPLC fractionation enabled the detection of endogenous peptides and revealed approaches for enhancing recovery. As proof of principle, seven vasoactive peptides were profiled before, during and after acute angiotensin converting enzyme (ACE) inhibition in an anesthetized rat. Of note was an apparent 10 fold increase in vasodilatory bradykinin that reversed after drug infusion but relatively minor changes in angiotensin II levels. Targeted MS analysis used to profile functionally related peptides or other analytes will greatly enhance our ability to define the sequence of events regulating complex and dynamic physiological processes.
Keywords: quantitative MS, vasoactive peptides, angiotensin, bradykinin, ACEi, nonspecific adsorption
INTRODUCTION
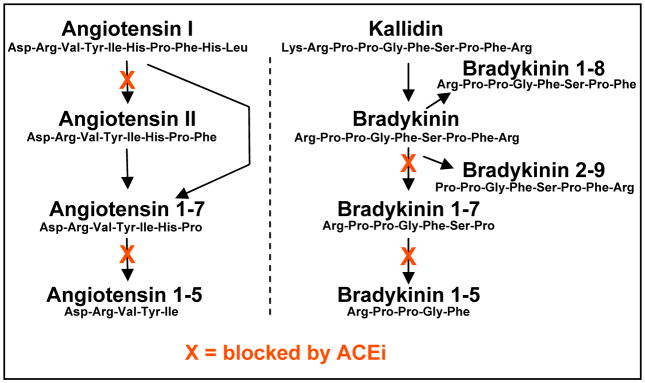
Important pathologies such as diabetes, septic shock and hypertension are associated with the deregulation of peptide hormone action. Therapy for these conditions include the administration of natural and synthetic receptor ligands {reviewed in (1–3)} or the targeted blockade of enzyme activity to control production and degradation {reviewed in (4–6)}. However, the diagnosis of pathology and the modalities of therapy, are most often defined by endpoints such as blood pressure without ever evaluating the endogenous effectors at play. Indeed, it would seem highly advantageous to profile multiple functionally related peptides within a sample in order to better understand the etiology of hormone deregulation and the impact of therapeutic interventions. The regulation of peptide hormone action is dynamic, in large part due to the continuous enzymatic production and degradation establishing the effective concentration of different ligands relative to each other. In fact, bioactive fragments derived from common precursor proteins may have complementary, opposing or totally unique biological effects (7–13) and entirely different families of peptides share common processing enzymes (6, 8, 11, 14–17) (Figure 1).
Figure 1. Vasoactive peptides are substrates for ACE activity.
Multiple cleavage products of both angiotensin I and bradykinin are known to regulate vascular tone, acting as ligands for specific receptors. Peptide processing by angiotensin converting enzymes (ACE) is a target for anti-hypertensive pharmacotherapy aiming to shift the concentration of these vasoactive peptides. Multiple steps in the synthesis and/or degradation of each peptide family are blocked by ACE inhibition (ACEi) but little is known regarding the relative changes in concentration among the various hormones.
Traditionally, customized immunoassays have enabled detection of select plasma proteins and peptides in the [10−12–10−10M] range at relatively low cost. However, their utility in absolute quantitation is limited by varying degrees of primary antibody cross-reactivity since the precursors and cleavage products of peptide hormones necessarily have common antigenic features (18, 19). Sample purification and fractionation has been used to reduce cross reactivity or enable multiple analyses of a given sample (20, 21) but immunoassays remain limited by the availability of primary antibodies and procedures which are labor/time intensive. Recently, a remarkable increase in the resolving power and sensitivity of tandem liquid chromatography-mass spectrometry (LC-MS) has been achieved through nano-scale fluidics and multiple (or selected) reaction monitoring (MRM). The potential to improve on the detection limits of immunoassays, eliminate cross reactivity artifacts and enable the simultaneous measurement of multiple analytes within a single sample has been recognized (22). To date however, most plasma proteomic and peptidomic studies using LC-MS have naturally focused on screening large numbers of unknown components such as enzymatic digests (23–25). Fewer studies have aimed at optimizing the measurement of specific peptide hormones and for the most part analyzed products generated in vitro by the addition of supra-physiological amounts of precursor (9, 26). Impediments to quantifying endogenous low abundance plasma peptides using LC–MS are well recognized (22, 27) and necessitate sample purification in order to eliminate high abundance components that can suppress ionization or generate excessive signal noise.
We present findings obtained from work aimed at investigating the quantitative aspects of low abundance peptide detection and plasma purification. A primary objective of this undertaking was to develop a methodology utilizing small plasma samples in order to enable innocuous repeated sampling from rats and mice (28–30). We focused attention on a group of peptide hormones that play an important role in the control of vascular tone and electrolyte homeostasis; vasopressin (anti diuretic hormone: ADH), components of the kallilkrein-kinin system (kallidin, bradykinin, des arg9-bradykinin and des arg1-bradykinin; KD, BK, BK 1-8 and BK 2-9), and the renin-angiotensin system (angiotensin I, angiotensin II and angiotensin 1-7; Ang I, Ang II and Ang1-7). The plasma concentration of these small peptides (<1.5 k MW) is normally in the [10−10-10−12M] range, such that 10 μl of plasma can be expected to contain roughly 10−15-10−17 mol of each peptide, a value well within established limits of detection for state of the art instruments. Particular care was taken in assessing the impact of non-specific sample depletion inherent in the processing of small samples. Validation of the methods using known standards and stock plasma helped identify some of the pitfalls and key factors limiting quantitative analysis. Finally, we demonstrate the utility and power of this novel approach in vivo with a time-course experiment profiling the change in plasma composition of seven bioactive peptides before, during and after acute angiotensin converting enzyme inhibition (ACEi). To our knowledge, this report is the first to provide time-course data utilizing LC-MS to measure multiple vasoactive peptide hormones in plasma.
METHODS
Sample preparation
Analytical and HPLC grade chemicals were purchased from Sigma (St Louis, MO) unless otherwise specified. Only low binding 1.5 ml vials (Eppendorph, Hamburg, Germany) and low retention pipette tips (Denville, Metuchen, NJ) were utilized to store stock solutions and prepare test solutions. Test solutions were prepared using 50 μl aliquots of pure peptides ([10−6M], Anaspec, Santa Clara, CA) stored at −20°C in polypropylene (PP) autosampler vial inserts (Agilent, Santa Clara, CA). Cryo-vacuum dessication was performed overnight (Speed-Vac, Thermo Savant) at low temperature. Cryo-vacuum dessicated samples were stored frozen at −20°C and reconstituted on the day of analysis. This report emphasizes the impact of sample depletion by nonspecific adsorption and great care was taken when reconstituting low volume samples to ensure recovery from the walls of vial inserts. A detailed description of sample preparation for individual experiments is included in the Supplemental methods.
Analytical instrumentation
MS analysis was performed using an Agilent XCT Ultra ion trap mass spectrometer with Chip Cube module, electro spray ionization (ESI) ion source and thermostated auto-sampler (Agilent; Santa Clara, CA). MS acquisition parameters are listed in Supplemental methods. The nano LC chip comprises of two reverse phase micro-columns (Zorbax 300SB-C18, 5 μm: 40 nl enrichment column and 660 nl analytical column, 75 μm ID) embedded into a removable cartridge that includes a switching valve and ESI needle. Samples are delivered to the enrichment column at 4.0 μl/min (eluent A: 5% methanol, 1.0% formate and 0.1% TFA). The outflow of the enrichment column was then redirected to the elution column. Analytes were eluted (0.4 μl/min) to the ESI source of the MS detector with a gradient of methanol 1.0% formate and 0.1% TFA (5–50 %, in 10 min followed by a 3 min 100% methanol wash; total run time 20 min).
Off-line fractionation utilized an analytical HPLC (1100 series, Agilent; Santa Clara, CA) modified for low flow and low volume chromatography. Peptides of interest were eluted with a gradient of methanol containing 1.0% formate, 0.1% TFA (3–30 % in 10 min at 100μl/min) on a narrow bore rapid resolution high throughput column (Zorbax SB-C18, 1.5 μm, 2.1×15 mm). The elution profile and appropriate timing for fraction collection was established using [10−7M] standards and in-line diode array UV/Vis detection (200 nm, 360 nm ref) through an 8.0 μl flow trough cell. In order to preclude potential sample loss to fraction collection vials and pipettes, the HPLC elution fraction of interest was collected directly into autosampler vial inserts for cryo-vacuum dessication and reconstituted 1:10 vol:vol in “eluent A” for nano LC–MS analysis.
Animal preparation
Male rats (Wistar, ~350 g; Harlan, Indianapolis, IN) were anesthetized (Inactin, 100 mg/kg IP; Research Biochemicals International, Natick, MA.) and prepared for acute terminal studies on a thermo-controlled platform. The jugular vein was used for volume replacement (PBS, 1.5 ml/h) and drug infusion, and left femoral artery served to monitor blood pressure and collect blood. After a 45 min stabilization period, blood was collected using 2–3 heparinized “hematocrit” capillary tubes that we pre-coated with inhibitors to block peptidase activity (sodium meta-bisulfite, phosphoramidon and thiorphan; final concentration 5 mM, 0.1 mM and 10 μM respectively). The plasma was isolated by centrifugation and stored at −20°C. For the time-course study, blood was drawn at 15 min intervals; twice before drug infusion to establish control baseline values, twice during ACEi infusion (captopril, 100 μg/kg/min) and twice during washout. The animals were sacrificed upon termination of the study in accordance with NIH guidelines as approved by VASDHS IACUC.
Data analysis
The maximum peak height of generated by the predominant MS2 fragment was determined using the software supplied with the system (Agilent; Santa Clara, CA) and is expressed in relative units of intensity. Where applicable, regression analysis was used to determine slope and establish linearity of dose intensity measures and analysis of variance was used to compare slopes obtained for a peptide in differently prepared samples.
RESULTS
Optimzing nano LC-MS
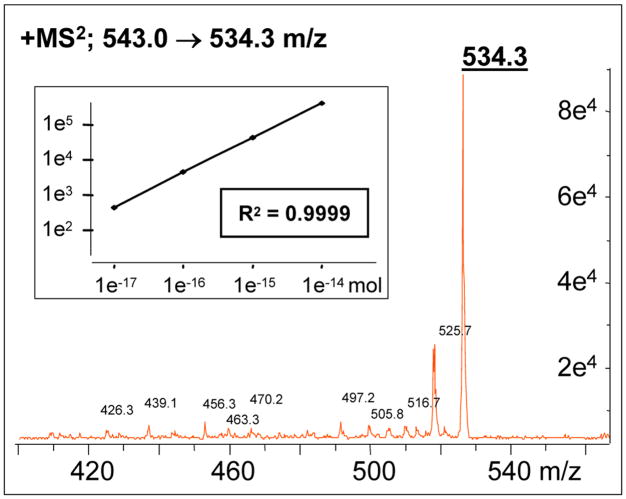
The predominant parent and fragment ions derived from each target peptide were established using standard solutions [10−7M] in scanning MS2 mode (listed in Supplemetary Table 1), in order to take advantage of the enhanced sensitivity provided by multiple reaction monitoring (MRM). The MS detector was then set up in MRM mode to exclusively monitor the appropriate parent ion over a narrow MS2 scanning range (± 20 m/z) which greatly increases the signal to noise ratio. Graded injections of individual peptides were analyzed with isocratic elution and extracted ion chromatograms of the predominant MS2 fragment were analyzed to establish a dose response relation. A linear response obtained for each peptide over 4 orders of magnitude down to 10−17 mol injected on column as seen for ADH (R2=0.999, p<0.001) in Figure 2. In this example, fragmentation of the main parent ion for ADH (543.2 m/z) generates one predominant species (534.3 m/z) and the signal intensity produced over the course of peak elution (≈ 30 seconds) can be plotted as a Gaussian smoothed extracted ion chromatogram (examples seen in Figures 3 and 4) and analyzed using the manufacturer’s supplied software (Agilent, Santa Clara, CA).
Figure 2. Enhanced detection limits of LC-MS.
Multiple reaction monitoring (MRM) increases sensitivity by detecting only the fragments derived from a specified parent ion. The MS2 chromatogram depicted here shows the signal intensity of a fragment (m/z 534.3) derived from the main parent ion of vasopressin (ADH: m/z 543.0). The signal intensity from a predominant fragment may be extracted and used for quantification. The log × log plot insert of regression analysis shows linearity of response over 4 orders of magnitude down to 10−17 mol injected on column.
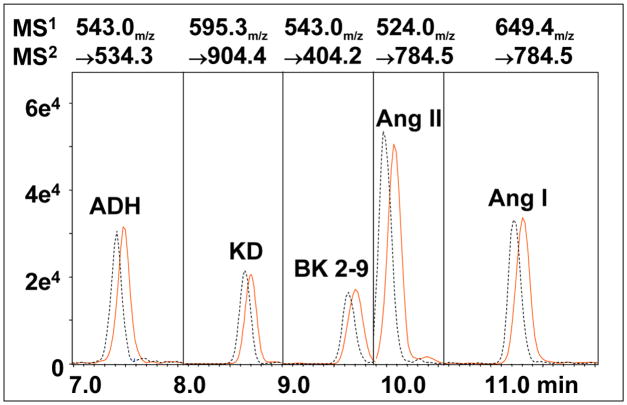
Figure 3. Elution and detection of 5 vasoactive peptides.
Components of a freshly prepared standard (1.0 fmol injected on column) are resolved by nano-LC to enable optimal MRM analysis. Vertical divisions indicate programmed changes in detector settings, synchronized to appropriate elution times.
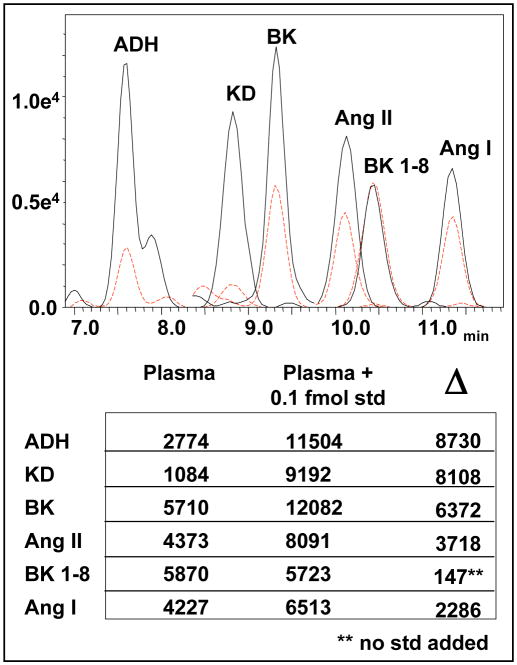
Figure 4. Detection of endogenous peptide hormones in rat plasma.
Two chromatograms resulting from the analyses of plasma extracts with methanol (=5 μl plasma with and without the addition of 0.1 fmol standards; solid and hatched lines respectively). The table summarizes mean values from duplicate runs of each sample and the difference (Δ) resulting from addition of standards. Note that the spiked standard did not contain bradykinin 1-8.
One or more target ions can be defined and analyzed using single or multiple reaction monitoring (SRM & MRM). A reverse phase elution with methanol was used to resolve target peptides and enable time dependant changes ion monitoring. In practical terms we have found that monitoring 2-3 different target analytes simultaneously (MRM) had little impact on accuracy. This can provide some leeway in synchronizing changes in parameters and allows for minor variances in elution times following a change in chip/column, new elution buffers, ambient room temperature fluctuation or if two peptides prove to be difficult to resolve. Two offset chromatograms generated from replicate runs at a 24 hr interval of a sample maintained at 4°C are depicted in Figure 3, demonstrating the stability of peptides in solution as well as the excellent reproducibility and peak symmetry needed to perform quantitative analysis.
Purifying plasma peptides
A first approach at purifying plasma peptides utilized methanol precipitation followed by 10k MW spin-filtration (Millipore, Bedford, MA) based on a comprehensive study comparing methods of plasma purification and protein depletion (31). Aliquots of processed plasma were then lyophylized with or without the addition of a standards mix and reconstituted in 20% of the original volume with water so as to concentrate the extracts fivefold. In theory, spiked sample would contain an additional 0.1 fmol/μl of select peptides. As depicted in Figure 4, the hatched chromatogram resulting from the injection of unadulterated sample clearly shows the detection of the endogenous plasma peptides. As expected, addition of standards to plasma extracts increased the appropriate signal intensities (solid line) allowing for differential analysis. This simple purification approach proved highly reproducible as evidenced by near identical measures of BK 1-8 from aliquots processed in parallel. However, based on the response depicted in Figure 3 to 1.0 fmol injected on column, the increase in signal intensity resulting from an additional 0.1 fmol in the spiked plasma was greater for ADH and KD but less for Ang I and Ang II than anticipated. This is indicative of nonspecific peptide retention and displacement during processing (32, 33). Evidently, BK 1-8 is either unaffected by nonspecific adsorption or adsorption of this particular peptide is non competitive, neither of which would impede absolute quantitation. We further characterized depletion of low concentration samples by comparing the effect of cryo-vacuum dessication in standard polypropylene (PP) vial inserts versus “deactivated” borosilicate glass inserts (see Supplementary Figure 1). The complete loss of KD and Ang I from glass vial inserts and measurable depletion of all peptides in either vial was unambiguous, demonstrating how different materials interact uniquely with individual peptides.
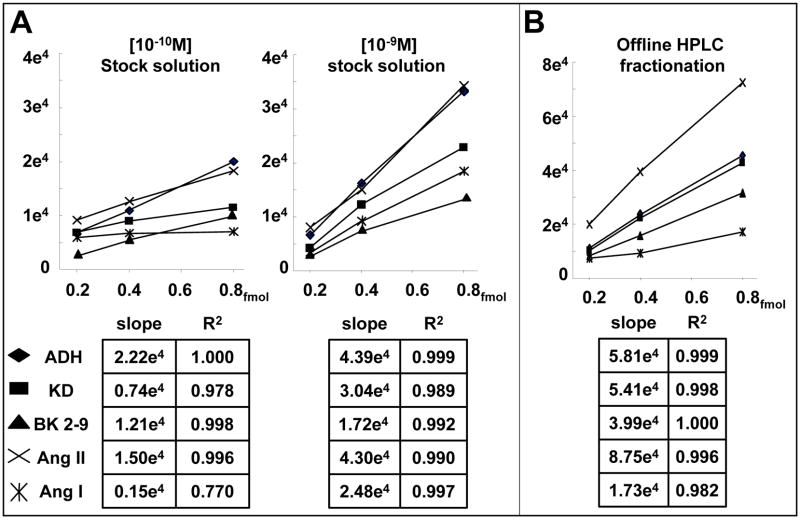
We next sought to examine how competition among the different peptides in a standard might reveal the nature of the physical properties at play. Two series of dose response analyses shown in Figure 5-A demonstrate the linear response to graded injection volumes from two peptide standard solutions, [10−9 and 10−10M], following cryo-vacuum dessication and reconstitution. Regression analysis provided R2 values for multiple analytes in either sample that were very near unity, confirming earlier results over a far broader concentration range. We attempted to inject equivalent amounts of peptide from each sample vial by adjusting injection volume (theoretically 0.2, 0.4 and 0.8 × 10⁻¹⁵ moles), however the slopes for analytes in the less concentrated sample were each significantly smaller (p< 0.02) indicating that the [10−10M] sample was less concentrated than anticipated. Adsorption within the chromatographic fluidics path by tubing and column resin is unlikely since graded injections produced incremental responses for most peptides. Indeed, these observations indicate that depletion resulted from adsorption within the vial insert since individual components were affected differently (i.e. a simple dilution error could not have reproduced the observation).
Figure 5. Sample depletion due to nonspecific adsorption.
a) A comparison of the linearity in dose response measurements with equimolar injections from stock solutions of differing concentration ([10−10 and 10−9M]). The accuracy and reproducibility of measurement is confirmed by multiple linear responses in either sample but smaller slopes produced by the [10−10M] indicate significant depletion. b) Processing a [10−9M] standard mix by off-line reverse phase HPLC fractionation and reconstitution with eluent “A” increased recovery.
We determined that concentrating the methanol precipitated plasma extract more than five fold produced a viscous sample and accelerated degradation in column performance, likely due to lipids and other unfiltered components <10k MW. We therefore established a methodology whereby 10k MW filtered plasma could be processed by offline reverse-phase HPLC fractionation which greatly enhances purification and enables the automation of sample processing (see Supplementary Figure 2). Unexpectedly, a significant improvement in recovery was observed utilizing a 20 fmol mixture of peptides subjected to chromatography fractionation, cryo-vacuum dessication and reconstitution. As depicted in Figure 5-B, the dose response slopes resulting from graded injections of HPLC processed standards were significantly enhanced (p<0.01, for ADH, KD, BK 2-9 and Ang II) as compared to those of standards simply lyophylized and reconstituted with water (Figure 5-A). An obvious difference in experimental conditions that likely resulted in enhanced peptide recovery is the presence of trifuoroacetate, formate and methanol (TFA, FA, and methanol; all components of the elution buffers utilized in HPLC and nano LC in these studies) in both the collected fraction and in the diluent used to reconstitute the lyophylizate in the sampling vial. It is not immediately apparent why non linear values obtained for Ang I in the [10−10M] sample (Figure 5-A) since these are well within limits of detection or why HPLC fractionation impaired Ang I recovery (Figure 5-B, p< 0.02 vs methanol 10−9M).
In vivo time-course study
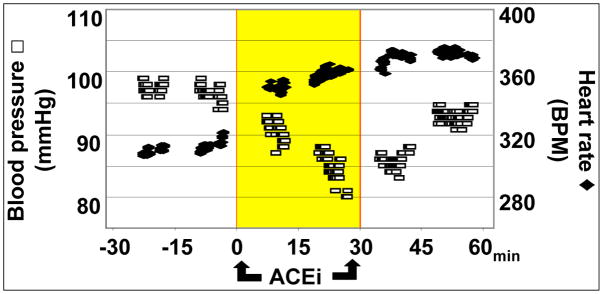
A proof of principle experiment was designed to demonstrate the potential of using nano-LC/MS to profile changes in plasma concentration of low abundance peptides. Innocuous arterial blood samples (100 μl ≈ 50 μl plasma) were drawn from an anesthetized rat at 15 min intervals before, during and after a 30 min IV infusion of an angiotensin converting enzyme inhibitor (ACEi; captopril, 100 μg/kg/min). The efficacy of the drug was evident from the progressive decline in systemic BP (approx 20 mmHg over 30 min) that began to reverse on drug termination and normalized by 60 min (Figure 6). Heart rate increased from a mean of 310 to 365 bpm by the end of ACEi infusion and remained elevated for the duration of the experiment.
Figure 6. Acute cardiovascular effect of ACEi.
Administration of an angiotensin converting enzyme inhibitor (Captopril, 100 mg/kg/min IV) caused a rapid decrease in blood pressure and a reflex increase in heart rate within 15 min.
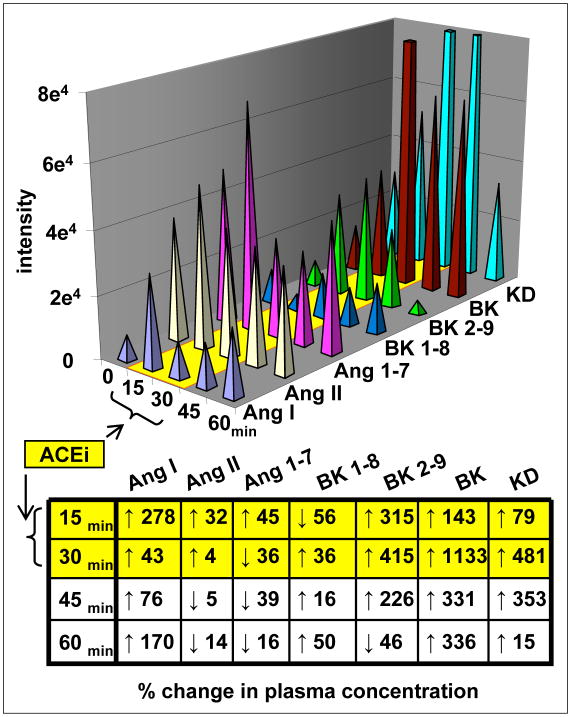
Plasma samples and standards were processes by off-line HPLC fractionation as above, concentrated 10 fold and 2.0 μl was injected. Additional standards and spiked “control” plasma were concurrently processed and assayed to verify recovery and enable normalization to molar concentration. Unfortunately, as with the methanol extraction experiment shown in Figure 4, differential analysis between unadulterated and spiked plasma following HPLC fractionation resulted in recovery of certain peptides that exceeded %100. This indicated the persistence of residual nonspecific adsorption and precluded normalization of signal intensity to a molar concentration. However, there are some important qualitative observations provided by the results that do not depend on comparisons among the different ligands. The histogram in Figure 7 depicts the signal intensities for seven vasoactive peptides in blood drawn at the indicated times using the average of replicate runs (mean values for each run were within 1% for all analytes studied). The values at T= −15 min were essentially unchanged (all <6%) by T=0 min and the mean of both time points were used for data analysis. The table in Figure 7 normalizes changes in peak height as a percentage of control values, providing a gauge of change in plasma concentration for each peptide during and after ACEi infusion. It is worth noting that diametrically opposing changes in the concentration of different peptides can be demonstrated within each particular sample confirming that changes are not the result of dilution or processing errors.
Figure 7. Vasoactive peptides in plasma before, during and after ACEi infusion.
The relative signal intensity for 7 structurally and/or functionally related hormones was determined in an anesthetized rat. Blood samples (<100 μl) were drawn at 15 min intervals. Endogenous peptides were concentrated 10 fold and 2 μl was injected on column. Changes over time for each peptide are expressed as a percentage of control in the table.
Unexpectedly, the administration of a hypotensive dose of ACEi had a relatively minor impact on plasma Ang II concentration. In contrast, the anticipated increase in Ang I and Ang 1-7 was observed immediately following ACEi, indicating a rapid turnover of these related bioactive peptides within the vasculature. The concentration of Ang I increased maximally by 278% within 15 min of ACEi and remained elevated during the post infusion period. A biphasic response obtained for Ang 1-7 which initially increased by 45% at 15 min and decreased to 36% of baseline values in the subsequent 15 min interval. As might be predicted from the enzymatic actions of ACE, the administration of Captopril had an impact on all four kinins analyzed. In fact the changes in both BK and KD concentration were dramatic, increasing more than 10 fold by 30 min with a gradual return following termination of drug infusion. In contrast to ACEi effects on Ang II, the time-course of change in vasodilatory BK and KD correlated closely with observed changes in blood pressure. Curiously, the concentration of two important bioactive ligands, BK 2-9 and 1-8 generated by terminal arginine cleavage at either end of BK, changed in opposing directions. After 15 min of ACEi infusion, the concentration of BK 2-9 increased more than 300% while that of BK 1-8 first decreased by 56% then increased above control values by 36% within 30 min. By the end of the 30 min drug washout period, the plasma concentration of BK 2-9 was 46% below control levels while that of BK 1-8 was 50% higher.
DISCUSSION
We are unaware of published reports having used MS analysis to positively identify multiple low abundance peptide hormones in plasma and measure changes in composition over time. In contrast to screening methods used in proteomic studies to identify unknown components within a sample, the MRM analysis described here presupposes knowing the identity of target analytes in order to optimize chromatographic conditions and MS detector settings. The synchronization of changes in MRM parameters with predicted elution times for each peptide requires rugged chromatographic conditions that can withstand multiple injections of samples and standards. Reproducibility of analyses was assessed by demonstrating a linear response to graded injections at physiological concentrations. However, in the process of validating the performance and exquisite sensitivity of the analytical system, we uncovered significant sample depletion due to nonspecific adsorption. Competition among low abundance peptides or other sample components for adsorption sites could potentially skew the composition of free analytes and may help to explain why more spiked ADH and KD versus Ang I and II was recovered from methanol extracted plasma and that HPLC purification uniquely impaired Ang I recovery. Perhaps most importantly, this data indicates that individual peptides are each uniquely affected which remains the primary obstacle to using traditional spiking and differential analysis for normalization to an absolute molar concentration. Incidentally, we have observed that the near complete adsorption of low concentration radiolabeled Ang I [10−10M] to borosilicate glass micropipettes can be virtually eliminated by “doping” the sample with 6.0 % albumin (data not shown). However, radioactive substances are not suitable for MS detectors and addition of albumin to a sample would be counterproductive. Coating vial surfaces with silicone or other polymers has been utilized in other techniques as a practical approach to prevent nonspecific adsorption of proteins but leaching of these compounds and contamination of MS detectors has proven to be problematic. Studies are currently underway to define appropriate low binding materials or additives that do not impair MS detection.
Concentration and fractionation of whole plasma could theoretically be performed directly on the nano-flow enrichment column embedded in the chip used in these studies However, the processing of relatively large volumes of complex bio-samples with small scale fluidics impairs the highly reproducible chromatography required for synchronized changes in detector parameters and invariably increases the levels of background signal noise. Furthermore, although samples are treated with common peptidase inhibitors at the time of collection, offline purification steps before storage and MS analysis eliminates any potential residual peptidase activity that might escape pharmacological agents. Two approaches aimed at quantitatively isolating and concentrating low abundance plasma peptides were undertaken in these studies. In the first, we took advantage of the fact that the peptides of interest do not precipitate in methanol, thus allowing for the selective depletion of abundant large proteins such as albumin and immunoglobulins. An added benefit of this approach is that it can easily be performed rapidly at the time of harvesting plasma. In the second, HPLC fractionation provided a high degree of reproducibility and enhanced recovery, making this approach particularly attractive for the automated processing of multiple samples. In retrospect, the serendipitous finding of enhanced recovery with HPLC fractionation is logical since additives commonly used in chromatography to reduce secondary “nonspecific” interactions (TFA and TEA) were present throughout the purification process and similar observation have been reported (32).
Clearly, conclusions as to mechanisms of hormone regulation can not be gleaned from studying a single animal but what we hope to convey is the very comprehensive and accurate depiction of conditions and changes within a single animal can be established. The study on the effects of ACEi provides a clear example of how profiling changes in the concentration of multiple functionally or pharmacologically related peptide hormones may be used to establish the identity and time-course of the mediators controlling physiological parameters such as blood pressure. It is immediately evident that the relative concentration of each peptide is rapidly altered following drug administration, although not necessarily in the direction anticipated from the intended drug actions depicted in Figure 1. Indeed, at every time point, evidence of highly dynamic changes in individual peptide concentration attests to the rapid regulation peptide hormone concentration. Of particular note was the fact that the changes in the concentration of Ang II (the purported target of ACEi therapy) did not correlate with the observed trends in systemic blood pressure. Admittedly these are only acute conditions, but the fact that Ang I levels did increase as predicted may indicate that an aternate nonvascular source of Ang II such as the kidney might serve normalize plasma levels. Whereas Ang I is recognized as a weak vasoconstrictor in comparison to Ang II the effect of Ang 1-7 has been shown to physiologically oppose its precursors by enhancing the vasodilatory effects of BK (13). This and the fact that kinins did dramatically increase as blood pressure declined strongly supports the idea that the vasodilatory effects of these hormones may constitute the primary effect of acute ACEi {reviewed in (34)}.
Controlling the effective concentration of peptide hormones is a principle mechanism for regulating complex physiological processes such as the maintenance of blood pressure. Since no single mediator acts in isolation, quantitative analysis of multiple functionally related hormones within a sample will be highly advantageous in establishing the etiology of disease and the impact of therapy. The use of mass spectrometry to profile plasma peptides introduces a novel approach to studying physiological processes. Whereas an immunoassay study could have required multiple animals to provide sufficient sample volume and separate assays for each antibody, the profiling experiment described here utilized only six 100 μl blood samples drawn from a single animal. Moreover, nano LC-MS provided measure of relative change equivalent to those of immunoassays without confounding artifacts due to cross-reactivity. In summary, we have developed a methodological approach aimed at profiling low abundance peptides in bio-samples by: a) chromatographically resolving target peptides using nano-LC b) synchronizing elution times with optimized MS detector settings and c) purifying and concentrating target peptides. We established that the peptides controlling vascular tone contained in 5–20 μl of plasma falls well within the limits of detection for state of the art MS detectors, allowing for repeated sampling studies in rats or mice. The goal of achieving absolute quantitation is of particular importance for comparing changes among functionally related receptor ligands with activities that are concentration dependant. While much can be gleaned from analyzing only relative changes in concentration, the prospects for enhancing recovery and achieving absolute quantitation appear promising and compel further studies.
Supplementary Material
Acknowledgments
We wish to thank Dr Andy Gieschen, Agilent Technologies, for his technical assistance.
Funding support
We wish to gratefully acknowledge the following funding sources;
- 5-R01 DK28602 (Blantz)
- P01 HL58120 (Hook)
- Veterans Administration San Diego, Research service Merit review grant #303; (Blantz)
- 1K01DA023065-01A1 (S.J. Bark)
Abbreviations used in the text
- ACE
angiotensin converting enzyme
- ACEi
angiotensin converting enzyme inhibitor
- ADH
anti diuretic hormone (vasopressin)
- Ang I
angiotensin I
- Ang II
angiotensin II
- Ang1-7
angiotensin 1-7
- BK
bradykinin
- BK1-8
des arg9-bradykinin
- BK2-9
des arg1-bradykinin
- ESI
electro spray ionization
- HPLC
high pressure liquid chromatography
- KD
kallidin
- LC
liquid chromatography
- MS
mass spectrometry
- MS2
secondary mass spectrum (MS/MS)
- MRM
multiple reaction monitoring
- TEA
triethylamine
- TFA
trifluoroacetate
Footnotes
Publisher's Disclaimer: This is a PDF file of an unedited manuscript that has been accepted for publication. As a service to our customers we are providing this early version of the manuscript. The manuscript will undergo copyediting, typesetting, and review of the resulting proof before it is published in its final form. Please note that during the production process errors may be discovered which could affect the content, and all legal disclaimers that apply to the journal pertain.
Bibliography
- 1.Duncia JV, Carini DJ, Chiu AT, Johnson AL, Price WA, Wong PC, Wexler RR, Timmermans PB. Med Res Rev. 1992;12:149–91. doi: 10.1002/med.2610120203. [DOI] [PubMed] [Google Scholar]
- 2.Pesaturo AB, Jennings HR, Voils SA. Ann Pharmacother. 2006;40:2170–2177. doi: 10.1345/aph.1H373. [DOI] [PubMed] [Google Scholar]
- 3.Delmas A, Leone M, Rousseau S, Albanese J, Martin C. Crit Care. 2005;9:212–22. doi: 10.1186/cc2945. [DOI] [PMC free article] [PubMed] [Google Scholar]
- 4.Weber MA. The American Journal of Cardiology. 2007;100:S45. doi: 10.1016/j.amjcard.2007.05.014. [DOI] [PubMed] [Google Scholar]
- 5.Allikmets K. Vasc Health Risk Manag. 2007;3:809–15. [PMC free article] [PubMed] [Google Scholar]
- 6.Molinaro G, Rouleau JL, Adam A. Current Opinion in Pharmacology. 2002;2:131. doi: 10.1016/s1471-4892(02)00138-8. [DOI] [PubMed] [Google Scholar]
- 7.Ardaillou R. Curr Opin Nephrol Hypertens. 1997;6:28–34. doi: 10.1097/00041552-199701000-00006. [DOI] [PubMed] [Google Scholar]
- 8.Blais C, Marceau F, Rouleau JL, Adam A. Peptides. 2000;21:1903. doi: 10.1016/s0196-9781(00)00348-x. [DOI] [PubMed] [Google Scholar]
- 9.Chappell MC, Pirro NT, Sykes A, Ferrario CM. Hypertension. 1998;31:362–7. doi: 10.1161/01.hyp.31.1.362. [DOI] [PubMed] [Google Scholar]
- 10.Gauthier KM, Zhang DX, Cui L, Nithipatikom K, Campbell WB. Hypertension. 2008;2:159–5. doi: 10.1161/HYPERTENSIONAHA.107.104158. [DOI] [PMC free article] [PubMed] [Google Scholar]
- 11.Greco AJ, Master RG, Fokin A, Jr, Baber SR, Kadowitz PJ. Can J Physiol Pharmacol. 2006;84:1163–75. doi: 10.1139/y06-053. [DOI] [PubMed] [Google Scholar]
- 12.Lortie M, Regoli D, Rhaleb NE, Plante GE. Am J Physiol. 1992;262:R72–6. doi: 10.1152/ajpregu.1992.262.1.R72. [DOI] [PubMed] [Google Scholar]
- 13.Santos RAS, Campagnole-Santos MJ, Andrade SP. Regulatory Peptides. 2000;91:45. doi: 10.1016/s0167-0115(00)00138-5. [DOI] [PubMed] [Google Scholar]
- 14.Casarini DE, Boim MA, Stella RC, Schor N. Am J Physiol. 1999;277:F66–74. doi: 10.1152/ajprenal.1999.277.1.F66. [DOI] [PubMed] [Google Scholar]
- 15.Nussberger J, Cugno M, Amstutz C, Cicardi M, Pellacani A, Agostoni A. The Lancet. 1998;351:1693. doi: 10.1016/S0140-6736(97)09137-X. [DOI] [PubMed] [Google Scholar]
- 16.Skidgel RA, Erdos EG. Proc Natl Acad Sci U S A. 1985;82:1025–9. doi: 10.1073/pnas.82.4.1025. [DOI] [PMC free article] [PubMed] [Google Scholar]
- 17.Vickers C, Hales P, Kaushik V, Dick L, Gavin J, Tang J, Godbout K, Parsons T, Baronas E, Hsieh F, Acton S, Patane M, Nichols A, Tummino P. J Biol Chem. 2002;277:14838–14843. doi: 10.1074/jbc.M200581200. [DOI] [PubMed] [Google Scholar]
- 18.De Silva PE, Husain A, Smeby RR, Khairallah PA. Anal Biochem. 1988;174:80. doi: 10.1016/0003-2697(88)90521-0. [DOI] [PubMed] [Google Scholar]
- 19.Nussberger J, Brunner DB, Waeber B, Brunner HR. Hypertension. 1985;7:I1–7. doi: 10.1161/01.hyp.7.3_pt_2.i1. [DOI] [PubMed] [Google Scholar]
- 20.Voelker JR, Cobb SL, Bowsher RR. Clin Chem. 1994;40:1537–1543. [PubMed] [Google Scholar]
- 21.Bragat AC, Blumenfeld J, Sealey JE. J Hypertens. 1997;15:459–65. [PubMed] [Google Scholar]
- 22.Tamvakopoulos C. Mass Spectrom Rev. 2007;26:389–402. doi: 10.1002/mas.20120. [DOI] [PubMed] [Google Scholar]
- 23.Venable JD, Dong MQ, Wohlschlegel J, Dillin A, Yates JR. Nat Methods. 2004;1:39–45. doi: 10.1038/nmeth705. [DOI] [PubMed] [Google Scholar]
- 24.Govorukhina NI, Reijmers TH, Nyangoma SO, van der Zee AGJ, Jansen RC, Bischoff R. Journal of Chromatography A. 2006;1120:142. doi: 10.1016/j.chroma.2006.02.088. [DOI] [PubMed] [Google Scholar]
- 25.Kay RG, Gregory B, Grace PB, Pleasance S. Rapid Commun Mass Spectrom. 2007;21:2585–93. doi: 10.1002/rcm.3130. [DOI] [PubMed] [Google Scholar]
- 26.Cui L, Nithipatikom K, Campbell WB. Anal Biochem. 2007;369:27–33. doi: 10.1016/j.ab.2007.06.045. [DOI] [PMC free article] [PubMed] [Google Scholar]
- 27.Martosella J, Zolotarjova N, Liu H, Nicol G, Boyes BE. J Proteome Res. 2005;4:1522–1537. doi: 10.1021/pr050088l. [DOI] [PubMed] [Google Scholar]
- 28.Lortie MJ, Ishizuka S, Schwartz D, Blantz RC. Am J Physiol Cell Physiol. 2000;278:C1191–9. doi: 10.1152/ajpcell.2000.278.6.C1191. [DOI] [PubMed] [Google Scholar]
- 29.Lortie MJ, Satriano J, Gabbai FB, Thareau S, Khang S, Deng A, Pizzo DP, Thomson SC, Blantz RC, Munger KA. Am J Physiol Regul Integr Comp Physiol. 2004;287:R1434–40. doi: 10.1152/ajpregu.00373.2004. [DOI] [PubMed] [Google Scholar]
- 30.Munger KA, Blantz RC, Lortie MJ. Am J Physiol Regul Integr Comp Physiol. 2006;291:R684–91. doi: 10.1152/ajpregu.00873.2005. [DOI] [PubMed] [Google Scholar]
- 31.Want EJ, O’Maille G, Smith CA, Brandon TR, Uritboonthai W, Qin C, Trauger SA, Siuzdak G. Anal Chem. 2006;78:743–752. doi: 10.1021/ac051312t. [DOI] [PubMed] [Google Scholar]
- 32.van Midwoud PM, Rieux L, Bischoff R, Verpoorte E, Niederlander HA. J Proteome Res. 2007;6:781–91. doi: 10.1021/pr0604099. [DOI] [PubMed] [Google Scholar]
- 33.Bark SJ, Hook V. J Proteome Res. 2007;6:4511–4516. doi: 10.1021/pr070294o. [DOI] [PubMed] [Google Scholar]
- 34.Tom B, Dendorfer A, Jan Danser AH. The International Journal of Biochemistry & Cell Biology. 2003;35:792. doi: 10.1016/s1357-2725(02)00273-x. [DOI] [PubMed] [Google Scholar]
Associated Data
This section collects any data citations, data availability statements, or supplementary materials included in this article.


