

Abstract
c-Jun is a transcription factor activated by phosphorylation by the stress-activated protein kinase/c-Jun N-terminal kinase pathway in response to extracellular signals and cytokines. We show that adenovirus-mediated gene transfer of the dominant negative form of c-Jun (dn-c-Jun) in C57BL/6 mice increased greatly apoE hepatic mRNA and plasma levels, increased plasma cholesterol, triglyceride, and very low density lipoprotein levels, and resulted in the accumulation of discoidal high density lipoprotein particles. A similar but more severe phenotype was generated by overexpression of the mouse apoE in C57BL/6 mice, suggesting that dyslipidemia induced by dn-c-Jun was the result of apoE overexpression. Unexpectedly, infection of apoE−/− mice with adenovirus expressing dn-c-Jun reduced plasma cholesterol by 70%, suggesting that dn-c-Jun affected other genes that control plasma cholesterol levels. To identify these genes, we performed whole genome expression analysis (34,000 genes) of isolated livers from two groups of five apoE−/− mice, infected with adenoviruses expressing either the dn-c-Jun or the green fluorescence protein. Bioinformatic analysis and Northern blotting validation revealed that dn-c-Jun increased 40-fold the apoE mRNA and reduced by 70% the Scd-1 (stearoyl-CoA-desaturase 1) mRNA. The involvement of Scd-1 in lowering plasma cholesterol was confirmed by restoration of high cholesterol levels of apoE−/− mice following coinfection with adenoviruses expressing dn-c-Jun and Scd-1. In conclusion, dn-c-Jun appears to trigger two opposing events in mice that affect plasma cholesterol and triglyceride levels as follows: one results in apoE overexpression and triggers dyslipidemia and the other results in inhibition of Scd-1 and offsets dyslipidemia.
c-Jun is a 39-kDa inducible transcription factor that forms homo- or heterodimers with other AP-1 (activating protein-1) family members and regulates the transcription of target genes that contain AP-1 elements (5′-TGA(C/G)TCA-3′) in their promoters (1–4). c-Jun is a modular protein that consists of a C-terminal dimerization domain (1, 5, 6), a DNA-binding domain, and an N-terminal transactivation domain (2, 7–12). The transcriptional activity of c-Jun is triggered by phosphorylation of serines 63 and 73 by the c-Jun N-terminal kinase (JNK)3 (13–18), which in turn is activated in response to inflammatory cytokines such as tumor necrosis factor-α and interleukin (IL-1) and cellular stress signals (19).
JNK and c-Jun as well as signals that activate them have been linked to the regulation of genes involved in lipid and lipoprotein homeostasis and in atherosclerosis (20–31). Previous in vitro studies have shown that c-Jun and viral Jun (v-Jun) repressed the human apolipoprotein CIII (apoCIII) (25) and the chicken apolipoprotein A-I (apoA-I) (24) promoter activity, respectively. In addition, inhibition of JNK1 increased the apoA-I promoter activity (21). The JNK signaling pathway has also been shown to affect the expression of sterol-regulatory element-binding protein-1, which in turn activates stearoyl-coenzyme A desaturase-1 (Scd-1) and fatty-acid synthetase that are involved in lipogenesis (32).
Scd is a 40-kDa microsomal membrane protein that catalyzes the introduction of the first cis-double bond in the Δ9 position in several fatty acyl-CoA substrates, preferably palmitoyl- and stearoyl-CoA, and has four isoforms (33–37). The hepatic iso-form Scd-1 is induced by restriction of dietary fat (38). In mice with a naturally occurring Scd-1 deficiency and in Scd-1 knockout mice, VLDL secretion and cholesterol and triglyceride synthesis are impaired (39, 40).
To study the effect of c-Jun on the apolipoprotein gene expression and lipid and lipoprotein homeostasis, we used adenovirus-mediated gene transfer of a dominant negative mutant of c-Jun that lacks amino acids 3–122 of the transactivation domain (Ad-dn-c-Jun) (41, 42) in HepG2 cells, C57BL/6 mice, and apoE−/− mice. This treatment increased dramatically apolipoprotein E (apoE) mRNA in HepG2 cells, as well as the hepatic apoE mRNA levels, plasma apoE, cholesterol, and triglyceride levels in C57BL/6 mice. The induction of dyslipidemia could be accounted for by the increase in plasma apoE levels. A similar treatment of apoE−/− mice decreased their plasma cholesterol levels. Whole genome microarray analysis of hepatic RNA of apoE−/− mice treated with Ad-dn-c-Jun along with Northern blotting and gene transfer studies implicated Scd-1 in the reduction of dyslipidemia that is induced by dn-c-Jun.
EXPERIMENTAL PROCEDURES
Materials
Reagents were purchased from the following commercial sources. Restriction enzymes and modifying enzymes (T4 DNA ligase, Klenow fragment of DNA polymerase I) were purchased from New England Biolabs. Cell culture reagents (Dulbecco’s modification of Eagle’s medium, fetal bovine serum, trypsin EDTA, and phosphate-buffered saline) were from Invitrogen. TRIzol reagent was purchased from Invitrogen. Proteinase inhibitor mixture was purchased from Sigma. Antibodies were purchased from Santa Cruz Biotechnology. cDNAs were purchased from American Type Culture Collection (ATCC). Radioactive [α-32P]deoxycytidine triphosphate and [α-32P]deoxyguanosine triphosphate were purchased from PerkinElmer Life Sciences, and deoxyadenosine triphosphate and deoxythymidine triphosphate were purchased from GE Healthcare.
Construction of Recombinant Adenoviruses
The plasmid that contained the cDNA of the dominant negative form of human c-Jun (pcDNA3.1-dn-c-Jun, Δ3–122) was kindly provided by M. J. Birrer (NCI, National Institutes of Health, Bethesda). The cDNA was cloned into NotI and HindIII restriction sites of the pAdTrackCMV vector. The plasmid containing the rat Scd-1 cDNA (pGEM-11Zf(+)-Scd-1) was a generous gift from J. Ozols (University of Connecticut Health Center). The Scd-1 cDNA was subcloned in EcoRI and NotI sites of the pcDNA3.1 vector and subsequently cloned in KpnI and XbaI sites of the pAdTrackCMV vector. The plasmid that contained the cDNA of the human wild-type (WT) c-Jun (pOTB7-c-Jun) was purchased from ATCC. The c-Jun cDNA was subcloned in EcoRI and XhoI sites of the pcDNA3.1 vector. The PacI site of this vector that was present in the 5′-untranslated region of the c-Jun cDNA was destroyed following PacI digestion of the pcDNA3.1-c-Jun and treatment with T4 polymerase DNA and religation. The c-Jun cDNA insert was excised from the pcDNA 3.1 vector with KpnI and XhoI digestion and cloned in corresponding sites of the pAdTrackCMV vector. The recombinant adenoviruses were constructed as described (43) using the Ad-Easy-1 system where the adenovirus construct is generated in bacteria BJ-5183 cells (44). Correct clones were propagated in RecA DH5α cells. The recombinant adenoviral vectors were linearized with PacI and used to infect 911 cells (45). Following large scale infection of human embryonic kidney 293 cell cultures, the recombinant adenoviruses were purified by two consecutive cesium chloride ultracentrifugation steps, dialyzed, and titrated (46). Usually, titers of ~2–7 × 10¹⁰ plaque-forming units (pfu)/ml were obtained. The adenovirus that expresses the wild-type mouse apoE (Ad-mapoE) was kindly provided by K. W. van Dijk (Leiden University, Netherlands).
Cell Culture Studies and Protein Analysis
Human HepG2 cells (human hepatoma) were grown to confluence in medium containing 10% fetal bovine serum. The medium was changed to 2% heat-inactivated horse serum, and the cells were infected in at least duplicates with control adenovirus that expresses the green fluorescent protein (Ad-GFP) and the adenoviruses expressing the dn-c-Jun form (Ad-dn-c-Jun) and the wild-type Scd-1 at a multiplicity of infection of 5. Twenty four hours post-infection, cells were washed twice with phosphate-buffered saline, and fresh 10% fetal bovine serum-containing medium was added. To assess protein expression 48 h post-infection, cell lysates were collected and analyzed by Western blotting.
Animal Studies
C57BL/6 and apoE−/− mice 8–12 weeks old were used in these studies. Groups of 5–10 mice were infected intravenously through the tail vein with adenoviruses at a dose of 2 × 10⁹ pfu. Blood was obtained from the tail vein after a 4-h fasting period prior to adenoviral infection and 3 and 4 days post-infection. Aliquots of plasma were stored at 4 and − 20 °C.
RNA Purification and Analysis
To assess the gene expression following adenovirus-mediated gene transfer, at least five mice from each group were sacrificed 4 days post-infection. Livers were collected from individual animals, frozen in liquid nitrogen, and stored at −80 °C. Total RNA was purified from livers using the TRIzol reagent according to the instructions of the manufacturer. Purified RNA was analyzed for expression of dn-c-jun, apoE, and scd-1 genes by Northern blotting and quantitated by phosphorimaging (46). Total RNA was isolated similarly from HepG2 cells using the TRIzol reagent and analyzed by Northern blotting (14).
Fast Performance Liquid Chromatography (FPLC) Analysis and Lipid Determination
For FPLC analysis of serum samples, 12 μl of serum were diluted 1:5 with phosphate-buffered saline, loaded onto a Superose 6 column in a SMART micro-FPLC system (Amersham Biosciences), and eluted with phosphate-buffered saline. A total of 25 fractions of 50 μl volume each were collected for further analysis. Triglycerides and cholesterol were determined using the GPO-Trinder kit (Sigma) and CHOL-MPR3 kit (Roche Applied Science), according to the manufacturer’s instructions. The triglyceride and cholesterol concentrations of the serum and the FPLC fractions were determined spectrophotometrically at 540 and 492 nm, respectively, as described previously (43).
Rate of VLDL Triglyceride Production in C57/BL6 Mice Infected with Ad-dn-c-Jun
VLDL triglyceride secretion was determined following infection of C57BL6 mice with 2 × 10⁹ pfu of adenoviruses expressing either Ad-dn-c-Jun or the control Ad-GFP adenovirus. Four days post-infection, mice were fasted for 4 h and then injected with Triton WR-1339 at a dose of 500 mg/kg of body weight, using a 15% solution (w/v) in 0.9% NaCl (Triton WR-1339 has been shown to completely inhibit VLDL catabolism) (47). Serum samples were isolated 20, 40, 60, and 90 min after injection with Triton WR-1339. Serum triglycerides were measured, and the rate of VLDL-triglyceride secretion expressed in mg/dl/min was determined as described previously (43).
Statistical Analysis
Data are presented as the mean ± S.E. Comparison of data from two groups of mice was performed using the paired two-sample-for-means t test with unequal variance.
Density Gradient Ultracentrifugation
To assess the protein composition of plasma, 0.3 ml of serum from mice infected either with the control Ad-GFP, Ad-dn-c-Jun, or Ad-mapoE were brought to a volume of 0.5 ml with phosphate-buffered saline and adjusted to a density of 1.23 g/ml with KBr. This solution was then overlaid with 1 ml of 1.21 g/ml KBr, 2.5 ml of 1.063 g/ml KBr, 0.5 of 1.019 g/ml KBr, and 0.5 ml of saline. The mixture was centrifuged for 22 h in an SW 41 rotor at 34,000 rpm. Following ultracentrifugation, 10 fractions of 0.5 ml were collected and analyzed by SDS-PAGE.
Electron Microscopy
Aliquots of the fractions from equilibrium density gradient centrifugation after dialysis against ammonium acetate and carbonate buffer were stained with sodium phosphotungstate, visualized in the Phillips CM-120 electron microscope (Phillips Electron Optics, Eindhoven, Netherlands), and photographed as described previously (48). The photomicrographs were taken at ×75,000 magnification and enlarged three times.
Target Preparation, Microarray Hybridization, and Quality Assessment
Total RNA was extracted from the livers of 10 apoE−/− mice. Five of these mice were infected with Ad-dn-c-Jun, and five were infected with a control adenovirus expressing GFP. Each liver specimen was homogenized in TRIzol (Invitrogen) and chloroform/isoamyl alcohol (49:1). All RNA samples used for microarray analysis were carefully evaluated to have a 28 S/18 S rRNA ratio close to 2 on 1.5% agarose gels and absorbance ratios 260:280 nm between 1.9 and 2.1. A quantity of 6–8 μg of targets from each RNA sample were prepared as described previously (49) and hybridized to GeneChip Whole Mouse Genome 430 2.0 arrays (Affymetrix). The 45,000 probe sets on these arrays analyze the expression levels of over 39,000 transcripts and variants from over 34,000 well characterized mouse genes. The arrays were washed and stained by the Affymetrix 450 Fluidics station and scanned using the Gene-Chip Scanner 3000, enabled for high resolution scanning. The expression level and a “present,” “absent,” or “marginal” call was assigned to each probe set by the GeneChip operating software version 1.4 (Affymetrix).
The number of probe sets called present by the software for each specimen was 44–49%, indicating that these transcripts were present at sufficient levels for accurate quantitation. Target quality was controlled by ensuring that the ratio of expression of the representative 3′ and 5′ sequences of the control genes β-actin and glyceraldehyde 3-phosphate dehydrogenase (GAPDH) on the microarrays was <3 in all 10 data sets. The good hybridization quality was also established through a concentration gradient of spike-in Bacillus subtilis transcripts which, as desired, gave a present call and increasing expression levels in all data sets.
Analysis of Raw Microarray Data
Hierarchical clustering was performed on un-normalized/unfiltered data, as described before (50), using the Cluster and TreeView software (51) with centered linear correlation as a measure of similarity using average linkage. A range of standard deviation thresholds was applied.
Following the initial processing step by the GeneChip operating software version 1.4, the data were normalized as described previously (52). This normalization corrects any uniform linear aberrations of the reported signals between any two replicate measurements that may arise from idiosyncrasies in the sample preparation, hybridization, or scanning protocol. The data were then filtered to keep only probe sets with reliable expression measurements. This was defined as more than 3 present and 1 marginal calls per probe set in the 10 data sets. Approximately 22,500 probe sets passed the filtering criteria.
Significant analysis of microarrays was used to identify significant gene expression changes between the two groups of mice (53). A two-class unpaired data analysis was performed on normalized and filtered data, using a Δ threshold of 1.571 (the “Δ” parameter enables the user to examine the effect of the false-positive rate in determining significance) and a fold threshold of 2 (where “fold” is calculated as the ratio of the average expression in dn-c-Jun infected apoE−/− mice versus control mouse data sets). This resulted in the selection of probe sets with less than 2% median false discovery rate.
RESULTS
Adenovirus-mediated Gene Transfer of a Dominant Negative Form of c-Jun in C57BL/6 Mice Increases the Hepatic mRNA and Plasma ApoE Levels
We used adenovirus-mediated gene transfer of dn-c-Jun in C57BL/6 mice to assess its effects on genes involved in lipid and lipoprotein homeostasis. For these experiments C57BL/6 mice were infected with 1–2 × 10⁹ pfu of the adenovirus expressing the dn-c-Jun or the control adenovirus expressing GFP. Plasma was collected prior to infection as well as 3 and 4 days post-infection, and hepatic RNA was extracted from liver obtained 4 days post-infection. This analysis showed efficient expression of the dn-c-Jun in the liver (Fig. 1A) and a dramatic up-regulation of hepatic apoE mRNA (Fig. 1B). A similar up-regulation of apoE mRNA levels was observed in HepG2 cells infected with the Ad-dn-c-Jun (supplemental Fig. 1). Analysis of the cytoplasmic and nuclear extracts of infected HepG2 cells by SDS-PAGE and Western blotting showed that the dn-c-Jun was expressed efficiently and was found both in cytoplasm and the nucleus (supplemental Fig. 2).
FIGURE 1. A–D, effect of the dn-c-Jun on the hepatic expression of apoE and the plasma apoE levels in C57BL/6 mice infected with an adenovirus expressing the dn-c-Jun.

A and B, autoradiograms of Northern blot analysis of total RNA isolated from the liver of mice 4 days post-infection with either a control adenovirus expressing GFP or an adenovirus expressing the dn-c-Jun. Blot shown in A was hybridized with probes that detect c-Jun and GAPDH. Blot shown in B was hybridized with probes that detect apoE and GAPDH as indicated. C and D, SDS-PAGE analysis of density gradient ultracentrifugation fractions of plasma of C57BL/6 mice infected with either a control adenovirus expressing GFP (C) or an adenovirus expressing the dn-c-Jun (D). The densities of the fractions are indicated on the top of the figure. The positions of apoE and apoA-I are indicated.
Fractionation of the plasma of C57BL/6 mice treated with the Ad-dn-c-Jun by density gradient ultracentrifugation and analysis of the fractions by SDS-PAGE showed that expression of dn-c-Jun in C57BL/6 mice increased dramatically plasma apoE levels as compared with the mice infected with the control adenovirus expressing GFP (Fig. 1, C and D).
Expression of dn-c-Jun Increases the Plasma Cholesterol and Triglycerides in C57BL/6 Mice and Causes Accumulation of Discoidal HDL Particles
The treatment of C57BL/6 mice with the Ad-dn-c-Jun increased 2.9-fold the plasma cholesterol levels and 5.8-fold the plasma triglyceride levels, as compared with the mice treated with the control adenovirus expressing GFP (Fig. 2, A and B). FPLC analysis of plasma from mice expressing the dn-c-Jun showed that the cholesterol and triglycerides were distributed predominantly in the VLDL/intermediate density lipoprotein/LDL region (Fig. 2, C and D) as compared with C57BL/6 mice infected with the control adenovirus expressing GFP where the cholesterol is distributed in the HDL region (Fig. 2C). EM analysis of fractions 5–8 corresponding to the HDL region (Fig. 1, C and D), which were obtained by density gradient ultracentrifugation, showed that expression of dn-c-Jun in C57BL/6 mice was associated with the formation of discoidal HDL particles (Fig. 2F), whereas the equivalent fractions 5–8 that were obtained from plasma of C57BL/6 mice infected with control adenovirus expressing the GFP formed spherical HDL particles (Fig. 2E).
FIGURE 2. A–F, cholesterol (A) and triglyceride (B) levels of C57BL/6 mice infected with control adenoviruses expressing GFP or adenovirus expressing the dn-c-Jun.

Three groups of mice containing 3– 4 mice per group were infected with 2 × 10⁹ pfu of the adenoviruses as indicated in the figure, and plasma was collected on the 3rd and 4th day and analyzed for cholesterol and triglyceride levels as described under “Experimental Procedures.” Shown are the FPLC profiles of cholesterol (C) and triglycerides (D) of C57BL/6 mice infected with control adenovirus expressing GFP or adenovirus expressing the dn-c-Jun. Plasma collected 4 days post-infection was fractionated by FPLC, and cholesterol and triglyceride levels were determined. Electron microscopy pictures of the fractions corresponding to the HDL region were obtained from the plasma of C57BL/6 mice infected with adenoviruses expressing the GFP (E) or the dn-c-Jun (F). Following density gradient ultracentrifugation, fractions 5– 8 of Fig. 1, C and D, that float to the HDL region were analyzed by electron microscopy. The positions of discoidal particles are indicated by arrows. IDL, intermediate density lipoprotein.
The up-regulation of the apoE gene and the induction of dyslipidemia is a unique feature of the dn-c-Jun. When C57BL/6 mice were infected with adenoviruses expressing WT c-Jun, the expression of the apoE gene was not affected, and the plasma cholesterol and triglyceride levels remained normal 3 and 4 days post-infection (supplemental Fig. 3). The rate of triglyceride secretion determined by Triton WR1339 injection 4 days post-infection was increased 35% in C57BL/6 mice infected with adenovirus expressing dn-c-Jun as compared with mice infected with the control adenovirus expressing GFP (supplemental Fig. 4). Previous studies indicated that apoE overexpression stimulates severalfold VLDL triglyceride (VLDL-TG) secretion (43, 46, 54–56). Thus, the modest increase in VLDL-TG secretion promoted by the treatment of mice with Ad-dn-c-Jun suggests that other genes that may inhibit VLDL-TG secretion might be affected by dn-c-Jun.
Dyslipidemia Induced by dn-c-Jun Treatment Can Be Accounted for by Overexpression of mapoE
To assess the contribution of mapoE to the dyslipidemia induced by the dn-c-Jun expression, C57BL/6 mice were infected with 2 × 10⁹ pfu of adenovirus expressing mapoE or the control adenovirus expressing GFP, and the plasma lipid and apoE levels as well as the hepatic apoE mRNA levels were determined 4 days post-infection. This analysis of the Ad-mapoE-treated mice showed that the hepatic mapoE mRNA increased dramatically as compared with the endogenous mapoE mRNA levels (Fig. 3A). Comparative analysis of apoE mRNA levels of mice infected with the adenoviruses expressing the dn-c-Jun or the mouse apoE showed that the levels of expression of apoE were comparable (Fig. 3B). This increase in apoE mRNA following the infection with the adenovirus expressing the mouse apoE was accompanied by a dramatic increasee in the plasma levels of mapoE (compare Fig. 1D with Fig. 3C). The increase in plasma apoE was associated with a 6.5-fold increase in plasma cholesterol and a 7.8-fold increase in plasma triglycerides (Fig. 3, D and E).
FIGURE 3. A–E, hepatic apoE mRNA levels and plasma cholesterol and triglyceride levels of mice infected with 2 × 10⁹ pfu of adenovirus expressing the mouse apoE.

A, autoradiogram of a Northern blot analysis of total RNA isolated from C57BL/6 mice infected with a control adenovirus expressing GFP or an adenovirus expressing the mouse apoE. B, comparative analysis of hepatic RNA obtained from mice infected with 2 × 10⁹ pfu of adenoviruses expressing either dn-c-Jun or mouse apoE as indicated. The positions of apoE and the GAPDH mRNAs are indicated. C, SDS-PAGE analysis of density gradient ultracentrifugation fractions of plasma of C57BL/6 mice infected with 2 × 10⁹ pfu of adenovirus expressing the mouse apoE. The densities of the fractions are indicated on the top of the figure. The position of apoE and apoA-I is indicated. D and E, cholesterol (D) and triglyceride (E) levels of C57BL/6 mice infected with control adenoviruses expressing GFP or adenovirus expressing the mouse apoE. Mice were infected with 2 × 10⁹ pfu of the adenoviruses as indicated in the figure, and plasma was collected on the 3rd and 4th day and analyzed for cholesterol and triglyceride levels.
Expression of dn-c-Jun in ApoE−/− Mice Resulted in Reduction of Plasma Lipid Levels
To investigate whether dyslipidemia observed in Ad-dn-c-Jun-infected mice was because of apoE overexpression, a similar analysis was undertaken in the apoE−/− mouse line that lacks endogenous apoE expression. ApoE−/− mice were infected with 2 × 10⁹ pfu with adenoviruses expressing either the dn-c-Jun or GFP. The expectation was that both treatments would not have any effect on the plasma lipid levels. Surprisingly, this analysis showed that the dn-c-Jun reduced by 70% the plasma cholesterol and triglyceride levels 3 or 4 days post-infection, as compared with the mice infected with the control adenovirus expressing GFP (Fig. 4, A and B). FPLC analysis of plasma showed that in mice treated with Ad-dn-c-Jun the VLDL cholesterol and triglyceride peaks were reduced 4 days post-infection as compared with that of apoE-deficient mice treated with Ad-GFP (Fig. 4, C and D).
FIGURE 4.
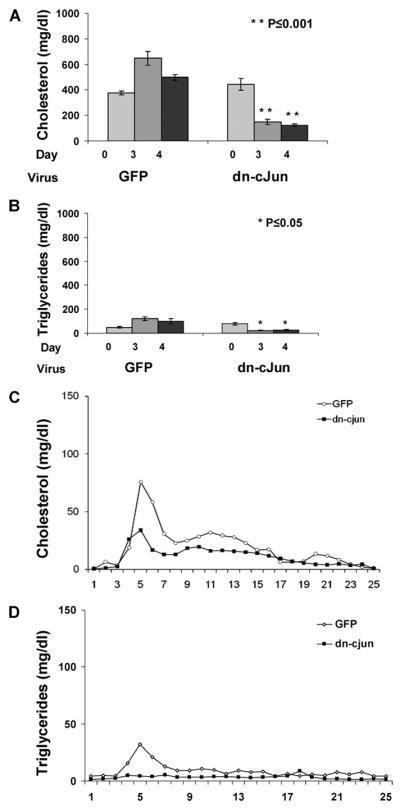
A–D, cholesterol (A) and triglyceride (B) levels of plasma obtained from apoE-deficient (apoE−/−) mice infected with control adenoviruses expressing GFP or adenovirus expressing the dn-c-Jun.
Three groups of mice containing 3– 4 mice per group were infected with 2 × 10⁹ pfu of adenoviruses expressing the GFP or the dn-c-Jun, and plasma was collected on the 3rd and 4th day and analyzed for cholesterol and triglyceride levels as described. Shown are the FPLC profiles of cholesterol (C) and triglycerides (D) of apoE−/− mice infected with control adenovirus expressing GFP or adenovirus expressing the dn-c-Jun.
Microarray Analysis and Northern Blotting of Hepatic RNA Obtained from ApoE−/− Mice That Were Treated with Adenovirus Expressing the dn-c-Jun Indicated Down-regulation of Scd-1
We used whole genome expression profiling to identify potential dn-c-Jun-induced changes in the apoE−/− mouse liver. Hierarchical clustering of the microarray data revealed two distinct expression signatures. Specifically, the 10 data sets were blindly grouped by the software in two distinct clusters, one containing the Ad-dn-c-Jun-treated and the other containing the control Ad-GFP-treated apoE−/− mice (Fig. 5A). The correlation coefficient values for intra- and inter-cluster comparisons ranged between 97–99% and 95–97%, respectively.
FIGURE 5.

A, hierarchical clustering of the five apoE−/− mice infected with adenovirus expressing the dn-c-Jun (dn) and the five apoE−/− mice infected with control adenovirus expressing the GFP. The expression levels of the four significantly changed lipid metabolism related genes (6 probe sets) are presented (red = increased expression; green = decreased expression). Data analysis (2-fold change and 2% false discovery rate thresholds) identified significant up-regulation for apoE gene and down-regulation for three genes that have been implicated in lipid metabolism (scd-1, mip-2, and il-1rn). B, autoradiogram of a Northern blot analysis of total RNA isolated from apoE−/− mice infected with a control adenovirus expressing GFP or an adenovirus expressing the dn-c-Jun. The positions of Scd-1 and the GAPDH mRNAs are indicated.
In a second stage of bioinformatic analysis, we aimed at depicting the specific gene expression changes induced in Ad-dn-c-Jun infected apoE−/− mice using significant analysis of microarrays. After the application of stringent fold and false discovery rate thresholds, 123 probe sets were identified as significantly and highly changed. The majority of these probe sets were down-regulated, and only two were up-regulated (supplemental Table 1). These probe sets represented proteins with a wide range of functional categories, a large proportion of which were metabolism- (40%) and transport (~15%)-related and fewer were defense response-(10%) and cell cycle (~7%)-related (supplemental Fig. 5). Based on the Gene Ontology annotations, six probe sets represented four lipid metabolism-related genes, namely apoE (+40-fold), macrophage inflammatory protein-2 (MIP2) (−2.6-fold), interleukin 1 receptor antagonist (Il1rn) (−2.45-fold), and Scd-1 (−3.27-fold) (Fig. 5A and supplemental Table 1 submitted to Gene Expression Omnibus Data base; provisional data series number: GSE6850). The decrease in Scd-1 mRNA was confirmed by Northern blotting analysis of hepatic total RNA extracted from livers of apoE−/− mice 4 days post-infection with adenoviruses expressing either the dn-c-Jun or GFP (Fig. 5B). Consistent with the microarray data, quantitation of the Northern blot by PhosphorImager showed that the Scd-1 mRNA levels of apoE−/− mice treated with dn-c-Jun decreased 3.6-fold. The inhibition of expression of Scd-1 is a unique feature of the dn-c-Jun and occurs both in the apoE−/− as well as C57BL/6 mice. Furthermore, Scd-1 expression is not affected by WT c-Jun in either C57BL/6 or apoE−/− mice (supplemental Fig. 6). The increase in apoE mRNA of apoE−/− mice treated with the adenovirus expressing the dn-c-Jun is in agreement with the observed increase in apoE mRNA of C57BL/6 mice treated similarly with the adenovirus expressing the dn-c-Jun (Fig. 1B).
The High Cholesterol Profile of apoE−/− Mice Is Restored by Simultaneous Infection with Adenoviruses Expressing the dn-c-Jun and Scd-1
To further investigate the involvement of Scd-1 in the modulation of the lipid levels of apoE−/− mice expressing the dn-c-Jun, we generated a recombinant adenovirus that expresses the rat Scd-1. The expression of Scd-1 was tested in HepG2 cells 48 h post-infection by SDS-PAGE analysis and Western blotting of the cell lysates. This analysis showed that infection of HepG2 cells with multiplicity of infection 3, 5, 10, and 20 of adenovirus expressing Scd-1 increased progressively the Scd-1 protein levels as compared with cells treated with control adenovirus expressing GFP (supplemental Fig. 7). To assess the potential role of Scd-1 down-regulation in the reduction of the plasma cholesterol levels in apoE−/− mice following treatment with the adenovirus expressing the dn-c-Jun, we co-infected apoE−/− mice with 1 × 10⁹ pfu of adenovirus expressing dn-c-Jun in combination with either 1 × 10⁹ pfu of adenovirus expressing GFP or 1 × 10⁹ pfu of adenovirus expressing Scd-1. Analysis of the hepatic mRNA levels of dn-c-Jun and Scd-1 and the plasma lipid levels 4 days post-infection confirmed that expression of dn-c-Jun in combination with GFP (Fig. 6A) decreased plasma cholesterol levels, whereas simultaneous expression of dn-c-Jun and Scd-1 restored the high cholesterol levels of apoE−/− mice (Fig. 6B). These treatments did not affect plasma triglyceride levels (data not shown).
FIGURE 6. A and B, hepatic Scd-1 and dn-c-Jun mRNA levels (A) and plasma cholesterol levels (B) of apoE−/− mice infected with a mixture of adenoviruses with 1 × 10⁹ pfu expressing dn-c-Jun and 1 × 10⁹ pfu expressing GFP and a mixture of adenoviruses with 1 ×10⁹ pfu expressing dn-c-Jun and 1 × 10⁹ pfu expressing Scd-1.
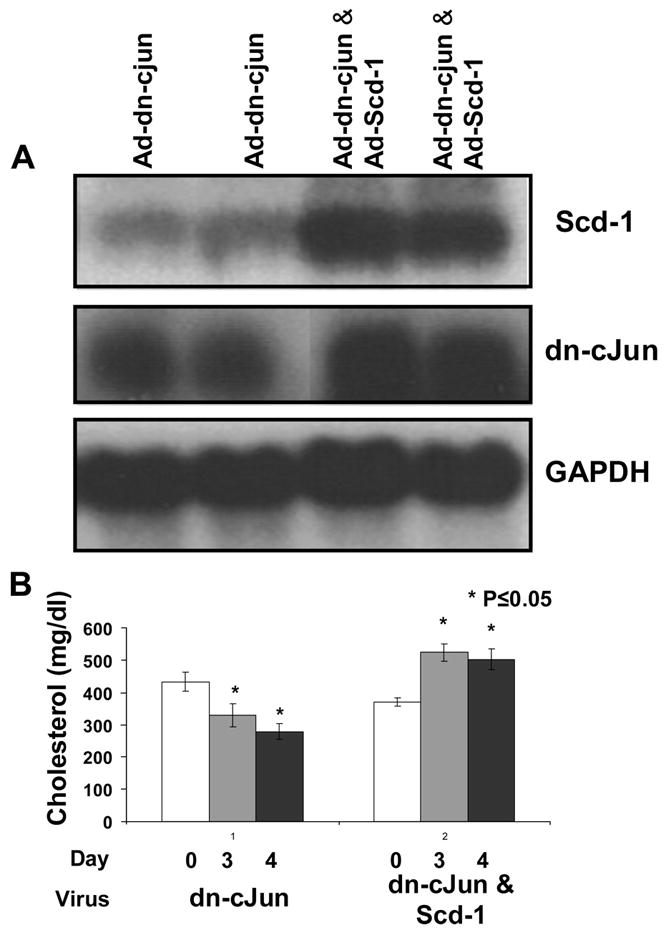
A, autoradiogram of a Northern blot analysis of total RNA isolated from apoE−/− mice infected with the mixtures of adenoviruses that are described on the top of panel A. The positions of dn-c-Jun, Scd-1, and the GAPDH mRNAs are indicated. B, plasma cholesterol levels of apoE−/− mice infected with the mixtures of adenoviruses that are described on the top of panel A. Plasma was collected on the 3rd and 4th day and analyzed for cholesterol levels.
Control experiments showed that adenovirus expressing Scd-1 did not affect plasma cholesterol and triglyceride levels (supplemental Fig. 8). The findings suggest that plasma lipid levels are not affected by an increase in Scd-1 expression.
Fig. 7 is a schematic representation of the modulation of the cholesterol levels in C57BL/6 and apoE−/− mice following treatment with the adenovirus expressing the dn-c-Jun, which will be discussed later.
FIGURE 7.

A schematic model that explains the role of the dn-c-Jun in the induction of high cholesterol and triglyceride levels of C57BL/6 mice and in the reduction of the high cholesterol levels of apoE−/− mice.
DISCUSSION
The correlation of JNK and c-Jun with lipid and lipoprotein metabolism and atherosclerosis led us to investigate the effects of a dominant negative form of c-Jun in the regulation of lipid levels in different mouse models.
The first important observation of our studies was that the dn-c-Jun caused dyslipidemia in C57BL/6 mice, which was characterized by increased plasma cholesterol and triglyceride levels that accumulated in the VLDL region. We were able to attribute the dyslipidemia observed in C57BL/6 mice to a dramatic increase in hepatic steady state apoE mRNA levels that resulted in an increase in plasma apoE levels. The increase in apoE mRNA was documented by Northern blotting in C57BL/6 mice, as well as by whole genome microarray analysis in apoE−/− mice. The association of the high plasma apoE levels with the induction of dyslipidemia was supported by direct gene transfer of mouse apoE in C57BL/6 mice. This treatment produced a similar but more severe lipid and lipoprotein profile as that observed in C57BL/6 mice treated with the Ad-dn-c-Jun.
Furthermore, previous studies by us and others have shown that overexpression of human apoE does not correct the high cholesterol profiles of apoE−/− mice, does increase VLDL-triglyceride secretion, and induces hypertriglyceridemia (43, 46, 54–56). In humans and experimental animals plasma apoE levels correlate with plasma triglyceride levels (57, 58). On the basis of this information we hypothesized that expression of dn-c-Jun in apoE−/− mice would not affect the plasma lipid levels. Surprisingly, however, the treatment of apoE−/− mice with adenovirus expressing the dn-c-Jun decreased their plasma cholesterol levels. To interpret this unexpected finding, we performed whole genome microarray analysis of hepatic RNA obtained from Ad-dn-c-Jun-treated and control (Ad-GFP treated) apoE−/− mice. Microarray data analysis with very strict thresholds (at least 2-fold changes and false discovery rate less than 2%) identified 123 transcripts that were highly and significantly changed by the Ad-dn-c-Jun treatment (supplemental Table 1). The results were filtered for transcripts directly related to lipid and lipoprotein metabolism and atherosclerosis. Four transcripts emerged, namely MIP-2, IL-1rn, Scd-1, and apoE. The apoE transcript detected by microarrays represent the aberrant mouse apoE gene produced that also contains the neomycin mRNA (59).
MIP-2 is a potent chemotactic agent for polymorphonuclear leukocytes that is secreted by macrophages. It was shown that MIP-2 was increased in the serum of apoE*3 Leiden (apoE3 having duplication of amino acids 121–127) mice fed a high fat diet that leads to dyslipidemia and atherosclerosis (60). In this case the induction of MIP-2 appears to be the result of the dyslipidemia and the pro-inflammatory conditions that are brought about by the high fat diet. MIP-2 also increases by treatment of macrophages with minimally modified LDL (61). Thus, the observed down-regulation of the mip-2 gene by the dn-c-Jun in Kupffer cells may be the consequence rather than the cause of the reduction of plasma cholesterol and triglyceride levels of apoE−/− mice following treatment with dn-c-Jun.
IL-1rn is a protein that binds to IL-1 receptors and inhibits the binding of IL-1α and IL-1β IL-1rn is expressed in endothelial cells and is found in atherosclerotic lesions (62). A polymorphism in intron 2 of the human IL-1rn gene, which reduces the plasma concentration of IL-1rn, has been associated with coronary atherosclerosis in diabetic patients (63). However, plasma lipid analysis of IL-1rn−/− xapoE−/− mice revealed that total cholesterol levels were significantly elevated compared with those of the IL-1rn−/− xapoE−/− mice (64). Therefore, the reduction of IL-1rn that was documented with the microarray analysis of hepatic mRNA of apoE−/− mice that were treated with the adenovirus expressing the dn-c-Jun cannot explain the observed reduction of the plasma cholesterol levels.
Scd-1 is an iron-containing enzyme that catalyzes the rate-limiting step in the synthesis of unsaturated fatty acids, and it is expressed abundantly in the liver (33). It has been reported that Scd-1−/− mice have very low levels of VLDL and impaired triglyceride and cholesteryl ester biosynthesis (39, 40). Thus, the lipid phenotypedescribedforScd-1−/− mice may explain the reduction of plasma cholesterol and triglycerides in apoE−/− mice that were treated with the adenovirus expressing the dn-c-Jun. Although numerous other genes are affected by the treatment of apoE−/− mice with adenovirus expressing the dn-c-Jun (supplemental Table 1), we suggest that the reduction of Scd-1 may be the major event that corrects partially the dyslipidemia in apoE−/− mice following infection with Ad-dn-c-Jun. This interpretation is further supported by restoration of the high cholesterol levels of the apoE−/− mice following simultaneous treatment with adenoviruses expressing dn-c-Jun and Scd-1. The down-regulation of Scd-1 may also explain the moderate dyslipidemia that was induced in C57BL/6 mice that were treated with adenovirus expressing the dn-c-Jun as compared with the severe dyslipidemia, which was induced in C57BL/6 mice that were treated with adenovirus expressing the mouse apoE despite the fact that the plasma apoE levels following the two treatments were comparable. The moderate increase of VLDL secretion in C57BL/6 mice treated with the adenovirus expressing the dn-c-Jun can be also attributed to the reduction of Scd-1 that is known to modulate VLDL secretion (39, 40).
Further studies are required to elucidate the transcriptional mechanisms by which dn-c-Jun, which lacks a major part of its transactivation domain, induces the expression of the apoE gene. It was shown previously that the exact same molecule (c-Jun lacking amino acids 3–122) is a more potent transactivator as compared with full-length c-Jun in the Sp-1-mediated activation of the human p21 WAF1 promoter (65). It is known that the apoE promoter has three Sp-1-binding sites (66), which may be involved in Sp1-dn-c-Jun interactions that promote apoE gene transcription. This study showed that WT c-Jun does not affect apoE gene expression and does not induce dyslipidemia when it is expressed in mice following adenovirus-mediated gene transfer. The direct or indirect role of dn-c-Jun in the down-regulation of the Scd-1 gene also needs to be explored. Previous studies indicated that Scd-1 is down-regulated by a JNK inhibitor (32). The observed down-regulation of some of the other genes that are affected by the dn-c-Jun may be caused by direct transcriptional repression that results from binding of the dn-c-Jun to AP-1 sites on the promoters of these genes.
Overall, our data indicate that the dn-c-Jun affects two genes that play an important role in the lipid and lipoprotein homeostasis in mice. It up-regulates greatly the hepatic expression of the apoE gene and down-regulates the expression of the Scd-1 gene (Fig. 7). The up-regulation of the apoE gene induces dyslipidemia characterized by increased plasma cholesterol and triglyceride levels. The down-regulation of the Scd-1 gene decreases VLDL levels by influencing synthesis of cholesteryl esters and triglycerides. The repression of the Scd-1 gene offsets partially the effects of apoE overexpression and results in moderate dyslipidemia.
Supplementary Material
Acknowledgments
We thank Anne Plunkett for preparing the manuscript and Gayle Forbes for technical assistance.
Footnotes
The on-line version of this article (available at http://www.jbc.org) contains supplemental Figs. 1– 8 and Table 1.
The abbreviations used are: JNK, c-Jun N-terminal kinase; Ad-dn-c-Jun, adenovirus expressing dn-c-Jun; Ad-GFP, adenovirus expressing GFP; Ad-ma-poE, adenovirus expressing mouse apoE; apoE, apolipoprotein E; dn-c-Jun, dominant negative c-Jun; FPLC, fast performance liquid chromatography; GAPDH, glyceraldehyde-3-phosphate dehydrogenase; GFP, green fluorescence protein; HDL, high density lipoprotein; IL, interleukin; LDL, low density lipoprotein; mapoE, mouse apoE; MIP-2, macrophage inflammatory protein 2; SAPK, stress-activated protein kinase; Scd, stearoyl coenzyme A desaturase; VLDL, very low density lipoprotein; TG, triglyceride; pfu, plaque-forming units; IL-1rn, IL-1 receptor antagonist; WT, wild type.
This work was supported by National Institutes of Health Grants HL48739 and HL33952 and the 6th Framework Programme of the European Union LSHM-CT-2006-037631, American Heart Association Grant SDG05354437 (to K. K.), and a grant from the Ministry of Education and the Ministry of Development of Greece (PENED-2001).
References
- 1.Angel P, Imagawa M, Chiu R, Stein B, Imbra RJ, Rahmsdorf HJ, Jonat C, Herrlich P, Karin M. Cell. 1987;49:729–739. doi: 10.1016/0092-8674(87)90611-8. [DOI] [PubMed] [Google Scholar]
- 2.Bohmann D, Bos TJ, Admon A, Nishimura T, Vogt PK, Tjian R. Science. 1987;238:1386–1392. doi: 10.1126/science.2825349. [DOI] [PubMed] [Google Scholar]
- 3.Bos TJ, Bohmann D, Tsuchie H, Tjian R, Vogt PK. Cell. 1988;52:705–712. doi: 10.1016/0092-8674(88)90408-4. [DOI] [PubMed] [Google Scholar]
- 4.Angel P, Allegretto EA, Okino ST, Hattori K, Boyle WJ, Hunter T, Karin M. Nature. 1988;332:166–171. doi: 10.1038/332166a0. [DOI] [PubMed] [Google Scholar]
- 5.Bos TJ, Rauscher FJ, III, Curran T, Vogt PK. Oncogene. 1989;4:123–126. [PubMed] [Google Scholar]
- 6.Landschulz WH, Johnson PF, McKnight SL. Science. 1988;240:1759–1764. doi: 10.1126/science.3289117. [DOI] [PubMed] [Google Scholar]
- 7.Abate C, Luk D, Curran T. Mol Cell Biol. 1991;11:3624–3632. doi: 10.1128/mcb.11.7.3624. [DOI] [PMC free article] [PubMed] [Google Scholar]
- 8.Alani R, Brown P, Binetruy B, Dosaka H, Rosenberg RK, Angel P, Karin M, Birrer MJ. Mol Cell Biol. 1991;11:6286–6295. doi: 10.1128/mcb.11.12.6286. [DOI] [PMC free article] [PubMed] [Google Scholar]
- 9.Angel P, Smeal T, Meek J, Karin M. New Biol. 1989;1:35–43. [PubMed] [Google Scholar]
- 10.Baichwal VR, Tjian R. Cell. 1990;63:815–825. doi: 10.1016/0092-8674(90)90147-7. [DOI] [PubMed] [Google Scholar]
- 11.Hirai S, Bourachot B, Yaniv M. Oncogene. 1990;5:39–46. [PubMed] [Google Scholar]
- 12.Struhl K. Nature. 1988;332:649–650. doi: 10.1038/332649a0. [DOI] [PubMed] [Google Scholar]
- 13.Kyriakis JM, Banerjee P, Nikolakaki E, Dai T, Rubie EA, Ahmad MF, Avruch J, Woodgett JR. Nature. 1994;369:156–160. doi: 10.1038/369156a0. [DOI] [PubMed] [Google Scholar]
- 14.Minden A, Lin A, Smeal T, Derijard B, Cobb M, Davis R, Karin M. Mol Cell Biol. 1994;14:6683–6688. doi: 10.1128/mcb.14.10.6683. [DOI] [PMC free article] [PubMed] [Google Scholar]
- 15.Pombo CM, Bonventre JV, Avruch J, Woodgett JR, Kyriakis JM, Force T. J Biol Chem. 1994;269:26546–26551. [PubMed] [Google Scholar]
- 16.Pulverer BJ, Kyriakis JM, Avruch J, Nikolakaki E, Woodgett JR. Nature. 1991;353:670–674. doi: 10.1038/353670a0. [DOI] [PubMed] [Google Scholar]
- 17.Smeal T, Binetruy B, Mercola DA, Birrer M, Karin M. Nature. 1991;354:494–496. doi: 10.1038/354494a0. [DOI] [PubMed] [Google Scholar]
- 18.Smeal T, Binetruy B, Mercola D, Grover-Bardwick A, Heidecker G, Rapp UR, Karin M. Mol Cell Biol. 1992;12:3507–3513. doi: 10.1128/mcb.12.8.3507. [DOI] [PMC free article] [PubMed] [Google Scholar]
- 19.Ichijo H. Oncogene. 1999;18:6087–6093. doi: 10.1038/sj.onc.1203129. [DOI] [PubMed] [Google Scholar]
- 20.Ahmad M, Theofanidis P, Medford RM. J Biol Chem. 1998;273:4616–4621. doi: 10.1074/jbc.273.8.4616. [DOI] [PubMed] [Google Scholar]
- 21.Beers A, Haas MJ, Wong NC, Mooradian AD. Biochemistry. 2006;45:2408–2413. doi: 10.1021/bi0518040. [DOI] [PubMed] [Google Scholar]
- 22.Chajek-Shaul T, Friedman G, Stein O, Shiloni E, Etienne J, Stein Y. Biochim Biophys Acta. 1989;1001:316–324. doi: 10.1016/0005-2760(89)90116-1. [DOI] [PubMed] [Google Scholar]
- 23.De Cesaris P, Starace D, Starace G, Filippini A, Stefanini M, Ziparo E. J Biol Chem. 1999;274:28978–28982. doi: 10.1074/jbc.274.41.28978. [DOI] [PubMed] [Google Scholar]
- 24.Hadman M, Lin W, Bush L, Bos TJ. Oncogene. 1998;16:655–660. doi: 10.1038/sj.onc.1201574. [DOI] [PubMed] [Google Scholar]
- 25.Hadzopoulou-Cladaras M, Lavrentiadou SN, Zannis VI, Kardassis D. Biochemistry. 1998;37:14078–14087. doi: 10.1021/bi9804176. [DOI] [PubMed] [Google Scholar]
- 26.Ioroi T, Yamamori M, Yagi K, Hirai M, Zhan Y, Kim S, Iwao H. J Pharmacol Sci. 2003;91:145–148. doi: 10.1254/jphs.91.145. [DOI] [PubMed] [Google Scholar]
- 27.Merhi-Soussi F, Kwak BR, Magne D, Chadjichristos C, Berti M, Pelli G, James RW, Mach F, Gabay C. Cardiovasc Res. 2005;66:583–593. doi: 10.1016/j.cardiores.2005.01.008. [DOI] [PubMed] [Google Scholar]
- 28.Metzler B, Hu Y, Dietrich H, Xu Q. Am J Pathol. 2000;156:1875–1886. doi: 10.1016/S0002-9440(10)65061-4. [DOI] [PMC free article] [PubMed] [Google Scholar]
- 29.Ricci R, Sumara G, Sumara I, Rozenberg I, Kurrer M, Akhmedov A, Hersberger M, Eriksson U, Eberli FR, Becher B, Boren J, Chen M, Cybulsky MI, Moore KJ, Freeman MW, Wagner EF, Matter CM, Luscher TF. Science. 2004;306:1558–1561. doi: 10.1126/science.1101909. [DOI] [PubMed] [Google Scholar]
- 30.Shin M, Yan C, Boyd D. Biochim Biophys Acta. 2002;1589:311–316. doi: 10.1016/s0167-4889(02)00195-7. [DOI] [PubMed] [Google Scholar]
- 31.Singh NN, Ramji DP. Arterioscler Thromb Vasc Biol. 2006;26:1323–1329. doi: 10.1161/01.ATV.0000220383.19192.55. [DOI] [PubMed] [Google Scholar]
- 32.Chang Y, Wang J, Lu X, Thewke DP, Mason RJ. J Lipid Res. 2005;46:2624–2635. doi: 10.1194/jlr.M500154-JLR200. [DOI] [PubMed] [Google Scholar]
- 33.Enoch HG, Catala A, Strittmatter P. J Biol Chem. 1976;251:5095–5103. [PubMed] [Google Scholar]
- 34.Zheng Y, Prouty SM, Harmon A, Sundberg JP, Stenn KS, Parimoo S. Genomics. 2001;71:182–191. doi: 10.1006/geno.2000.6429. [DOI] [PubMed] [Google Scholar]
- 35.Kaestner KH, Ntambi JM, Kelly TJ, Jr, Lane MD. J Biol Chem. 1989;264:14755–14761. [PubMed] [Google Scholar]
- 36.Ntambi JM, Buhrow SA, Kaestner KH, Christy RJ, Sibley E, Kelly TJ, Jr, Lane MD. J Biol Chem. 1988;263:17291–17300. [PubMed] [Google Scholar]
- 37.Miyazaki M, Jacobson MJ, Man WC, Cohen P, Asilmaz E, Friedman JM, Ntambi JM. J Biol Chem. 2003;278:33904–33911. doi: 10.1074/jbc.M304724200. [DOI] [PubMed] [Google Scholar]
- 38.Heinemann FS, Ozols J. Mol Biol Cell. 1998;9:3445–3453. doi: 10.1091/mbc.9.12.3445. [DOI] [PMC free article] [PubMed] [Google Scholar]
- 39.Miyazaki M, Kim YC, Gray-Keller MP, Attie AD, Ntambi JM. J Biol Chem. 2000;275:30132–30138. doi: 10.1074/jbc.M005488200. [DOI] [PubMed] [Google Scholar]
- 40.Attie AD, Krauss RM, Gray-Keller MP, Brownlie A, Miyazaki M, Kastelein JJ, Lusis AJ, Stalenhoef AF, Stoehr JP, Hayden MR, Ntambi JM. J Lipid Res. 2002;43:1899–1907. doi: 10.1194/jlr.m200189-jlr200. [DOI] [PubMed] [Google Scholar]
- 41.Brown PH, Alani R, Preis LH, Szabo E, Birrer MJ. Oncogene. 1993;8:877–886. [PubMed] [Google Scholar]
- 42.Brown PH, Chen TK, Birrer MJ. Oncogene. 1994;9:791–799. [PubMed] [Google Scholar]
- 43.Kypreos KE, van Dijk KW, van Der Zee A, Havekes LM, Zannis VI. J Biol Chem. 2001;276:19778–19786. doi: 10.1074/jbc.M100418200. [DOI] [PubMed] [Google Scholar]
- 44.He TC, Zhou S, da Costa LT, Yu J, Kinzler KW, Vogelstein B. Proc Natl Acad Sci U S A. 1998;95:2509–2514. doi: 10.1073/pnas.95.5.2509. [DOI] [PMC free article] [PubMed] [Google Scholar]
- 45.Fallaux FJ, Kranenburg O, Cramer SJ, Houweling A, Van Ormondt H, Hoeben RC, Van Der Eb AJ. Hum Gene Ther. 1996;7:215–222. doi: 10.1089/hum.1996.7.2-215. [DOI] [PubMed] [Google Scholar]
- 46.Kypreos KE, Morani P, van Dijk KW, Havekes LM, Zannis VI. Biochemistry. 2001;40:6027–6035. doi: 10.1021/bi002414a. [DOI] [PubMed] [Google Scholar]
- 47.Aalto-Setala K, Fisher EA, Chen X, Chajek-Shaul T, Hayek T, Zechner R, Walsh A, Ramakrishnan R, Ginsberg HN, Breslow JL. J Clin Investig. 1992;90:1889–1900. doi: 10.1172/JCI116066. [DOI] [PMC free article] [PubMed] [Google Scholar]
- 48.Li X, Kypreos K, Zanni EE, Zannis V. Biochemistry. 2003;42:10406–10417. doi: 10.1021/bi027093c. [DOI] [PubMed] [Google Scholar]
- 49.Sanoudou D, Haslett JN, Kho AT, Guo S, Gazda HT, Greenberg SA, Lidov HG, Kohane IS, Kunkel LM, Beggs AH. Proc Natl Acad Sci U S A. 2003;100:4666–4671. doi: 10.1073/pnas.0330960100. [DOI] [PMC free article] [PubMed] [Google Scholar]
- 50.Greenberg SA, Sanoudou D, Haslett JN, Kohane IS, Kunkel LM, Beggs AH, Amato AA. Neurology. 2002;59:1170–1182. doi: 10.1212/wnl.59.8.1170. [DOI] [PubMed] [Google Scholar]
- 51.Eisen MB, Spellman PT, Brown PO, Botstein D. Proc Natl Acad Sci U S A. 1998;95:14863–14868. doi: 10.1073/pnas.95.25.14863. [DOI] [PMC free article] [PubMed] [Google Scholar]
- 52.Sanoudou D, Vafiadaki E, Arvanitis DA, Kranias E, Kontrogianni-Konstantopoulos A. Physiol Genomics. 2005;21:131–143. doi: 10.1152/physiolgenomics.00259.2004. [DOI] [PubMed] [Google Scholar]
- 53.Tusher VG, Tibshirani R, Chu G. Proc Natl Acad Sci U S A. 2001;98:5116–5121. doi: 10.1073/pnas.091062498. [DOI] [PMC free article] [PubMed] [Google Scholar]
- 54.Kypreos KE, Teusink B, van Dijk KW, Havekes LM, Zannis VI. FASEB J. 2001;15:1598–1600. doi: 10.1096/fj.00-0882fje. [DOI] [PubMed] [Google Scholar]
- 55.Kypreos KE, Li X, van Dijk KW, Havekes LM, Zannis VI. Biochemistry. 2003;42:9841–9853. doi: 10.1021/bi0271796. [DOI] [PubMed] [Google Scholar]
- 56.Huang Y, Liu XQ, Rall SC, Jr, Taylor JM, von Eckardstein A, Assmann G, Mahley RW. J Biol Chem. 1998;273:26388–26393. doi: 10.1074/jbc.273.41.26388. [DOI] [PubMed] [Google Scholar]
- 57.Kypreos KE, van Dijk KW, Havekes LM, Zannis VI. J Biol Chem. 2005;280:6276–6284. doi: 10.1074/jbc.M413458200. [DOI] [PubMed] [Google Scholar]
- 58.Fazio S, Lee YL, Ji ZS, Rall SC., Jr J Clin Investig. 1993;92:1497–1503. doi: 10.1172/JCI116728. [DOI] [PMC free article] [PubMed] [Google Scholar]
- 59.Piedrahita JA, Zhang SH, Hagaman JR, Oliver PM, Maeda N. Proc Natl Acad Sci U S A. 1992;89:4471–4475. doi: 10.1073/pnas.89.10.4471. [DOI] [PMC free article] [PubMed] [Google Scholar]
- 60.Murphy N, Grimsditch DC, Parkin S, Vidgeon-Hart MP, Overend P, Groot PH, Graham A, Benson GM. Atherosclerosis. 2002;163:69–77. doi: 10.1016/s0021-9150(01)00755-9. [DOI] [PubMed] [Google Scholar]
- 61.Miller YI, Viriyakosol S, Worrall DS, Boullier A, Butler S, Witztum JL. Arterioscler Thromb Vasc Biol. 2005;25:1213–1219. doi: 10.1161/01.ATV.0000159891.73193.31. [DOI] [PubMed] [Google Scholar]
- 62.Dewberry R, Holden H, Crossman D, Francis S. Arterioscler Thromb Vasc Biol. 2000;20:2394–2400. doi: 10.1161/01.atv.20.11.2394. [DOI] [PubMed] [Google Scholar]
- 63.Marculescu R, Endler G, Schillinger M, Iordanova N, Exner M, Hayden E, Huber K, Wagner O, Mannhalter C. Diabetes. 2002;51:3582–3585. doi: 10.2337/diabetes.51.12.3582. [DOI] [PubMed] [Google Scholar]
- 64.Isoda K, Sawada S, Ishigami N, Matsuki T, Miyazaki K, Kusuhara M, Iwakura Y, Ohsuzu F. Arterioscler Thromb Vasc Biol. 2004;24:1068–1073. doi: 10.1161/01.ATV.0000127025.48140.a3. [DOI] [PubMed] [Google Scholar]
- 65.Kardassis D, Papakosta P, Pardali K, Moustakas A. J Biol Chem. 1999;274:29572–29581. doi: 10.1074/jbc.274.41.29572. [DOI] [PubMed] [Google Scholar]
- 66.Chang DJ, Paik YK, Leren TP, Walker DW, Howlett GJ, Taylor JM. J Biol Chem. 1990;265:9496–9504. [PubMed] [Google Scholar]
Associated Data
This section collects any data citations, data availability statements, or supplementary materials included in this article.