Abstract
In recent years, kinetic measurements of isotope effects of enzyme catalyzed reactions and their temperature dependence led to the development of theoretical models that were used to rationalize the findings. These models suggested that motions at the femto- to pico-second (fs to ps) time scale modulate the environment of the catalyzed reaction. Due to the fast nature of motions that directly affect the cleavage of a covalent bond, it is challenging to correlate the enzyme kinetics and dynamics related to that step. We report a study of formate dehydrogenase (FDH) that compares the temperature dependence of intrinsic kinetic isotope effects (KIEs) to measurements of the environmental dynamics at the fs-ps time scale (Bandaria et al., J. Am. Chem. Soc. 2008, 130, 22–23). The findings from this comparison of experimental kinetics and dynamics are consistent with models of environmentally coupled H-tunneling models, also known as Marcus-like models. Apparently, at tunneling ready conformations, the donor-acceptor distance, orientation, and fluctuations, seems to be well tuned for H- transfer and are not affected by thermal fluctuations slower than 20 ps. This phenomenon has been suggested in the past to be quite general in enzymatic reactions. Here, the kinetics and the dynamics measurements on a single chemical step and on fs-ps time scale, respectively, provide new insight and support for the relevant theoretical models. Furthermore, this methodology could be applied to other systems and be used to examine mutants for which the organization of the donor and acceptor is not ideal, or enzymes with different rigidity and different temperature optimum.
Keywords: Hydrogen transfer, Tunneling, Vibrational Spectroscopy, Photon Echo, Isotope Effect, Enzyme Dynamics
Introduction
The link between protein dynamics and function is of contemporary interest. Significant progress has been made in the effort to characterize protein motions and to understand their functional relevance. This is an immense task, as proteins are large complex molecules with motions that span a wide range of time scales. The importance of protein motions on the μs to ms range is well studied, however, the role of fs to ps dynamics is still debatable.1–3 Many experimental4–7 and computational studies2,3,8–11 have proposed protein motions at this fast timescale to be important and have used them to explain critical aspects of enzyme-catalyzed reactions. The temperature dependence of the kinetic isotope effect (KIE) is a method that has been used in recent years to study the nature of H-transfer in a variety of enzymes and their mutants, and has motivated an emerging view for enzyme-catalyzed C-H→C transfer reactions, such as the study reported here.
The nature of H-transfer can be examined from the temperature dependence of KIEs, as recently shown for a variety of enzymes and their mutants.4,5,12 The relationship between such kinetic data and enzyme dynamics can be analyzed using models of environmentally coupled tunneling, also addressed as Marcus-like models, as illustrated in Figure 1.4,8,10,13–18
Figure 1.
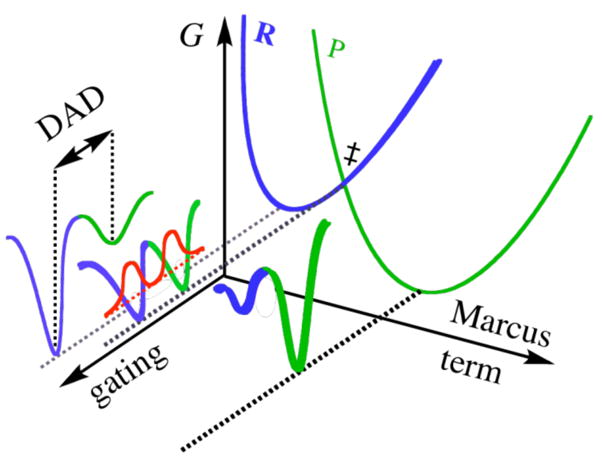
An illustration of a Marcus-like model. The “Marcus-term” axis indicates motions that carry the system to the TRC (‡). The “gating” axis indicates the fluctuations of the DAD. R and P are the reactant and product potential energy surfaces, respectively. The red curves show the wavefunctions of the hydrogen nucleus. Reproduced with permission from Willy.19
Equation 1 summarizes rate equations of various Marcus-like models in simplified terms:
| [1] |
where C is a constant representing the fraction of reactive enzymatic complexes (sometimes addressed as pre-organization). The first exponential term corresponds to the Marcus-term (mostly isotopically insensitive). This term is a function of λ, the work associated with reorganization of the heavy atoms to modulate the relative energies of the reactants and the products leading to the “tunneling-ready conformation” (TRC, assigned by ‡ as it analogues to the traditional transition state), the reaction’s exoergicity (ΔG°), and the absolute temperature T. The second exponential is the overlap integral (F(DAD), commonly a Frank-Condon term) that determines the tunneling probability for each particular donor-acceptor distance (DAD). This term is isotopically sensitive. The last exponential gives the probability of having a particular DAD based on the energy associated with that conformation. This term is temperature sensitive, and thus the integral in Eq. 1 constitutes the temperature dependency of the KIEs. This integral represents the overlap of the reactant and product nuclear wavefunctions averaged over the DADs sampled by the system. According to this model, a temperature-independent KIE indicates that the active site environment is optimized for H-tunneling, and thermally activated fluctuations of the DAD do not influence H-tunneling.ℑ This phenomenon has been reported mostly for highly evolved enzymes, studies with their natural substrates under physiological conditions. Commonly, mutation(s) or non-physiological conditions result in a temperature dependent KIE, indicating poorly organized reaction coordinate.20 Then, the thermally activated gating motions on fast timescales assist in bringing the donor and acceptor close enough together for efficient tunneling to occur. Molecular simulations of different enzymatic systems show that the gating motions have frequencies between 50 and 170 cm−1,7,10,21 corresponding to dynamics on a 200 to 700 fs time scale.
Here we report measurements of the temperature dependence of the intrinsic kinetic isotope effects (KIEs) for the hydride transfer catalyzed by formate dehydrogenase (FDH). The findings indicate that the environmentally coupled H-tunneling is insensitive to fluctuations of the DAD, also known as “gating”.4,10,14,22 We combine these findings with our infrared photon echo measurements of picosecond (ps) to femtosecond (fs) active site dynamics on the ternary complex of FDH with cofactor NAD+, and the transition state analog (TSA) azide.23 Together, the kinetic and the spectroscopic measurements suggest that near the TRC, the FDH complex is optimized for H-tunneling and the active-site environment that is coupled to the TSA is rigid. To our knowledge, this is the first system for which the nature of the hydride transfer step, and the associated environmental dynamics at the fs-ps time scale have both been studied. Combining these methodologies provides a tool to study the role of enzyme dynamics at the time scale of the H-transfer step.
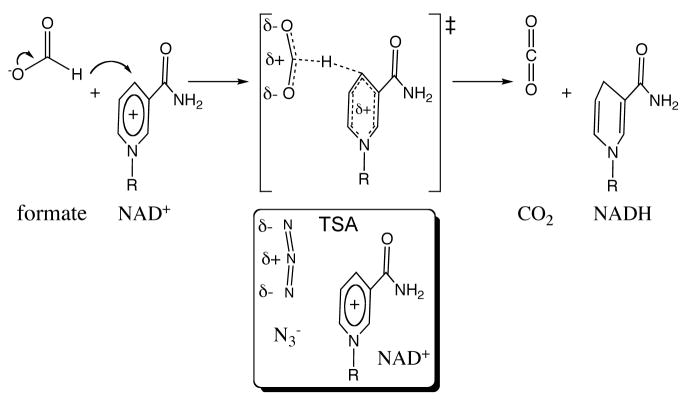
We report a study of the NAD+-dependent oxidation of formate to carbon dioxide via hydride transfer to the C-4 carbon of the nicotinamide ring of NAD+, catalyzed by FDH Figure 2. Figure 2 also illustrates the geometric and electronic properties of the TSA (azide), as explained more rigorously by Torres et al.24. Figure 3 shows the active-site structure of the ternary complex of FDH with NAD+ and azide based on a crystal structure of the ternary complex of FDH from Pseudomonas sp. 101, which has high sequence homology to the Candida biodinii enzyme used in our measurements.25 As shown in the figure, azide forms four strong H-bonds with residues at the active site, namely, Arg-284 and His-332 on one end and Ile-122 and Asn-146 on the other. These residues grasp the substrate in the active site and orient it for reaction. From the electron density it appears that the azide bound in the ternary complex is bent a little with its central nitrogen closer to the C4 of NAD+. Cleland and co-workers26 were the first to propose H-tunneling for FDH, thus this system is an attractive candidate for the kinetic examination presented here. Additionally, the azide TSA has a good infrared chromophore, making FDH an excellent system to address the relationship between the H-tunneling and the protein dynamics.
Figure 2.
The reaction catalyzed by FDH, with an illustration of the reaction’s TRC or transition state (‡). Below the TRC the relative orientation of the TSA azide, bent as observed in the crystal structure (Figure 3), and the substrate NAD+ is presented. It is apparent that the charge distribution of the azide and the TRC are similar, in accordance with its identification as TSA.24,27
Figure 3.
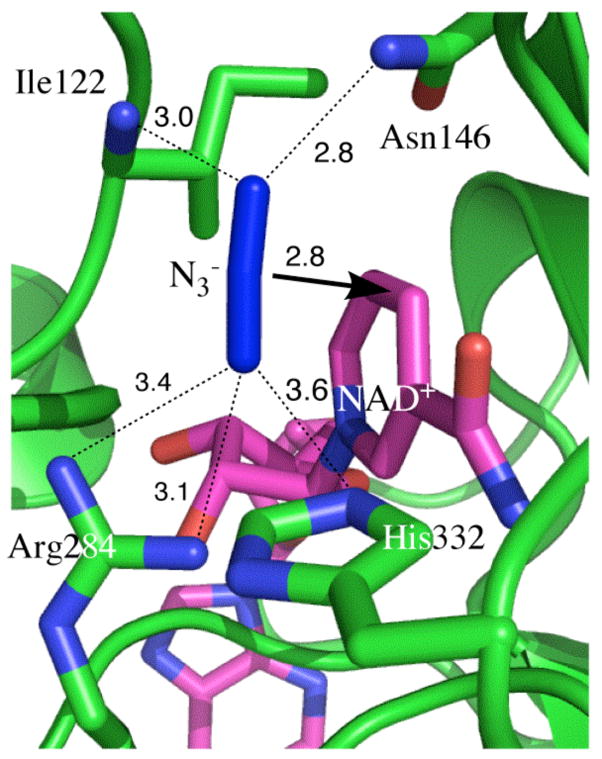
Active site structure of FDH-azide-NAD+ complex (PDB # 2NAD).25,28 All the nitrogens are in blue and the NAD is in magenta. The arrow indicates the reaction path from the H- donor to acceptor and the dashed lines represent the hydrogen bonds discussed in the text. All distances are in Å.
Experimental Section
Competitive KIEs
We measured both H/T and D/T competitive KIE to determine the intrinsic KIEs for FDH. The kinetic experiments were performed in 1 ml final volume of phosphate buffer (100 mM, pH 7.5) with 50 mM [14C]-NAD+ (660,000 dpm) and 40 mM [3H]-formic acid (3,300,000 dpm). The labeling includes a trace of tritium in protonated (for H/T KIE measurement) or 99.7% deuterated (for D/T KIE measurement) formic acid. During the reaction, the hydride is transferred from formic acid to [14C]-NAD+ to form [14C]-NADH(D). Thus [14C]-NADH/D formed is representative of the protium or deuterium transferred, and product [3H]-NADH is a measure of the tritium transferred. The pH was adjusted at the experimental temperature (with the relevant calibration buffers at that temperature). The H-transfer step with this enzyme is irreversible, which simplify the analysis.29 The reaction was initiated by adding the enzyme to the premixed and pre-equilibrated reaction mixture. At various fraction-conversions, aliquots of 90 μl are collected and the reaction was quenched with 50 mM of azide, for which the Kd that we have measured is 57 nM. Several aliquots were collected after the completion of the reaction (t∞). Additionally, two aliquots were collected before starting the reaction as control. The quenched aliquots are stored over dry ice prior to analysis on the HPLC (High Performance Liquid Chromatography). The HPLC method used for the separation of NAD+ and NADH is given in Table S1 in the Supplementary Information (I am sending you SI as a separate word document). HPLC separation was followed by LSC (Liquid Scintillation Counter) counting to determine the depletion of tritium in the product, which yields V/K KIE (KIE on kcat/KM for the H-donor, formic acid) as calculated from equations given below.30
where f is the fractional conversion of 14C-NAD+, and Rt and R∞ are the isotope ratios at times t and infinity, respectively.31 The labeling pattern applied for the experiment uses trace labeling of tritiated formate, mixed with wither protonated or deuterated formate, and 14C remote labeling on adenine part of the NAD+. The later serves as a reporter for the fraction conversion of the lighter isotope. The observed KIEs are presented in Table S2. The intrinsic KIEs can be obtained by using the observed KIEs by numerical solution of the Northrop equation.14,32 The numerical solution for Northrop equations for intrinsic H/T, H/D, and D/T KIEs was carried out using the FindRoot function available in Mathematica 6.33 Since errors cannot be simply propagated from the observed values (for the same reason a numerical solution is needed), all combinations of observed H/T and D/T KIEs were calculated and averaged at each temperature for graphical description (Figure 4, Table S3), and all the calculated, non-redundant, points at each temperature where used for the regression presented as lines in Figure 4 and for the extraction of the KIE on activation parameters, as described and justified in detail elsewhere.34 The raw kinetic data used to produce Figure 4 are available in the Supplementary Information available on-line.
Figure 4.
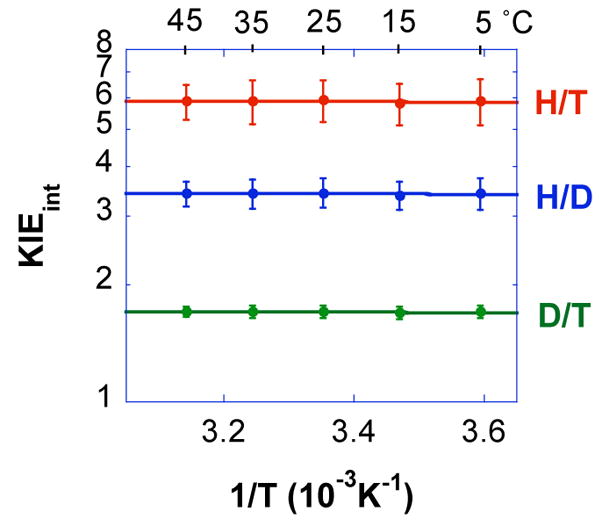
An Arrhenius plot of the intrinsic H/T (red), H/D (blue) and D/T (green) KIEs (log scale) vs. the reciprocal of the absolute temperature. The average KIEs are presented as points and the lines are an exponential fit of all the data points to the Arrhenius equation.
Photon-Echo Spectroscopy
Photon-echo spectroscopy is an optical technique inspired from the NMR spin echo experiment.35,36 It has been used to study electronic transitions and solvation dynamics in small molecules,37 fluctuations and energy transfer dynamics in large biomolecules,38 flexibility and selectivity in antibodies,39 and energy trapping and funneling in light-harvesting proteins.40 In the mid-infrared, photon echo spectroscopy has been used to study the solvation dynamics of small molecules in solvents, glasses, and ionic liquids,41,42 the hydrogen bonding dynamics in water,43 and the conformational dynamics of small peptides and proteins such as myoglobin, 44–47 HIV reverse transcriptase,48 horse radish peroxidase,49 and carbonic anhydrase.50
Our infrared photon echo measurements employ a commercial Ti:Sapphire laser that generates 100 fs pulses of 1 mJ pulse energy that are centered at 800 nm at a repetition rate of 1 kHz. A combination of two nonlinear processes, an optical parametric amplifier (OPA) based on β-barium borate (θ=27°, type II) and difference frequency generation (DFG) based on a 1mm type II AgGaS2 crystal (θ=50°) down converts the 800 nm light to 5 μm resonant with the azide antisymmetric stretch transition frequency. Beam splitters separate the infrared light into three pulses of approximately equal energy that travel along different paths. A computer- controlled translation stage in each path determines the time delays between the pulses. An iris placed before the pulses separate attenuates the pulses to ensure that higher order responses do not contribute to the photon-echo signal. We arrange the three pulses in a box geometry and use a 90° off-axis parabolic mirror with an effective focal length of 100 mm to focus the pulses into the sample. A liquid nitrogen cooled InSb detector measures the intensity of the photon echo signal generated in the −k1+k2+k3 direction,. A gated integrator and a lock-in amplifier referenced to an optical chopper with a chopping frequency of 500 Hz in the path of the second beam isolates the photon echo signal.
The time-delay between the first two pulses in the echo measurement is called the coherence time, τ. The time delay between the second and the third pulses is called the waiting time, T, and the time period after the third pulse is called the detection time. In a typical photon echo experiment, we measure the third-order signal as a function of the time delay τ for a given value of the waiting time T. This measurement is repeated for increasing values of T until the signal becomes too weak to detect. The T times that we can measure are limited by the vibrational population lifetime, which is about 2 ps for azide bound to FDH. We globally fit the photon echo data for each value of the waiting time and the infrared absorption spectrum using the nonlinear response function formalism 51,52 using a genarlized Kubo functional form for the frequency-frequency time correlation function (FFCF), , where the Δ and τ values are the fit parameters. This time correlation reports the amplitudes and time scale for frequency fluctuations of the azide antisymmetric stretch, which in turn reflect the amplitude and time scale of structural fluctuations within the enzyme active site.
Results
We determined the temperature dependence of the intrinsic KIE for formate dehydrogenase from Candida bodinii. Competitive KIE measurements give the 1°H/T and 1°D/T KIEs from 5 °C to 45 °C. The observed values (Table S2 in SI) were used to calculate intrinsic KIEs shown in Figure 4 using the Northop methodology.34,53,54 Figure 4 presents the intrinsic KIEs on a logarithmic scale vs. the reciprocal of the absolute temperature. Curve fitting was carried out in KaleidaGraph (Version 4.03) as a least root-mean-square fit exponential regression for proper error analysis. This yielded the isotope effects on the energy of activation (cf., the exponential factor) and on the preexponential factor of the Arrhenius equation.
Fitting the intrinsic KIEs to the Arrhenius equation 54 indicates no temperature dependence (ΔEa H/T = −0.02 ± 0.08, H/D = −0.02 ± 0.06, and D/T = −0.007 ± 0.03 kcal/mol) and the isotope effect on the Arrhenius pre-exponential factors are similar to the measured intrinsic KIEs (AH/AT = 6.1 ± 0.8, AH/AD = 3.5 ± 0.3, and AD/AT = 1.7 ± 0.1). These values are larger than the semiclassical limits (1.73, 1.41 and 1.22 respectively)30 indicating deviation from semiclassical models (i.e., models that exclude tunneling).
Figure 5 shows the FFCF for the azide-NAD-FDH ternary complex in D2O. The parameters for the FFCF from the global fit are, Δ1 = 1.73 ps−1, τ1 = 0.25 ps, Δ2 = 1.43 ps−1, τ2 = 3 ps. This is a new illustration of the findings reported in ref 23 that specifically emphasizes the findings relevant to the current paper. Notably, there is no static component to the FFCF decay. This result is unique because all proteins that have been studied to date show significant contributions to the FFCF on the time scale of ten picoseconds or longer.
Figure 5.
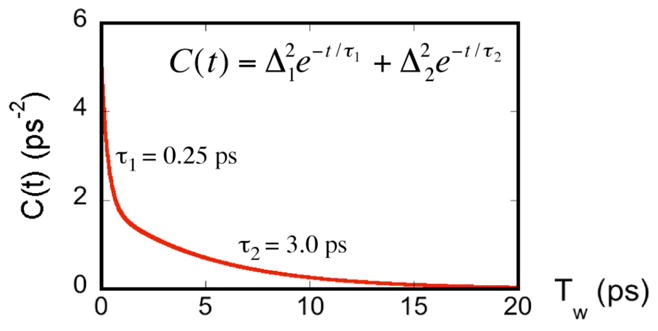
A plot of the FFCF (C(t)) for the FDH-azide- NAD+. Data are from ref 23 and the graph presents the decay of the function as function of TW (see text).
Discussion
We examined the fs-ps dynamics of the enzymatic complex reported by the TSA. The FFCF for the ternary complex of FDH with azide and NAD+ decays with time constants substantially less than 10 ps. Figure 5 presents the FFCF from the photon echo experiments,23 and clearly demonstrates the unusual decay to an asymptote of zero, rather than to a finite static component. This finding contrasts with the FFCF measured for azide in solution or in the binary FDH complex (no NAD+, Bandaria et al., unpublished data). Commonly, structural heterogeneity sampled on much longer time scales than our measurement causes the FFCF to deviate from zero asymptotically. This shift from zero appears as a “static component”. The absence of such a component for the ternary complexes of FDH indicates that the active site is very well organized so that all the environmental fluctuations that affect the TSA are sampled within a few picoseconds. The two time constants for the decay of the FFCF for the FDH-NAD+-N3− complex are 250 fs (180 cm−1) and 3 ps (1 cm−1). These may reflect the collective vibrations of the four H-bonding partners that correspond to the reorganization and gating motions, that in systems that are well optimized for tunneling sample a temperature independent conformational space (the integral in Eq. 1). These fluctuations are in the same range implicated by several independent theoretical works by Schwartz1,55, Hammes-Schiffer,21,56, Warshel,16 Klinman 20, Scrutton their co-workers 57.
The KIEs and the infrared results complement each other and present a consistent picture of the H-transfer step and the structural fluctuations of its environment. The observations that the KIEs are temperature independent and the FFCF shows no static component are in accordance with a model in which at the TRC, the entire structure around the active site is rigid along the coordinates sensed by the reactants, and the arrangement of the active site residues and their induced electrostatic environment optimize the average DAD for efficient tunneling. The lack of temperature dependence of the KIEs indicates no contribution of thermally activated DAD gating to H-tunneling, and the lack of static component in the vibrational spectroscopy measurements indicates a narrow structural distribution with small amplitude, high frequency motions that fully sample the distribution in a few picoseconds.
Conclusions
Taken together, intrinsic kinetics and vibrational dynamics can serve as a powerful tool for understanding of the role the dynamics on fs to ps time scales in enzyme-catalyzed reactions in general. Seeking a correlation between these measurements in various enzymes and mutants may reveal the role of these fast dynamics in C-H bond activation by FDH and in the future in enzymatic H-transfer reactions in other systems.
Supplementary Material
Acknowledgments
This work was supported by the Roy J. Carver Charitable Trust & NSF CHE-0644410 (CMC); NIH R01 GM65368 & NSF CHE-0715448 (AK); and fellowship from the Center for Bioprocessing and Biocatalysis at the University of Iowa (JB).
Footnotes
Note that temperature independent KIEs indicate that the integrated FC values for the conformations sampled by the donor and acceptor are not affected by vibrational (thermal) excitation, as they fluctuate around ideal average distance. The gating motion at the fs time scale (50–180 cm−1) need not be suppressed.3,11
Supporting Information Available Tables with the HPLC elusion, the raw kinetic data, and the intrinsic data presented graphically in Figure 4, are available as Supporting Information. This information is available free of charge via the Internet at http://pubs.acs.org/.
References
- 1.Caratzoulas S, Mincer JS, Schwartz SD. J Am Chem Soc. 2002;124:3270–3276. doi: 10.1021/ja017146y. [DOI] [PubMed] [Google Scholar]
- 2.Benkovic SJ, Hammes-Schiffer S. Science. 2003;301:1196–1202. doi: 10.1126/science.1085515. [DOI] [PubMed] [Google Scholar]
- 3.Hammes-Schiffer S, Benkovic SJ. Annu Rev Biochem. 2006;75:519–541. doi: 10.1146/annurev.biochem.75.103004.142800. [DOI] [PubMed] [Google Scholar]
- 4.Nagel ZD, Klinman JP. Chem Rev. 2006;106:3095–3118. doi: 10.1021/cr050301x. [DOI] [PubMed] [Google Scholar]
- 5.Wang L, Goodey NM, Benkovic SJ, Kohen A. Proc Natl Acad Sci U S A. 2006;103:15753–15758. doi: 10.1073/pnas.0606976103. [DOI] [PMC free article] [PubMed] [Google Scholar]
- 6.Kohen A. Kinetic isotope effects as probes for hydrogen tunneling in enzyme catalysis. In: Kohen A, Limbach HH, editors. Isotope effects in chemistry and biology. Vol. 28. Taylor & Francis, CRC Press; New York: 2005. pp. 743–764. [Google Scholar]
- 7.Masgrau L, Roujeinikova A, Johannissen LO, Hothi P, Basran J, Ranaghan KE, Mulholland AJ, Sutcliffe MJ, Scrutton NS, Leys D. Science. 2006;312:237–241. doi: 10.1126/science.1126002. [DOI] [PubMed] [Google Scholar]
- 8.Warshel A, Olsson MHM, Villá-Freixa J. Computer simulations of isotope effects in enzyme catalysis. In: Kohen A, Limbach HH, editors. Isotope effects in chemistry and biology. Vol. 23. Taylor & Francis, CRC Press; Boca Raton, FL: 2006. pp. 621–644. [Google Scholar]
- 9.Truhlar DG. Variational transition state theory and multidimensional tunneling for simple and complex reacrions in the gas phase, solids, Liquids, and enzymes. In: Kohen A, Limbach HH, editors. Isotope effects in chemistry and biology. Vol. 22. Taylor & Francis, CRC Press; Boca Raton, FL: 2006. pp. 579–620. [Google Scholar]
- 10.Schwartz SD. Vibrationally enhanced tunneling from the temperature dependence of KIE. In: Kohen A, Limbach HH, editors. Isotope effects in chemistry and biology. Vol. 18. Taylor & Francis, CRC Press; Boca Raton, FL: 2006. pp. 475–498. [Google Scholar]
- 11.Antoniou D, Basner J, Núñez S, Schwartz SD. Chem Rev. 2006;106:3170–3187. doi: 10.1021/cr0503052. [DOI] [PubMed] [Google Scholar]
- 12.Sutcliffe MJ, Masgrau L, Roujeinikova A, Johannissen LO, Hothi P, Basran J, Ranaghan KE, Mulholland AJ, Leys D, Scrutton NS. Philos Trans R Soc B-Biol Sci. 2006;361:1375–1386. doi: 10.1098/rstb.2006.1878. [DOI] [PMC free article] [PubMed] [Google Scholar]
- 13.Pudney CR, Hay S, Sutcliffe MJ, Scrutton NS. J Am Chem Soc. 2006;128:14053–14058. doi: 10.1021/ja0614619. [DOI] [PubMed] [Google Scholar]
- 14.Kohen A. Kinetic isotope effects as probes for hydrogen tunneling in enzyme catalysis. In: Kohen A, Limbach HH, editors. Isotope effects in chemistry and biology. Vol. 28. Taylor & Francis, CRC Press; Boca Raton, FL: 2006. pp. 743–764. [Google Scholar]
- 15.Marcus RA. J Phys Chem B. 2007;111:6643–6654. doi: 10.1021/jp071589s. [DOI] [PubMed] [Google Scholar]
- 16.Villa J, Warshel A. J Phys Chem B. 2001;105:7887–7907. [Google Scholar]
- 17.Kiefer PM, Hynes JT. Interpretation of primary kinetic isotope effects for adiabatic and nonadiabatic proton transfer reactions in a polar environment. In: Kohen A, Limbach HH, editors. Isotope effects in chemistry and biology. Vol. 21. Taylor & Francis Ltd., LLC CRC; Boca Raton, FL: 2005. pp. 549–578. [Google Scholar]
- 18.Ruiz-Pernia JJ, Tunon I, Moliner V, Hynes JT, Roca M. J Am Chem Soc. 2008;130:7477–7488. doi: 10.1021/ja801156y. [DOI] [PubMed] [Google Scholar]
- 19.Yahashiri A, Howell EE, Kohen A. Chemphyschem. 2008;9:980–982. doi: 10.1002/cphc.200800067. [DOI] [PMC free article] [PubMed] [Google Scholar]
- 20.Meyer MP, Tomchick DR, Klinman JP. Proc Natl Acad Sci U S A. 2008;105:1146–1151. doi: 10.1073/pnas.0710643105. [DOI] [PMC free article] [PubMed] [Google Scholar]
- 21.Hatcher E, Soudackov AV, Hammes-Schiffer S. J Am Chem Soc. 2007;129:187–196. doi: 10.1021/ja0667211. [DOI] [PubMed] [Google Scholar]
- 22.Garcia-Viloca M, Gao J, Karplus M, Truhlar DG. Science. 2003;303:186–195. doi: 10.1126/science.1088172. [DOI] [PubMed] [Google Scholar]
- 23.Bandaria JN, Dutta S, Hill SE, Kohen A, Cheatum CM. J Am Chem Soc. 2008;130:22–23. doi: 10.1021/ja077599o. [DOI] [PMC free article] [PubMed] [Google Scholar]
- 24.Torres RA, Schiott B, Bruice TC. J Am Chem Soc. 1999;121:8164–8173. [Google Scholar]
- 25.Popov VO, Lamzin VS. Biochem J. 1994;301:625–643. doi: 10.1042/bj3010625. [DOI] [PMC free article] [PubMed] [Google Scholar]
- 26.Hermes JD, Morrical SW, O’Leary MH, Cleland WW. Biochemistry. 1984;23:5479–5488. doi: 10.1021/bi00318a016. [DOI] [PubMed] [Google Scholar]
- 27.Lamzin VS, Dauter Z, Popov VO, Harutyunyan EH, Wilson KS. J Mol Biol. 1994;236:759–785. doi: 10.1006/jmbi.1994.1188. [DOI] [PubMed] [Google Scholar]
- 28.A crystal structure of the ternary complex of FDH from Pseudomonas sp. 101, which has a high sequence homology to the Candida biodinii enzyme used in out measurements.
- 29.Blanchard JS, Cleland WW. Biochemistry. 1980;19:3543–3550. doi: 10.1021/bi00556a020. [DOI] [PubMed] [Google Scholar]
- 30.Melander L, Saunders WH. Reaction rates of isotopic molecules. 4. Krieger, R. E; Malabar, FL: 1987. [Google Scholar]
- 31.Hong BY, Maley F, Kohen A. Biochemistry. 2007;46:14188–14197. doi: 10.1021/bi701363s. [DOI] [PMC free article] [PubMed] [Google Scholar]
- 32.Northrop DB. Intrinsic isotope effects in enzyme catalyzed reactions. In: Cook PF, editor. Enzyme mechanism from isotope effects. CRC Press; Boca Raton, Fl: 1991. pp. 181–202. [Google Scholar]
- 33.Wolfarm Research I Mathematica. 6. Wolfarm Research, Inc; Champaign, Illinois: 2007. [Google Scholar]
- 34.Wang L, Tharp S, Selzer T, Benkovic SJ, Kohen A. Biochemistry. 2006;45:1383–1392. doi: 10.1021/bi0518242. [DOI] [PMC free article] [PubMed] [Google Scholar]
- 35.de Boeij WP, Pshenichnikov MS, Wiersma DW. Chem Phys. 1998;233:287–309. [Google Scholar]
- 36.Joo TH, Jia YW, Yu JY, Lang MJ, Fleming GR. J Chem Phys. 1996;104:6089–6108. [Google Scholar]
- 37.Maekawa H, Ohta K, Tominaga K. J Phys Chem A. 2004;108:9484–9491. [Google Scholar]
- 38.Agarwal R, Krueger BP, Scholes GD, Yang M, Yom J, Mets L, Fleming GR. J Phys Chem B. 2000;104:2908–2918. [Google Scholar]
- 39.Jimenez R, Case DA, Romesberg FE. J Phys Chem B. 2002;106:1090–1103. [Google Scholar]
- 40.Lee H, Cheng YC, Fleming GR. Science. 2007;316:1462–1465. doi: 10.1126/science.1142188. [DOI] [PubMed] [Google Scholar]
- 41.Lang B, Angulo G, Vauthey E. J Phys Chem A. 2006;110:7028–7034. doi: 10.1021/jp057482r. [DOI] [PubMed] [Google Scholar]
- 42.Tokmakoff A, Zimdars D, Urdahl RS, Francis RS, Kwok AS, Fayer MD. J Phys Chem. 1995;99:13310–13320. [Google Scholar]
- 43.Eaves JD, Loparo JJ, Fecko CJ, Roberts ST, Tokmakoff A, Geissler PL. Proc Natl Acad Sci U S A. 2005;102:13019–13022. doi: 10.1073/pnas.0505125102. [DOI] [PMC free article] [PubMed] [Google Scholar]
- 44.Ohta K, Maekawa H, Saito S, Tominaga K. J Phys Chem A. 2003;107:5643–5649. [Google Scholar]
- 45.Asplund MC, Zanni MT, Hochstrasser RM. Proc Natl Acad Sci U S A. 2000;97:8219–8224. doi: 10.1073/pnas.140227997. [DOI] [PMC free article] [PubMed] [Google Scholar]
- 46.Rella CW, Rector KD, Kwok A, Hill JR, Schwettman HA, Dlott DD, Fayer MD. J Phys Chem. 1996;100:15620–15629. doi: 10.1103/PhysRevLett.77.1648. [DOI] [PubMed] [Google Scholar]
- 47.Rella CW, Kwok A, Rector K, Hill JR, Schwettman HA, Dlott DD, Fayer MD. Phys Rev Lett. 1996;77:1648–1651. doi: 10.1103/PhysRevLett.77.1648. [DOI] [PubMed] [Google Scholar]
- 48.Fang C, Bauman JD, Das K, Remorino A, Arnold E, Hochstrasser RM. Proc Natl Acad Sci U S A. 2008;105:1472–1477. doi: 10.1073/pnas.0709320104. [DOI] [PMC free article] [PubMed] [Google Scholar]
- 49.Finkelstein IJ, Ishikawa H, Kim S, Massari AM, Fayer MD. Proceedings of the National Academy of Sciences of the United States of America. 2007;104:2637–2642. doi: 10.1073/pnas.0610027104. [DOI] [PMC free article] [PubMed] [Google Scholar]
- 50.Lim MH, Hamm P, Hochstrasser RM. Proc Natl Acad Sci U S A. 1998;95:15315–15320. doi: 10.1073/pnas.95.26.15315. [DOI] [PMC free article] [PubMed] [Google Scholar]
- 51.Sung J, Silbey RJ. Journal of Chemical Physics. 2001;115:9267–9287. [Google Scholar]
- 52.Mukamel S. Principles of nonlinear optical spectroscopy. Oxford University Press; N. Y. and Oxford: 1997. [Google Scholar]
- 53.Sikorski RS, Wang L, Markham KA, Rajagopalan PTR, Benkovic SJ, Kohen A. J Am Chem Soc. 2004;126:4778–4779. doi: 10.1021/ja031683w. [DOI] [PubMed] [Google Scholar]
- 54.All measured and calculated data are presented in the Supplementary Information available free of charge at www.acs.org.
- 55.Antoniou D, Schwartz SD. J Phys Chem B. 2001;105:5553–5558. [Google Scholar]
- 56.Hatcher E, Soudackov AV, Hammes-Schiffer S. J Am Chem Soc. 2004;126:5763–5775. doi: 10.1021/ja039606o. [DOI] [PubMed] [Google Scholar]
- 57.Johannissen LO, Scrutton NS, Sutcliffe MJ. J R Soc Interface. 2008;5:225–232. doi: 10.1098/rsif.2008.0068.focus. [DOI] [PMC free article] [PubMed] [Google Scholar]
Associated Data
This section collects any data citations, data availability statements, or supplementary materials included in this article.


