

SUMMARY
The expression of NKX3.1, a transcriptional regulator and tumor suppressor gene in prostate cancer, is downregulated during early stages of prostate tumorigenesis. However, little is known of the alterations in gene expression that occur as a result of this event. We combined laser capture microdissection and gene expression profiling to analyze the molecular consequences of Nkx3.1 loss during prostate cancer initiation using Nkx3.1-deficient mice. This analysis identified a cohort of genes (loss-of-Nkx3.1 signature) that are aberrantly overexpressed during loss-of-Nkx3.1 driven tumor initiation. We studied the expression of these same genes in independent loss-of-Pten and c-myc overexpression prostate adenocarcinoma mouse models. Nkx3.1 expression is lost in prostate epithelial proliferation in both of these mouse models. However, Nkx3.1 loss is an early event of tumor development in the loss-of-Pten model, whereas it occurs at later stages in c-myc transgenic mice. A member of genes of the loss-of-Nkx3.1 signature, like clusterin and quiescin Q6, are highly expressed in prostatic hyperplasia and intraepithelial neoplasia (PIN) lesions that also lack Nkx3.1 in the Pten-deficient prostate, but not in similar lesions in the c-myc transgenic model. Meta-analysis of multiple prostate cancer gene expression datasets including those from loss-of-Nkx3.1, loss-of-Pten, c-myc overexpression, and constitutively active Akt prostate cancer models, further confirmed that genes associated with the loss-of-Nkx3.1 signature integrate with Pten-Akt signaling pathways, but do not overlap with molecular changes associated with the c-myc signaling pathway. In human prostate tissue samples, loss of NKX3.1 expression and corresponding clusterin overexpression are co-localized at sites of prostatic inflammatory atrophy, a possible very early stage of human prostate tumorigenesis. Collectively, these results suggest that the molecular consequences of NKX3.1 loss depend on the epithelial proliferative stage at which its expression is lost and, that alterations in the Pten-Akt-Nkx3.1 axis are important for prostate cancer initiation.
INTRODUCTION
Prostate cancer is the most common non-skin cancer in men and the second-leading cause of death from cancer in the United States. Human prostate tumorigenesis follows a canonical pattern of progression: formation of prostatic intraepithelial neoplasia (PIN), invasion into the stroma, and metastasis to sites such as lymph nodes and bone. As with most human cancers, prostate tumorigenesis involves a series of genetic alterations. Mutations in androgen receptor, PTEN, and RNase L (Nelson et al., 2003; Abate-Shen & Shen, 2000; Simard et al., 2003), and recently identified chromosomal translocations between TMPRSS2 and ETS transcription factors (Tomlins et al., 2005) have been identified in advanced stages of prostate cancer. However, there is only limited knowledge of specific genes and molecular pathways responsible for tumor initiation and early intraepithelial neoplastic growth (Ashida et al., 2004).
One critical gene associated with early stages of prostate tumorigenesis is NKX3.1, which encodes a homeodomain transcription factor. NKX3.1 is regulated by androgens and expressed specifically in luminal epithelial cells of the prostate. Loss-of-heterozygosity (LOH) associated with the majority of PIN lesions and prostate tumors occurs most commonly at human chromosome 8p21 where the NKX3.1 gene is located (Bova et al., 1993; He et al., 1997; Macoska et al., 1995; Asatiani et al., 2005). NKX3.1 expression is decreased or absent in ∼50% of PIN lesions and primary prostate tumors and, in as many as 80% of all metastatic tumors (Bowen et al., 2000). Furthermore, germ-line mutations of NKX3.1 that alter the homeodomain structure and DNA-binding activity are associated with increased risk of prostate cancer (Zheng et al., 2006). Conversely, overexpression of NKX3.1 inhibits cell proliferation and anchorage-independent growth in vitro, and suppresses tumor growth in nude mice in vivo (Kim et al., 2002). Thus, these molecular characteristics, in conjunction with extensive LOH data, reinforce a role for NKX3.1 as a prostate tumor suppressor gene.
Consistent with the frequent LOH of the NKX3.1 locus in human PIN, mice in which a single Nkx3.1 allele is conditionally deleted in adulthood also develop prostatic hyperplasia and PIN, the latter recapitulating an early stage of prostate tumorigenesis in humans (Abdulkadir et al., 2002). Using this model, we previously showed that proper regeneration of the prostate after castration and hormone replacement depends on Nkx3.1 expression, as Nkx3.1 regulates the rate at which proliferating luminal epithelial cells exit the cell cycle (Magee et al., 2003). These results demonstrate that loss of Nkx3.1 expression is a major initiating event in prostate tumorigenesis in which Nkx3.1 plays a ‘gatekeeper’ role in the prostate, preventing other genetic insults from initiating prostate tumorigenesis.
Two recently described mouse models of prostate adenocarcinoma, a conditional Pten loss-of-function model (Wang et al., 2003) and a transgenic c-myc overexpression model (Ellwood-Yen et al., 2003), further underscore the significance of Nkx3.1 as a tumor suppressor gene. Interestingly, Nkx3.1 expression is lost in both of these models, although the timing of the loss during malignant progression varies. For example, in the loss-of-Pten model, Nkx3.1 expression is lost in hyperplastic cells, the earliest stage of prostate tumorigenesis in mice, whereas a similar loss is not seen until the PIN to invasive carcinoma transition in c-myc overexpression transgenic mice. Interestingly, restoration of Nkx3.1 expression in Pten-deficient epithelium prevents tumor initiation via stabilization of p53 and inhibition of Akt activity (Lei et al., 2006), accentuating the essential role of NKX3.1 loss in the initiation of PTEN-deficient prostate tumorigenesis. In the TRAMP prostate cancer model, disease progression is also associated with reduction of Nkx3.1 protein levels (Bethel & Bieberich, 2007). Finally, in human tissues NKX3.1 expression is lost or reduced in focal atrophy (Bethel et al., 2006), a subset of which – proliferative inflammatory atrophy (PIA) – has been forwarded as a possible neoplastic precursor (Nelson et al., 2003; De Marzo et al., 1999), as well as in PIN and advanced stages of prostate cancer (Bethel et al., 2006). In addition, inflammatory cytokines such as tumor necrosis factor α and interleukin-1β accelerate NKX3.1 protein loss by inducing rapid ubiquitination and proteasomal degradation (Markowski et al., 2008). These findings support the idea that NKX3.1 is a prostate tumor suppressor that acts in the early stage of the tumorigenic process to prevent luminal cells from becoming neoplastic (Lei et al., 2006); however, the specific molecular consequences of these early events, including how the timing of NKX3.1 loss during malignant progression influences tumor behavior, is unclear.
The aim of this study was to identify a cohort of genes whose regulation is altered by Nkx3.1 loss during the early stages of prostate tumorigenesis. Using laser capture microdissection (LCM) and gene expression profiling, we identified a subset of genes, the loss-of-Nkx3.1 genetic signature, that are altered in a stepwise manner during prostate tumor progression. Meta-analysis of multiple prostate cancer gene expression datasets further confirmed that the stage at which Nkx3.1 is lost is associated with the molecular phenotype of the resulting prostate epithelial proliferative lesions. The composite identity of these NKX3.1 regulated genes provides an unique tool for exploring the molecular consequences of loss-of-NKX3.1 on the initiation and progression of prostate cancer; particularly, for those tumors associated with altered PTEN-AKT signaling.
RESULTS
Molecular characterization of prostate cancer initiated by loss of Nkx3.1
Since loss of Nkx3.1 expression is frequently associated with early stages of prostate tumorigenesis, we hypothesized that Nkx3.1 is a gatekeeper gene whose loss is needed for further progression to neoplasia. To understand the “gatekeeper” function of Nkx3.1 and identify downstream genes and pathways dysregulated by loss of Nkx3.1 expression at different stages of prostate tumorigenesis, we performed gene expression profiling analyses on microdissected glands from Nkx3.1-deficient prostate tissues during different stages of malignant progression. We focused these analyses on the dorsolateral prostate which is most analogous to the peripheral zone of the human prostate where most tumors originate (Ouyang et al., 2008). Pair-wise analysis of gene expression profiles from histologically normal prostate versus hyperplastic, and hyperplastic versus PIN prostatic tissue using Significance Analysis of Microarrays (SAM) (Tusher et al., 2001) revealed that relative to normal prostate, most differentially expressed genes were expressed at higher levels in prostate hyperplasia (83%, 83/100) and PIN (80%, 79/99), whereas less than 20% of differentially expressed genes are downregulated in hyperplasia (17%, 17/100) and PIN (20%, 20/99).
The relative expression levels of a set of the most statistically significant annotated gene transcripts that are overexpressed in PIN relative to normal prostate are displayed in Figure 1. Notably, the expression of these genes shows an intermediate level of expression in hyperplastic lesions. The genes comprising this ‘loss-of-Nkx3.1 signature’ include prostate stem cell antigen (PSCA), a well known marker for prostate cancer progression in humans and mouse (Tricoli et al., 2004) as well as those involved in oxidative stress, protein processing, and signal transduction (Supplemental Table S1).
Figure 1. Expression profiles of loss-of-Nkx3.1 signature genes.
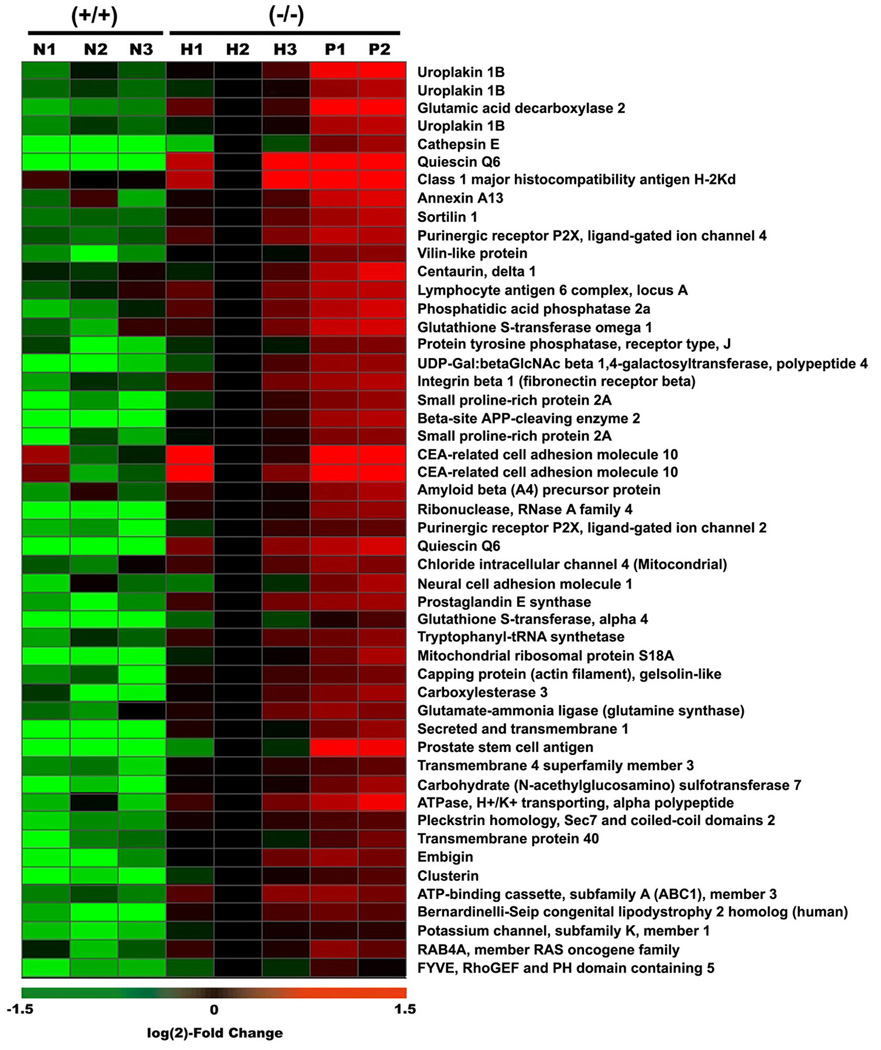
Fifty of the most significantly differentially expressed, non-EST probes are represented in this heat map. Heat map colors reflect log(2) fold change values relative to expression of each gene in one reference sample of hyperplasia (H2). N, H, and P represent normal (2 month old wildtype prostate), hyperplastic (2 month old Nkx3.1-deficient prostate), and PIN (5 month old Nkx3.1-deficient prostate) cells, respectively.
Localized expression of loss-of-Nkx3.1 signature genes in early prostate cancer progression
To confirm the dysregulation of genes identified above in early prostate cancer progression, we investigated expression of several representative genes including quiescin Q6, clusterin, small proline-rich protein 2A (Sprr2a), and cathepsin E. Quantitative RT-PCR (qRT-PCR) analysis using RNA templates obtained by LCM of normal, hyperplasia, and PIN lesions showed epithelial proliferative stage-specific upregulation of these genes (Figure 2A, 3A). The expression of Sprr2a and cathepsin E was also increased in a stepwise manner in early lesions from Nkx3.1-deficient mice (Supplemental Figure S1, S2). Higher expression of quiescin Q6 and Sprr2a in total prostates of Nkx3.1-deficient mice corroborated microarray data (Figure 2B, Supplemental Figure S1B). In addition, comparable expression of clusterin (Figure 3B) and cathepsin E (Supplemental Figure S2B) in prostates of both wildtype and Nkx3.1-deficient mice suggest that not all changes in gene expression in the loss-of-Nkx3.1 signatures are simply a result of loss-of-Nkx3.1 itself. In situ hybridization was also performed to examine both stage-specific and cell type-specific expression. Adjacent tissue sections were examined histologically so that correlations between gene expression and proliferative stage (e.g., hyperplasia or PIN) could be made. We found localized, high levels of quiescin Q6 and clusterin mRNAs in areas of prostatic hyperplasia and PIN (Arrows, Figure 2C, 3C). These genes were not upregulated in Nkx3.1-deficient prostate glands with normal histology (Arrowheads, Figure 2C, 3C). In addition, immunofluorescent staining for clusterin protein showed a similar step-wise increase during the early stages of prostate tumorigenesis (Figure 3D). These results demonstrate that these genes are aberrantly overexpressed only in the hyperplastic luminal epithelial cells and PIN lesions, signifying the role for Nkx3.1 loss in early phases of mouse prostate tumorigenesis.
Figure 2. Aberrant expression of quiescin Q6 in hyperplasic and PIN lesions in Nkx3.1−/− mice.
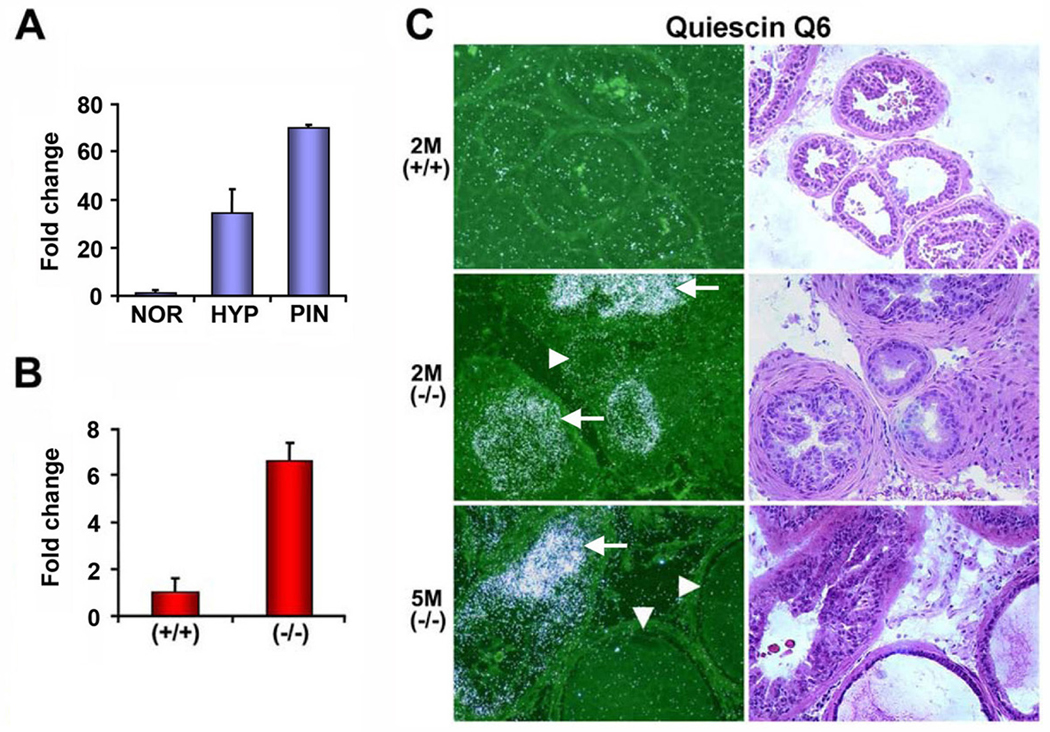
(A) qRT-PCR analysis of quiescin Q6 expression using RNA samples obtained by LCM from NOR (normal glands from 2 month old Nkx3.1+/+ mice), HYP (hyperplastic lesions from 2 month old Nkx3.1−/− mice), and PIN (prostatic intraepithelial neoplasia from 5 month old Nkx3.1−/− mice). (B) Quiescin Q6 expression by qRT-PCR using total prostate RNA from 2 month old wildtype and Nkx3.1−/− mice. (C) In situ hybridization with 35S-labeled antisense probe for quiescin Q6. Arrows in the middle and bottom panels indicate representative hyperplastic glands and PIN which overexpress quiescin Q6, respectively. Note that arrowheads indicate adjacent normal glands that do not express quiescin Q6. The right panel with H&E staining shows histology of an adjacent section of quiescin Q6 in situ hybridization. 2M(+/+), 2M(−/−), and 5M(−/−) represent 2 month old wildtype, 2 month old Nkx3.1-deficient, and 5 month old Nkx3.1-deficient prostates, respectively.
Figure 3. Clusterin is highly expressed in hyperplasic and PIN lesions of Nkx3.1−/− mice.
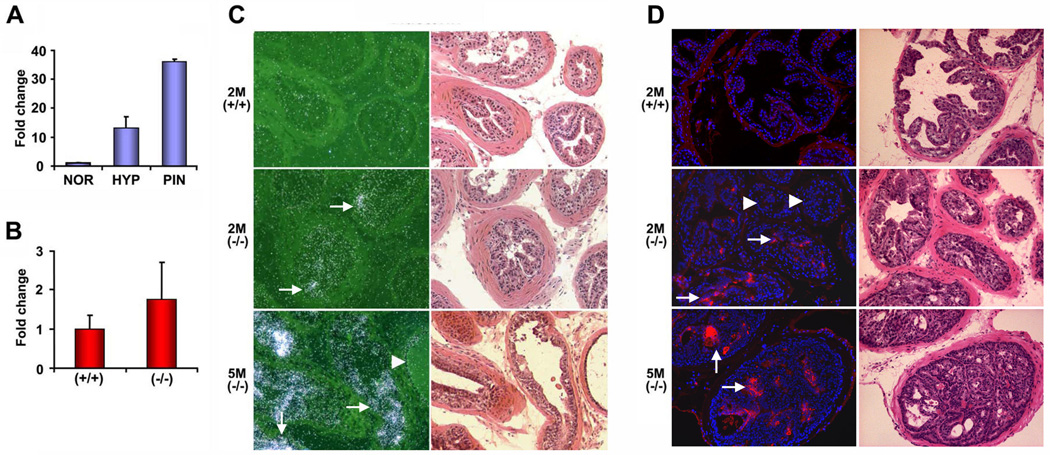
(A) qRT-PCR analysis of clusterin expression using RNA samples obtained by LCM from NOR (normal glands from 2 month old Nkx3.1+/+ mice), HYP (hyperplastic lesions from 2 month old Nkx3.1−/− mice), and PIN (prostatic intraepithelial neoplasia from 5 month old Nkx3.1−/− mice). (B) Clusterin expression by qRT-PCR using total prostate RNA from 2 month old wildtype and Nkx3.1−/− mice. (C) In situ hybridization with 35S-labeled antisense probe for clusterin. (D) Immunofluorescent staining using anti-clusterin antibodies. Images of clusterin (red) were merged with those of DAPI to highlight the nuclei (blue). Note the increase in clusterin mRNA and protein during the early progression of prostate tumorigenesis in Nkx3.1 deficient mice. Arrows in the middle and bottom panels of (C) and (D) indicate representative hyperplastic cells and PIN where clusterin is highly induced, respectively. The arrowheads indicate adjacent normal glands that do not express clusterin. The right panels in (C) and (D) show H&E staining and the adjacent sections display clusterin in situ hybridization and immunofluorescent staining, respectively. 2M(+/+), 2M(−/−), and 5M(−/−) represent 2-month-old wildtype, 2-month-old Nkx3.1-deficient, and 5-month-old Nkx3.1-deficient prostates.
Aberrant regulation of loss-of-Nkx3.1 signature genes during prostate regeneration
We previously demonstrated that proper regeneration of the prostate depends on Nkx3.1 expression, as it regulates the rate at which proliferating luminal epithelial cells exit the cell cycle (Magee et al., 2003). The deletion of one or two Nkx3.1 alleles results in an extended transient proliferative phase that culminates in dramatic luminal hyperplasia, and we hypothesized that genes involved in prostate regeneration may exhibit similar functions during prostate cancer initiation. We examined the same loss-of-Nkx3.1 genetic signatures identified in our Nkx3.1 tumor initiation model during prostate regeneration in a castration-testosterone replacement (TR) paradigm. Gene expression profiles from the two paradigms were compared and we identified responsive probe sets for 27 of the 45 loss-of-Nkx3.1 signature genes across the array platforms used in the two experiments. The relative expression of the loss-of-Nkx3.1 signature genes in the castration and hormone replacement model are shown in Figure 4A. A number of genes were expressed at much higher levels after testosterone treatment in Nkx3.1-deficient mice compared to wildtype mice. Thirteen other genes from the signature that could not be evaluated by cross-platform analysis were evaluated independently in the castration model by qRT-PCR. The results for eight of these genes are displayed in Figure 4B; the other five genes were not expressed in prostates of wildtype or Nkx3.1-deficient mice during prostate regeneration. The secreted and transmembrane 1 gene (SECTM1) was highly expressed in Nkx3.1-deficient mice treated with testosterone, whereas no change in expression was detected in testosterone-treated wildtype mice (Figure 4B, C). This comparison independently validates the functional roles of several loss-of-Nkx3.1 signature genes in both hormonally mediated tissue regeneration and malignant progression of the prostate.
Figure 4. Analysis of PIN genetic signatures in castration-testosterone replacement paradigm.
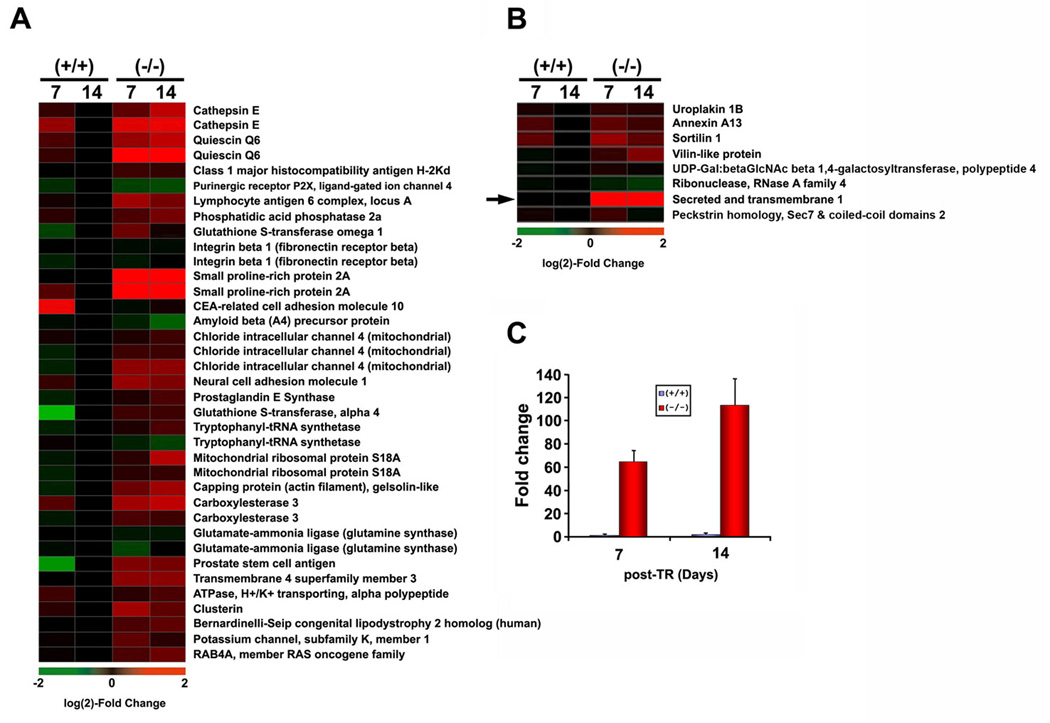
Fifty non-EST probes (45 genes) in Figure 1 were aligned with their counterparts on the MU74v2 microarrays utilized for castration-TR experiments in Nkx3.1-deficient mice. The day 7 and 14 post-TR time points were selected to perform this analysis. (A) Heat maps representing expression of loss-of-Nkx3.1 signature genes after testosterone replacement (day 7, 14). Heat map colors reflect log(2) fold-change values relative to expression in wildtype (day 14). (B) Expression of loss-of-Nkx3.1 signature genes that were not present on the MU74v2 platform using qRT-PCR visualized as heat map (n=5 samples at each time point). (C) qRT-PCR analysis for expression of secreted and transmembrane 1 (SECTM1, the arrow in B) in wildtype vs. Nkx3.1-deficient prostate after TR for 7 or 14 days.
NKX3.1 directly represses expression of quiescin Q6
Previous reports suggested that Nkx3.1 functions primarily as a transcriptional repressor (Steadman et al., 2000; Simmons & Horowitz, 2006). To address this issue, we examined the relationship between Nkx3.1 levels and the expression of quiescin Q6, one of the loss-of-Nkx3.1 signature genes in multiple prostate cancer cell lines. Consistent with its repressive role, qRT-PCR analysis showed an inverse correlation between endogenous NKX3.1 and quiescin Q6 mRNA expression (Figure 5A).
Figure 5. NKX3.1 represses transcription of quiescin Q6.
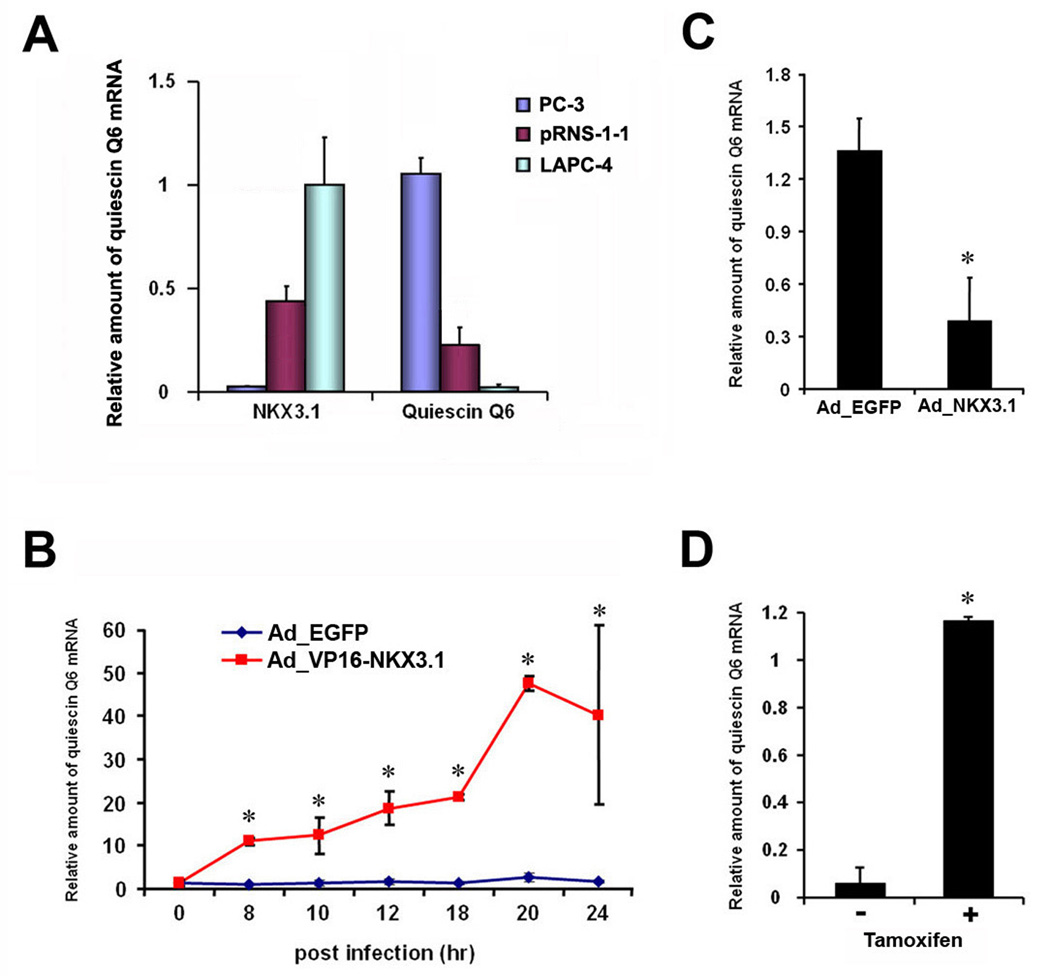
(A) Inverse correlation of NKX3.1 mRNA levels with quiescin Q6 mRNA levels in indicated prostate cancer cell lines. (B) Induction of quiescin Q6 mRNA expression in LAPC4 cells after infection with adenovirus expressing VP16-NKX3.1 (AdVP16-NKX3.1). * p < 0.001, student t-test. Note that quiescin Q6 mRNA level did not change after infection with adenovirus expressing EGFP (AdEGFP). (C) Downregulation of endogenous quiescin Q6 mRNA expression in LAPC4 cells infected with Adenovirus expressing NKX3.1 (AdNKX3.1) compared to the control, AdEGFP infected cells (18 hr after infection). * p < 0.05, student t-test. (D) Relative amounts of quiescin Q6 mRNA in LAPC4 cells infected with VP16-NKX3.1-ER lentivirus 6 hr after treatment of tamoxifen in the presence of cycloheximide, * p < 0.001, student t-test. (A–D) Relative mRNA levels of quiescin Q6 and NKX3.1 were measured by qRT-PCR.
Further functional validation of genes apparently regulated by transcriptional repressors such as NKX3.1 is often difficult, but can be facilitated by manipulating the repressor to make it an activator. Accordingly, we fused the strong VP16 activation domain onto NKX3.1 to generate a VP16-NKX3.1 fusion protein and used it to analyze candidate NKX3.1 target genes. Adenoviruses expressing this VP16-NKX3.1 protein, wildtype NKX3.1, or EGFP control were produced and used to infect LAPC4 prostate carcinoma cells, an androgen-responsive prostate cancer cell line expressing wild-type AR and NKX3.1. Transduced proteins, including the VP16-NKX3.1 protein, were detectable by Western blotting within 8 hr of infection and reached maximal levels by 12 hr (data not shown).
To specifically examine loss-of-Nkx3.1 signature genes, we first tested whether quiescin Q6 was directly regulated by NKX3.1. We found that LAPC4 cells infected with VP16-NKX3.1 activator protein had much higher levels of quiescin Q6 mRNA 8 hr post-infection (Figure 5B). Consistently, we also observed that cells infected with wild-type NKX3.1 repressor had ∼3-fold less quiescin Q6 mRNA levels (Figure 5C). To determine whether the activation of quiescin Q6 by VP16-NKX3.1 was a direct effect, we also generated a lentivirus expressing a regulable VP16-NKX3.1-ER fusion protein, whose activity is regulated by tamoxifen. Cells expressing this regulator were treated with tamoxifen as well as cycloheximide to block new protein synthesis and thus decrease the possibility that quiescin Q6 was activated indirectly by a transcription factor modulated by NKX3.1. We found that quiescin Q6 was activated by VP16-NKX3.1-ER under these conditions, suggesting that is likely to be directly regulated by NKX3.1 (Figure 5D). Collectively, these results indicate that NKX3.1 regulates quiescin Q6, a loss-of-Nkx3.1 signature gene.
Loss-of-Nkx3.1 signature genes are similarly regulated in Pten−/− and Nkx3.1−/− prostate cancer models
Nkx3.1 is also downregulated at an early stage of prostate tumorigenesis in conditional Pten loss-of-function models (Wang et al., 2003) but at later stages of tumor development in c-myc overexpression transgenic mice (Ellwood-Yen et al., 2003). To gain additional insight into the role of loss-of-Nkx3.1 signature genes relative to the progression of prostate cancer through alternative developmental pathways, we examined their expression profiles in these other prostate cancer models.
In previously described models using conditional Pten alleles that are excised by mating with a modified rat probasin promoter-driven Cre mice, Pten loss occurred at 2 wk of age, prior to normal Nkx3.1 expression (Wu et al., 2001). Therefore, to better mimic human disease and delay Pten loss, until after Nkx3.1 expression in adulthood, we crossed Ptenloxp/loxp mice to PSA-Cre mice (Abdulkadir et al., 2002). PSA-Cre mice exhibit the highest expression (and corresponding target gene deletion) in the ventral lobe, and lower gene deletion rates in the dorsolateral and anterior lobes. This results in Pten loss within epithelial cells beginning at ∼6 weeks-of-age (data not shown). We histologically examined 2-, 4-, and 6-month old Ptenloxp/loxp:PSA-Cre+ mice and found that the timing and progression of prostate adenocarcinoma corresponded to previously characterized temporal and spatial Cre activity pattern (data not shown).
Using this modified loss-of-Pten model, we performed in situ hybridization of loss-of-Nkx3.1 signature genes, Nkx3.1 immunostaining, and histology on consecutive sections of Ptenloxp/loxp:PSA-Cre+ prostates. Like the Nkx3.1−/− model, we found that Sprr2a, clusterin, and quiescin Q6 were highly overexpressed in high grade PIN regions of ventral and dorsolateral prostate, but not in unaffected glands (Figure 6, Supplemental Figure S3). Their expression in high grade PIN lesions was directly correlated with the absence of Nkx3.1 observed by immunostaining (arrowheads in Figure 6A, B). Furthermore, additional immunofluorescence analysis showed that increased levels of phosphorylated Akt (a consequence of Pten loss) occur only in glands that also lost Nkx3.1 and expressed high levels of clusterin (arrowheads in Figure 6C). These experiments demonstrate that the loss of Nkx3.1 expression associated with Pten loss results in a molecular dysregulation of loss-of-Nkx3.1 signature genes that is similar to that observed in Nkx3.1-deficient mice.
Figure 6. Clusterin and Sprr2a are highly expressed in high grade PIN lesions in Pten-deficient mice.
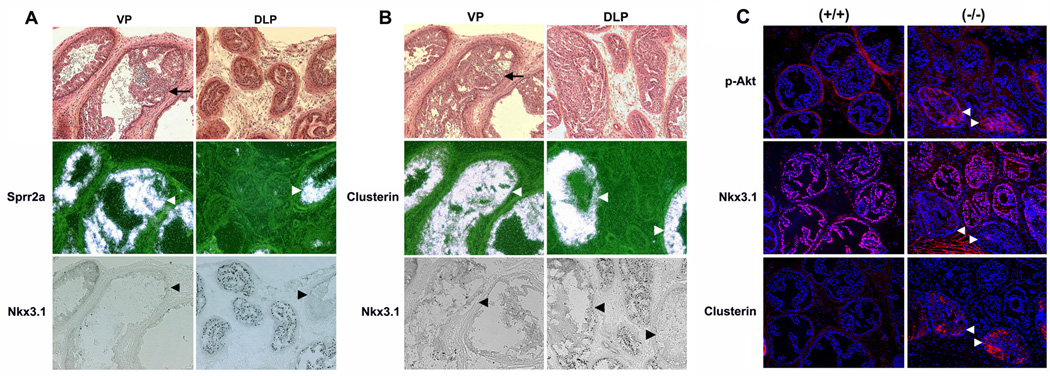
(A) Sprr2a in situ hybridization and Nkx3.1 immunostaining in ventral (VP) and dorsolateral prostates (DLP) of 4 month old prostate-specific Pten-deficient mice. (B) Clusterin in situ hybridization and Nkx3.1 immunostaining in VP and DLP of 4 month old Pten-deficient mice. In situ hybridization (Sprr2a or clusterin) and Nkx3.1 immunostaining was performed on adjacent sections. Note the exclusively inverse correlation of overexpression of Sprr2a and clusterin (white arrowheads) with loss of Nkx3.1 (black arrowheads) in high grade PIN lesions both in VP and DLP of Pten deficient prostates. Top panel in each composite represents bright fields of an adjacent section to Nkx3.1 immunostaining, and Sprr2a (A) or clusterin (B) in situ hybridization, and black arrows in this panel indicate examples of high grade PIN. Black dots in Nkx3.1 immunostaining represent immunoreactive Nkx3.1 proteins. (C) Immunofluorescent staining (red) for p-Akt, Nkx3.1, and clusterin on adjacent sections of DLP from 6-month-old Pten-deficient mice. Nuclei (blue) were visualized by DAPI staining. Note that loss-of-Nkx3.1 occurs in only a few glands (white arrowheads) and correlates with clusterin overexpression. These glands also have increased p-Akt, a consequence of Pten loss.
Loss-of-Nkx3.1 signature genes are not dysregulated in the c-myc prostate cancer model
In probasin-c-myc transgenic mice, Nkx3.1 expression is present in PIN lesions but is lost in later stages of invasive carcinoma (Ellwood-Yen et al., 2003). To determine whether molecular regulation of loss-of-Nkx3.1 signature genes was altered in this model, we performed in situ hybridization and Nkx3.1 immunostaining. We found that, in contrast to the Pten-deficient model, none of the analyzed loss-of-Nkx3.1 signature genes – quiescin Q6, clusterin, Sprr2a, or cathepsin E - were overexpressed at any stage of prostate tumorigenesis in the c-myc model, even after the loss of Nkx3.1 expression itself (Figure 7A). As previously reported for these mice, Nkx3.1 was normally detected in PIN lesions and absent in invasive cancer. We also detected some lesions where Nkx3.1-positive and Nkx3.1-negative carcinoma cells were both present (Figure 7B). However, even in cells no longer expressing Nkx3.1, no overexpression of quiescin Q6 was detected (Boxed area in Figure 7A corresponding to the top panel in Figure 7B). These data indicate that loss of Nkx3.1 expression during prostate tumorigenesis in the c-myc overexpression model is associated with a distinct transcriptional profile from that observed in Pten-deficient mice and Nkx3.1-deficient mice, and suggests that the timing of Nkx3.1 loss may have important ramifications for the regulation of its target genes and future tumor behavior.
Figure 7. Expression of loss-of-Nkx3.1 signature genes is not increased in high grade PIN/invasive carcinoma lesions of c-myc transgenic mice.
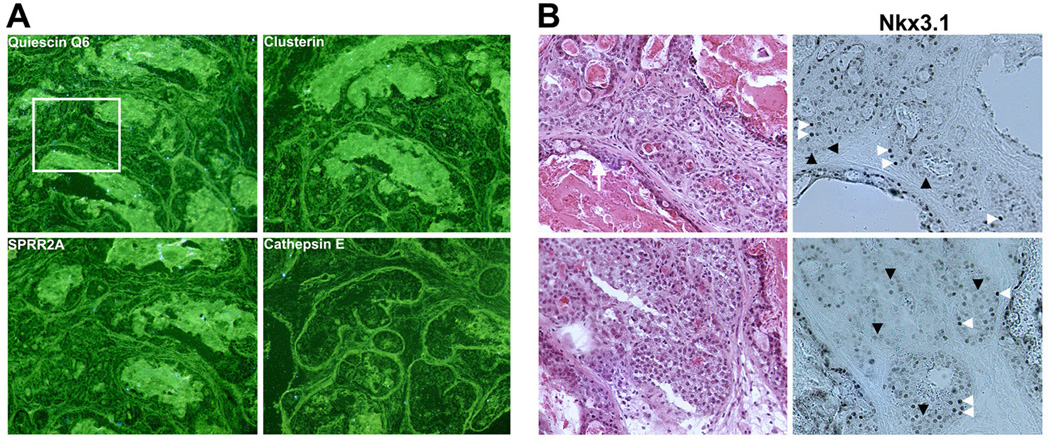
(A) In situ hybridization of quiescin Q6, clusterin, Sprr2a, and cathepsin E. All four representative loss-of-Nkx3.1 signature genes were not overexpressed in high grade PIN/invasive carcinoma in 4 month old c-myc transgenic mice. (B) Nkx3.1 immunostaining showed that Nkx3.1-positive cells (white arrowheads) are heterogeneously mixed with Nkx3.1-negative cells (black arrowheads) in invasive carcinoma lesions in this mouse model. Left panel: H&E staining performed on sections adjacent to those used for in situ hybridization. Right panel: Nkx3.1 immunostaining. Note that there is no quiescin Q6 expression even in Nkx3.1-negative cells in the top panel in (B) corresponding to the boxed area of quiescin Q6 in situ hybridization (A).
Association of loss-of-Nkx3.1 transcriptional regulation with Pten-Akt signaling during prostate tumorigenesis
While Nkx3.1 expression is downregulated in multiple mouse models of prostate tumorigenesis, loss-of-Nkx3.1 signature genes clearly behave differently in these models. We therefore hypothesized that the Nkx3.1 transcriptional regulator is a potential converging point for prostate tumor initiation that leads to activation of multiple signaling pathways in a spatiotemporal dependent context. To test this hypothesis, we performed an unbiased meta-analysis, simultaneously using gene expression profiles from the same mouse prostate cancer models used to analyze the loss-of-Nkx3.1 signature. This analysis included Nkx3.1-deficient mice, the two mouse models described above, and transgenic mice that develop PIN lesions due to prostate expression of constitutively active Akt (caAkt) (Majumder et al., 2003).
After identifying a common set of transcripts represented on each array platform across all data sets, defining statistically significant differences between expression of those transcripts in normal and malignant cells within each data set, and representing differences as either up- or down-regulated, we identified a total of 257 genes that were differentially expressed in at least two of the four prostate cancer models (Figure 8A and Supplemental Table S2). Pten loss leads to activation of Akt, and, as expected, the Pten-deficient and caAkt tumor expression profiles share dysregulation of 39 transcripts. Interestingly, the tumor expression profile of Nkx3.1-deficient mice was also similar to those of Pten-deficient mice (45 common transcripts) and caAkt transgenic mice (51 common transcripts) (Figure 8B). In contrast and consistent with the in situ hybridization data above, the c-myc transgenic prostate expression profile was clearly different from the Nkx3.1-deficient pattern (only 17 common transcripts). Furthermore, the majority of genes with similar prostate expression patterns among Nkx3.1-deficient vs. caAkt transgenic mice or Nkx3.1-deficient vs. Pten-deficient mice are upregulated, whereas most genes in common between Nkx3.1-deficient and c-myc transgenic mice are downregulated (Figure 8C). As Nkx3.1 is primarily a transcriptional repressor, it is likely that its loss would lead to upregulation of important tumor initiation genes, thus the upregulation of many common genes in Pten-deficient, caAkt and Nkx3.1-deficient mice suggests that the Pten-Akt-Nkx3.1 axis serves as a major molecular path of prostate tumorigenesis. Nonetheless, there was overlap between the c-myc and Pten-deficient profiles, suggesting that even though early events like loss of Nkx3.1 is different in these models, they retain some core similarity in their activated transcriptional networks.
Figure 8. Meta-analysis of expression profiling in multiple prostate cancer mouse models.
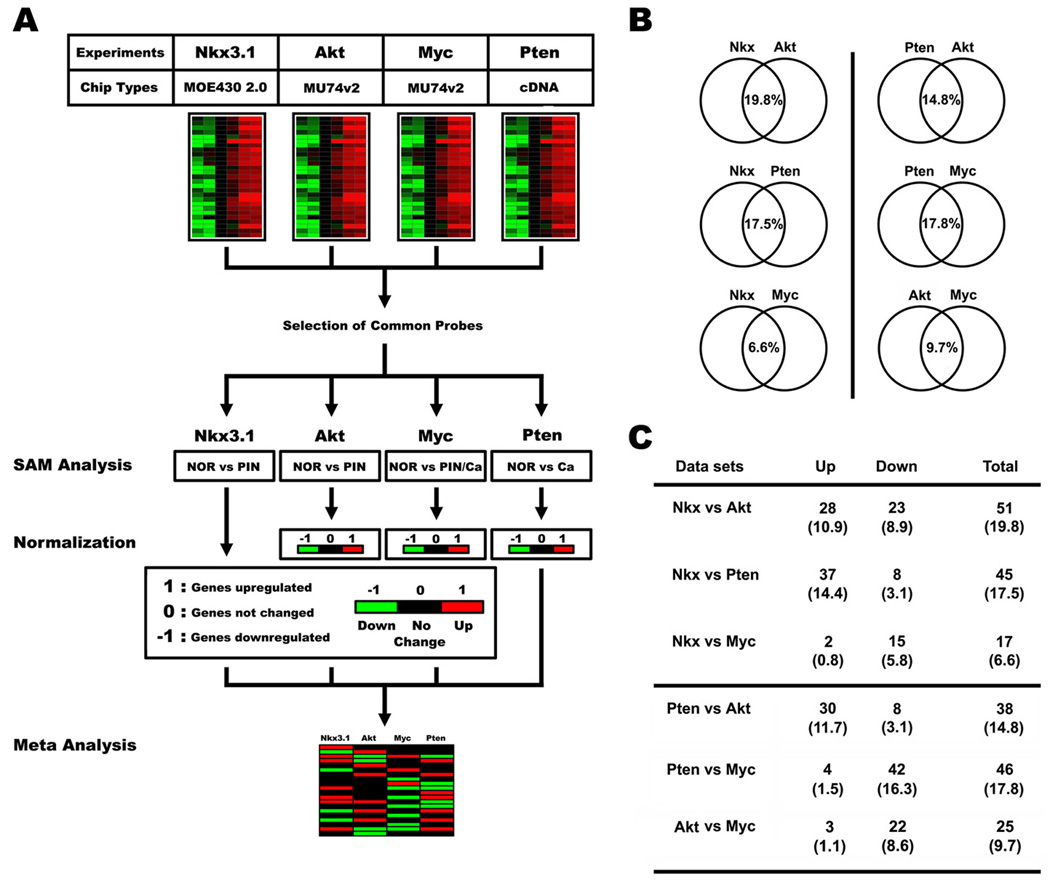
(A) A schematic diagram of meta-analysis performed with 4 different expression profiling datasets. (B) A schematic diagram depicting results from the meta-analysis. Each normalized dataset was compared with the others to present similarity of gene expression patterns between two mouse models. Note that the Nkx3.1 dataset showed similarity with caAkt and Pten-deficient models, compared with slight overlap with the c-myc transgenic model. (C) Detailed outcome of meta-analysis described in (B). Similarly expressed genes between two mouse models were divided into upregulated (Up) or downregulated (Down). The Nkx3.1, caAkt, and Pten-deficient lesions primarily had many upregulated genes in common, but few downregulated ones. The common differentially regulated genes in the c-myc transgenic vs. Pten-deficient models were predominantly downregulated genes.
Clusterin overexpression is correlated with early loss-of-NKX3.1 in atrophic glands of human prostates
To examine whether loss-of-Nkx3.1 signature genes are also aberrantly regulated during human prostate cancer progression, coincident with NKX3.1 loss, we investigated the expression of the loss-of-Nkx3.1 signature gene, clusterin. Clusterin was selected among these genes because it is an anti-apoptotic glycoprotein that is overexpressed in hormone refractory prostate cancer, associated with cancer therapy resistance and is the target of prostate cancer therapy (Gleave & Miyake, 2005). We performed in situ hybridization using prostate samples that contained benign prostatic glands, atrophic glands, PIN, and carcinoma, and found that clusterin was significantly overexpressed in atrophic glands (Arrows, Figure 9A). NKX3.1 immunostaining on adjacent sections revealed that NKX3.1 was also specifically lost in glands with inflammatory atrophy (Figure 9B, C). Interestingly, clusterin overexpression was not observed in areas of PIN and invasive carcinoma regardless of NKX3.1 status (data not shown), a finding consistent with qRT-PCR results demonstrating that its expression is not increased in human primary prostate tumors (Supplemental Figure S4). PIA may be a prostate cancer precursor lesion in humans (Bethel et al., 2006; De Marzo et al., 1999; Nelson et al., 2001; van Leenders et al., 2003), thus the loss of NKX3.1 expression in inflammatory atrophic glands could be an important initiating event. Furthermore, the correlation of clusterin overexpression with NKX3.1 loss in PIA, but not in invasive carcinoma, again highlights the concept that the molecular consequences of early NKX3.1 loss are different from those associated with later stages of prostate tumorigenesis.
Figure 9. High clusterin expression in atrophic luminal cells in human prostates is associated with NKX3.1 loss.
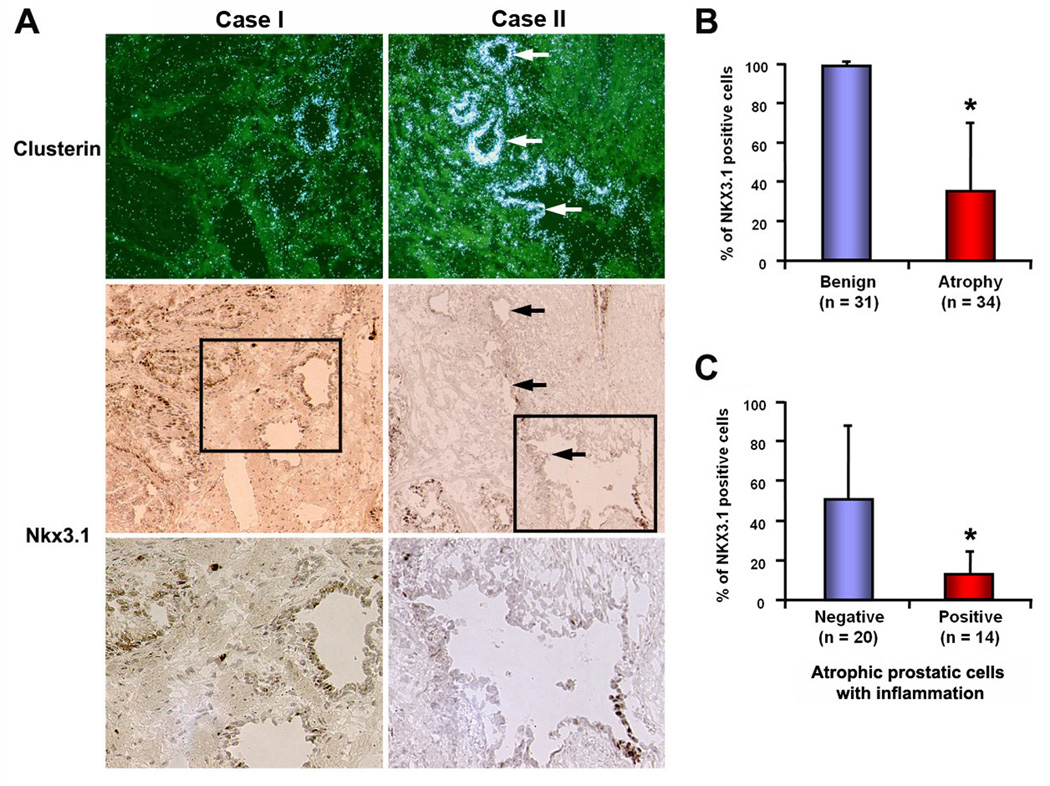
(A) Representative images of clusterin overexpression and loss of NKX3.1 in human prostate tissue. Upper panel displays images of clusterin in situ hybridization. Middle panel represents immunostaining of NKX3.1 in sections adjacent to that used for in situ hybridization. Bottom panel shows higher magnification images of the boxed fields in middle panel, with decreased number of Nkx3.1-positive cells in atrophy. Note the inverse correlation of clusterin expression with NKX3.1 loss only in atrophic glands, especially inflammatory atrophy. Arrows indicate atrophic glands. (B) and (C) Quantitative analysis of NKX3.1 immunostaining in benign and atrophic glands of human prostates. Glands were randomly selected and 100 cells were counted and scored for NKX3.1 immunoreactivity. Atrophic glands (n = 34) in (B) were divided into inflammation negative vs. positive, and the correlation of loss-of-NKX3.1 with inflammatory atrophy was evaluated in (C). Note that NKX3.1 loss is significantly higher in inflamed atrophy compared to non-inflamed atrophy. Vertical axis indicates percentage of NKX3.1-positive cells (*; p<0.01, Mann-Whitney test).
DISCUSSION
Mouse models that share characteristics of human prostate tumorigenesis have proven useful in studying the underlying molecular mechanisms of the disease (Abdulkadir et al., 2002; Wang et al., 2003; Ellwood-Yen et al., 2003; Bhatia-Gaur et al., 1999; Di Cristofano et al., 2001; Chen et al., 2005; Greenberg et al., 1995; Garabedian et al., 1998; Gao et al., 2004). However, it is unclear whether common pathways govern prostate cancer progression in these models. In the present investigation, we examined the regulation of gene expression by Nkx3.1, a proposed “gatekeeper” of prostate cancer initiation, by analyzing expression profiles of prostatic epithelia in different phases of prostate cancer development in Nkx3.1-deficient mice and multiple mouse models of prostate cancer. These analyses provided evidence that loss of Nkx3.1 leads to aberrant regulation of a cluster of genes we designate the loss-of-Nkx3.1 genetic signature. Using a variety of approaches, we have demonstrated that abnormalities in the expression of many of these genes, such as quiescin Q6 and clusterin, are also present in prostate tumor models generated by loss of Pten or constitutive activity of Akt. In these models, the altered expression of these genes is dependent upon Nkx3.1 loss, an early event in prostate tumorigenesis resulting from Pten loss. However, the consequences of Nkx3.1 loss on the molecular phenotype of the resulting epithelial proliferative lesions are dependent on when Nkx3.1 expression is lost, as expression of loss-of-Nkx3.1 signature genes is not altered in the c-myc model where Nkx3.1 is lost at a later stage of tumor development. These data suggest that the timing of Nkx3.1 loss is likely to be a crucial determinant in the activation of downstream signaling pathways that affect prostate tumorigenesis.
Quiescin Q6 is a downstream target of Nkx3.1, whose expression is dependent on Nkx3.1 gene dosage and associated with aberrantly extended proliferation in Nkx3.1+/− and Nkx3.1−/− prostates during testosterone replacement after castration (Magee et al., 2003). In this paper, we further demonstrate that quiescin Q6 expression is also dysregulated in models of prostate cancer caused by aberrant Pten/Akt signaling, where Nkx3.1 expression is also reduced at an early stage of tumor progression. Interestingly, quiescin Q6 expression is very high in early lesions, like PIN, suggesting that this provides a selective advantage to cells in these early prostate cancer precursor lesions. Quiescin Q6 is a sulfhydryl oxidase that generates hydrogen peroxide as a by-product of the oxidation of sulfhydryl groups in the course of generating disulfide-containing secreted proteins (Thorpe et al., 2002). Its cellular activities as a pro-oxidant result in increased accumulation of reactive oxygen species (ROS). It was recently reported that anti-oxidant and pro-oxidant enzymes including quiescin Q6 are aberrantly expressed in PIN lesions of aged Nkx3.1−/− mice (Ouyang et al., 2005). Our in vitro experiments demonstrated that quiescin Q6 is a direct target of the transcriptional repressor NKX3.1, suggesting that the increased levels of this pro-oxidant enzyme after loss-of-Nkx3.1 could mediate prostate tumor initiation through increased ROS accumulation and subsequent oxidative damage, a tumorigenic influence in many cancers (Bostwick et al., 2000; Oberley, 2002). The high expression of the pro-oxidant quiescin Q6, may explain the beneficial effects of antioxidants such as vitamin E and selenium in reducing prostate cancer risk in humans (Chan et al., 2005), and suggests that inhibitors of quiescin Q6 could be useful in reducing the risk of prostate cancer.
We also identified clusterin as a loss-of-Nkx3.1 signature gene associated with early prostate cancer progression. Clusterin, also known as apolipoprotein J or testosterone-repressed prostate message 2, is a highly conserved glycoprotein that has diverse functions associated with carcinogenesis (Shannan et al., 2006). While its exact role in tumorigenesis is unclear, clusterin has been recently highlighted as a therapeutic target for hormone-refractory prostate cancer (Gleave & Miyake, 2005). The moderate penetration rate of PSA-Cre expression in the dorosolateral prostate of the mouse model used in this study allowed us to directly correlate clusterin overexpression with Nkx3.1 loss at the cellular level during the initial stages of prostate tumorigenesis and suggested again that the level of Nkx3.1 is an important factor in preventing tumor initiation. The early forced restoration of Nkx3.1 expression in Pten-deficient prostate explants leads to decreased cell proliferation, increased cell death, and ultimately prevents tumor initiation (Lei et al., 2006), providing further support for the idea that Nkx3.1 is a critical tumor suppressor for prostate cancer tumor initiation. It will be interesting to determine whether re-introduction of Nkx3.1 into Pten-deficient prostate cells at later stages, such as invasive carcinoma, will also inhibit tumor progression, as the timing of Nkx3.1 loss appears to be a crucial factor in determining subsequent molecular abnormalities.
The loss-of-Nkx3.1 genetic signature identified using Nkx3.1-deficient prostate tissue, although largely recapitulated in prostates from Pten-deficient mice, is not present in the c-myc transgenic mouse model. In this latter model, Nkx3.1 loss in the prostate lesions occurs at a much later stage, suggesting that this temporal disparity leads to differential regulation of downstream signaling pathways. For example, the aberrant expression of genes associated with regulation of oxygen stress in PIN lesions of Nkx3.1-deficient mice does not occur in c-myc transgenic mice (Ouyang et al., 2005). The expression of the Ly6 gene family, which are upregulated in a variety of cancers including prostate cancer (Xin et al., 2005; Eshel et al., 2002) is illustrative in this regard. Members of this gene family exhibit distinct expression profiles in lesions arising in the c-myc vs. Pten, Akt, or Nkx3.1 prostate cancer mouse models. Ly6c and Ly6d are distinctly upregulated in c-myc transgenic prostates, whereas Psca, Ly6a (Sca-1), and/or Ly6e are consistently overexpressed in lesions resulting from abnormalities in the Pten-Akt-Nkx3.1 axis. In addition to upregulated genes, several genes that are downregulated in Nkx3.1-deficient prostate, like probasin and intelectin, are also present at reduced levels in lesions from Pten-deficient and/or caAkt transgenic mice. The restoration of Nkx3.1 in Pten-deficient and c-myc transgenic prostate cells or the early overexpression of c-myc in the context of Nkx3.1 deficiency may shed light on the differences and interactions of these pathways and how they influence the dynamics of prostate tumorigenesis.
Finally, recent work on the EphB signaling pathway in colon cancer suggests that alterations required for tumor initiation may impose restrictions on future tumor progression at later stages of tumorigenesis (Batlle et al., 2005). This implies that an orchestrated, carefully controlled spatiotemporal expression pattern of oncogenes and tumor suppressors significantly impacts tumor progression and the ultimate outcome. In this study, the altered timing of Nkx3.1 loss in different prostate cancer models clearly impacts the changes in gene expression in the resulting prostate cancer lesions. The loss-of-Nkx3.1 genetic signature may be useful in differentiating the molecular consequences of early vs. late Nkx3.1 expression loss and subsequent tumor behavior.
MATERIALS AND METHODS
LCM, RNA amplification, and data analysis
RNA samples from normal prostate epithelia (NOR), hyperplasia (HYP), or prostatic intraepithelial neoplasia (PIN) cells were obtained by LCM using the PixCell II LCM system (Arcturus, Mountain View, CA). NOR, HYP, and PIN cells were collected from 2-month-old wildtype, 2-month-old Nkx3.1-deficient, and 5-month-old Nkx3.1-deficient prostates, respectively (n=4 or 6 per each group). Detailed procedures of LCM were performed as described previously (Ehrig et al., 2001). Every 5th section was stained and examined by a pathologist (P.A.H.) to identify hyperplastic and PIN cells from Nkx3.1-deficient prostate. LCM was performed on adjacent sections that contained the areas demarcated by the pathologist. Several LCM caps were pooled into a single tube containing 200 µl of denaturing buffer- guanidium isothiocyanate (GITC) with β-mercaptoethanol. Total RNA was extracted using a modified protocol of the Stratagene RNA microisolation kit (Stratagene, La Jolla, CA), and analyzed using an Agilent Bioanalyzer (Agilent, Wilmington, DE) to assess its quality and concentration prior to labeled target production for microarray analysis. Two to three independently pooled RNA samples were amplified to produce biotinylated hybridization targets as previously described (Luzzi et al., 2003). Fragmented, amplified cRNAs were hybridized to the Affymetrix Mouse Genome 430 2.0 GeneChip microarrays (MOE 430 2.0). The initial data acquisition and normalization of microarray gene expression data was performed with the Affymetrix Microarray Suite 5.0 software. Target preparation, hybridization, and data generation was performed by the Siteman Cancer Center Multiplexed Gene Analysis Core Facility, following standardized manufacturer protocols for two-round target amplification, labeling, fragmentation, and hybridization.
Immunohistochemistry/immunofluorescent staining and in situ hybridization
Prostates were collected and snap-frozen for histological analyses. Human prostate sections were provided from the Siteman Cancer Center Tissue Procurement Core at Washington University. Sections were fixed in cold 4% paraformaldehyde for 10 min and processed for immunohistochemistry/immunofluorescent staining using rabbit polyclonal anti-NKX3.1 (1:500) antibody, anti-Clusterin (1:50) antibody (Signet, Emeryville, CA) and anti-pAKT (1:50) antibody (Cell signaling, Danvers, MA). The rabbit polyclonal NKX3.1 antibody has been previously described (Abdulkadir et al., 2002). After immunohistochemistry and immunofluorescent staining, sections were stained with Hematoxylin and DAPI to visualize cells and nuclei. In situ hybridization was performed as previously described (Das et al., 1994; Song et al., 2002). Briefly, mouse or human frozen sections (10–12 µm) were mounted onto poly-L-lysine-coated slides, fixed in cold 4% paraformaldehyde solution in PBS, acetylated and hybridized at 45°C for 4 hr in hybridization buffer containing the 35S-labeled antisense cRNA probes. After hybridization, the sections were treated with RNase A (20 µg/ml) at 37°C for 20 min and RNase A-resistant hybrids were detected by autoradiography. Sections hybridized with the sense probes served as negative controls.
Supplementary Material
Information concerning the methods for other experiments is provided as supplemental materials and methods.
Acknowledgements
We are deeply indebted to Rakesh Nagarajan for help with bioinformatic analysis and Robert Heuckeroth for careful review of the manuscript and helpful discussions of the data. We thank Amy Strickland, Tatiana Gorodinsky and Nina Panchenko for technical assistance. We are grateful to Hong Wu and Charles Sawyers (UCLA) for Pten conditional and c-myc transgenic mice, respectively. This work was supported by NIH grants CA111966 (to J.M.) and Washington University Cancer Biology Pathway Fellowship (to B.Z.). H.S. was supported by a postdoctoral fellowship from the Department of Defense (PC030380).
Reference
- Abate-Shen C, Shen MM. Genes Dev. 2000;14:2410–2434. doi: 10.1101/gad.819500. [DOI] [PubMed] [Google Scholar]
- Abdulkadir SA, Magee JA, Peters TJ, Kaleem Z, Naughton CK, Humphrey PA, Milbrandt J. Mol Cell Biol. 2002;22:1495–1503. doi: 10.1128/mcb.22.5.1495-1503.2002. [DOI] [PMC free article] [PubMed] [Google Scholar]
- Asatiani E, Huang WX, Wang A, Rodriguez Ortner E, Cavalli LR, Haddad BR, Gelmann EP. Cancer Res. 2005;65:1164–1173. doi: 10.1158/0008-5472.CAN-04-2688. [DOI] [PubMed] [Google Scholar]
- Ashida S, Nakagawa H, Katagiri T, Furihata M, Iiizumi M, Anazawa Y, Tsunoda T, Takata R, Kasahara K, Miki T, Fujioka T, Shuin T, Nakamura Y. Cancer Res. 2004;64:5963–5972. doi: 10.1158/0008-5472.CAN-04-0020. [DOI] [PubMed] [Google Scholar]
- Batlle E, Bacani J, Begthel H, Jonkheer S, Gregorieff A, van de Born M, Malats N, Sancho E, Boon E, Pawson T, Gallinger S, Pals S, Clevers H. Nature. 2005;435:1126–1130. doi: 10.1038/nature03626. [DOI] [PubMed] [Google Scholar]
- Bethel CR, Bieberich CJ. Prostate. 2007;67:1740–1750. doi: 10.1002/pros.20579. [DOI] [PubMed] [Google Scholar]
- Bethel CR, Faith D, Li X, Guan B, Hicks JL, Lan F, Jenkins RB, Bieberich CJ, De Marzo AM. Cancer Res. 2006;66:10683–10690. doi: 10.1158/0008-5472.CAN-06-0963. [DOI] [PubMed] [Google Scholar]
- Bhatia-Gaur R, Donjacour AA, Sciavolino PJ, Kim M, Desai N, Young P, Norton CR, Gridley T, Cardiff RD, Cunha GR, Abate-Shen C, Shen MM. Genes Dev. 1999;13:966–977. doi: 10.1101/gad.13.8.966. [DOI] [PMC free article] [PubMed] [Google Scholar]
- Bostwick DG, Alexander EE, Singh R, Shan A, Qian J, Santella RM, Oberley LW, Yan T, Zhong W, Jiang X, Oberley TD. Cancer. 2000;89:123–134. [PubMed] [Google Scholar]
- Bova GS, Carter BS, Bussemakers MJ, Emi M, Fujiwara Y, Kyprianou N, Jacobs SC, Robinson JC, Epstein JI, Walsh PC, et al. Cancer Res. 1993;53:3869–3873. [PubMed] [Google Scholar]
- Bowen C, Bubendorf L, Voeller HJ, Slack R, Willi N, Sauter G, Gasser TC, Koivisto P, Lack EE, Kononen J, Kallioniemi OP, Gelmann EP. Cancer Res. 2000;60:6111–6115. [PubMed] [Google Scholar]
- Chan JM, Gann PH, Giovannucci EL. J Clin Oncol. 2005;23:8152–8160. doi: 10.1200/JCO.2005.03.1492. [DOI] [PubMed] [Google Scholar]
- Chen Z, Trotman LC, Shaffer D, Lin HK, Dotan ZA, Niki M, Koutcher JA, Scher HI, Ludwig T, Gerald W, Cordon-Cardo C, Pandolfi PP. Nature. 2005;436:725–730. doi: 10.1038/nature03918. [DOI] [PMC free article] [PubMed] [Google Scholar]
- Das SK, Wang XN, Paria BC, Damm D, Abraham JA, Klagsbrun M, Andrews GK, Dey SK. Development. 1994;120:1071–1083. doi: 10.1242/dev.120.5.1071. [DOI] [PubMed] [Google Scholar]
- De Marzo AM, Marchi VL, Epstein JI, Nelson WG. Am J Pathol. 1999;155:1985–1992. doi: 10.1016/S0002-9440(10)65517-4. [DOI] [PMC free article] [PubMed] [Google Scholar]
- Di Cristofano A, De Acetis M, Koff A, Cordon-Cardo C, Pandolfi PP. Nat Genet. 2001;27:222–224. doi: 10.1038/84879. [DOI] [PubMed] [Google Scholar]
- Ehrig T, Abdulkadir SA, Dintzis SM, Milbrandt J, Watson MA. J Mol Diagn. 2001;3:22–25. doi: 10.1016/S1525-1578(10)60645-9. [DOI] [PMC free article] [PubMed] [Google Scholar]
- Ellwood-Yen K, Graeber TG, Wongvipat J, Iruela-Arispe ML, Zhang J, Matusik R, Thomas GV, Sawyers CL. Cancer Cell. 2003;4:223–238. doi: 10.1016/s1535-6108(03)00197-1. [DOI] [PubMed] [Google Scholar]
- Eshel R, Neumark E, Sagi-Assif O, Witz IP. Semin Cancer Biol. 2002;12:139–147. doi: 10.1006/scbi.2001.0422. [DOI] [PubMed] [Google Scholar]
- Gao H, Ouyang X, Banach-Petrosky W, Borowsky AD, Lin Y, Kim M, Lee H, Shih WJ, Cardiff RD, Shen MM, Abate-Shen C. Proc Natl Acad Sci U S A. 2004;101:17204–17209. doi: 10.1073/pnas.0407693101. [DOI] [PMC free article] [PubMed] [Google Scholar]
- Garabedian EM, Humphrey PA, Gordon JI. Proc Natl Acad Sci U S A. 1998;95:15382–15387. doi: 10.1073/pnas.95.26.15382. [DOI] [PMC free article] [PubMed] [Google Scholar]
- Gleave M, Miyake H. World J Urol. 2005;23:38–46. doi: 10.1007/s00345-004-0474-0. [DOI] [PubMed] [Google Scholar]
- Greenberg NM, DeMayo F, Finegold MJ, Medina D, Tilley WD, Aspinall JO, Cunha GR, Donjacour AA, Matusik RJ, Rosen JM. Proc Natl Acad Sci U S A. 1995;92:3439–3443. doi: 10.1073/pnas.92.8.3439. [DOI] [PMC free article] [PubMed] [Google Scholar]
- He WW, Sciavolino PJ, Wing J, Augustus M, Hudson P, Meissner PS, Curtis RT, Shell BK, Bostwick DG, Tindall DJ, Gelmann EP, Abate-Shen C, Carter KC. Genomics. 1997;43:69–77. doi: 10.1006/geno.1997.4715. [DOI] [PubMed] [Google Scholar]
- Kim MJ, Bhatia-Gaur R, Banach-Petrosky WA, Desai N, Wang Y, Hayward SW, Cunha GR, Cardiff RD, Shen MM, Abate-Shen C. Cancer Res. 2002;62:2999–3004. [PubMed] [Google Scholar]
- Lei Q, Jiao J, Xin L, Chang CJ, Wang S, Gao J, Gleave ME, Witte ON, Liu X, Wu H. Cancer Cell. 2006;9:367–378. doi: 10.1016/j.ccr.2006.03.031. [DOI] [PubMed] [Google Scholar]
- Luzzi V, Mahadevappa M, Raja R, Warrington JA, Watson MA. J Mol Diagn. 2003;5:9–14. doi: 10.1016/S1525-1578(10)60445-X. [DOI] [PMC free article] [PubMed] [Google Scholar]
- Macoska JA, Trybus TM, Benson PD, Sakr WA, Grignon DJ, Wojno KD, Pietruk T, Powell IJ. Cancer Res. 1995;55:5390–5395. [PubMed] [Google Scholar]
- Magee JA, Abdulkadir SA, Milbrandt J. Cancer Cell. 2003;3:273–283. doi: 10.1016/s1535-6108(03)00047-3. [DOI] [PubMed] [Google Scholar]
- Majumder PK, Yeh JJ, George DJ, Febbo PG, Kum J, Xue Q, Bikoff R, Ma H, Kantoff PW, Golub TR, Loda M, Sellers WR. Proc Natl Acad Sci U S A. 2003;100:7841–7846. doi: 10.1073/pnas.1232229100. [DOI] [PMC free article] [PubMed] [Google Scholar]
- Markowski MC, Bowen C, Gelmann EP. Cancer Res. 2008;68:6896–6901. doi: 10.1158/0008-5472.CAN-08-0578. [DOI] [PMC free article] [PubMed] [Google Scholar]
- Nelson WG, De Marzo AM, Deweese TL, Lin X, Brooks JD, Putzi MJ, Nelson CP, Groopman JD, Kensler TW. Ann N Y Acad Sci. 2001;952:135–144. doi: 10.1111/j.1749-6632.2001.tb02734.x. [DOI] [PubMed] [Google Scholar]
- Nelson WG, De Marzo AM, Isaacs WB. N Engl J Med. 2003;349:366–381. doi: 10.1056/NEJMra021562. [DOI] [PubMed] [Google Scholar]
- Oberley TD. Am J Pathol. 2002;160:403–408. doi: 10.1016/S0002-9440(10)64857-2. [DOI] [PMC free article] [PubMed] [Google Scholar]
- Ouyang X, DeWeese TL, Nelson WG, Abate-Shen C. Cancer Res. 2005;65:6773–6779. doi: 10.1158/0008-5472.CAN-05-1948. [DOI] [PubMed] [Google Scholar]
- Ouyang X, Jessen WJ, Al-Ahmadie H, Serio AM, Lin Y, Shih WJ, Reuter VE, Scardino PT, Shen MM, Aronow BJ, Vickers AJ, Gerald WL, Abate-Shen C. Cancer Res. 2008;68:2132–2144. doi: 10.1158/0008-5472.CAN-07-6055. [DOI] [PubMed] [Google Scholar]
- Shannan B, Seifert M, Leskov K, Willis J, Boothman D, Tilgen W, Reichrath J. Cell Death Differ. 2006;13:12–19. doi: 10.1038/sj.cdd.4401779. [DOI] [PubMed] [Google Scholar]
- Simard J, Dumont M, Labuda D, Sinnett D, Meloche C, El-Alfy M, Berger L, Lees E, Labrie F, Tavtigian SV. Endocr Relat Cancer. 2003;10:225–259. doi: 10.1677/erc.0.0100225. [DOI] [PubMed] [Google Scholar]
- Simmons SO, Horowitz JM. Biochem J. 2006;393:397–409. doi: 10.1042/BJ20051030. [DOI] [PMC free article] [PubMed] [Google Scholar]
- Song H, Lim H, Paria BC, Matsumoto H, Swift LL, Morrow J, Bonventre JV, Dey SK. Development. 2002;129:2879–2889. doi: 10.1242/dev.129.12.2879. [DOI] [PubMed] [Google Scholar]
- Steadman DJ, Giuffrida D, Gelmann EP. Nucleic Acids Res. 2000;28:2389–2395. doi: 10.1093/nar/28.12.2389. [DOI] [PMC free article] [PubMed] [Google Scholar]
- Thorpe C, Hoober KL, Raje S, Glynn NM, Burnside J TuriGK, Coppock DL. Arch Biochem Biophys. 2002;405:1–12. doi: 10.1016/s0003-9861(02)00337-5. [DOI] [PubMed] [Google Scholar]
- Tomlins SA, Rhodes DR, Perner S, Dhanasekaran SM, Mehra R, Sun XW, Varambally S, Cao X, Tchinda J, Kuefer R, Lee C, Montie JE, Shah RB, Pienta KJ, Rubin MA, Chinnaiyan AM. Science. 2005;310:644–648. doi: 10.1126/science.1117679. [DOI] [PubMed] [Google Scholar]
- Tricoli JV, Schoenfeldt M, Conley BA. Clin Cancer Res. 2004;10:3943–3953. doi: 10.1158/1078-0432.CCR-03-0200. [DOI] [PubMed] [Google Scholar]
- Tusher VG, Tibshirani R, Chu G. Proc Natl Acad Sci U S A. 2001;98:5116–5121. doi: 10.1073/pnas.091062498. [DOI] [PMC free article] [PubMed] [Google Scholar]
- van Leenders GJ, Gage WR, Hicks JL, van Balken B, Aalders TW, Schalken JA, De Marzo AM. Am J Pathol. 2003;162:1529–1537. doi: 10.1016/S0002-9440(10)64286-1. [DOI] [PMC free article] [PubMed] [Google Scholar]
- Wang S, Gao J, Lei Q, Rozengurt N, Pritchard C, Jiao J, Thomas GV, Li G, Roy-Burman P, Nelson PS, Liu X, Wu H. Cancer Cell. 2003;4:209–221. doi: 10.1016/s1535-6108(03)00215-0. [DOI] [PubMed] [Google Scholar]
- Wu X, Wu J, Huang J, Powell WC, Zhang J, Matusik RJ, Sangiorgi FO, Maxson RE, Sucov HM, Roy-Burman P. Mech Dev. 2001;101:61–69. doi: 10.1016/s0925-4773(00)00551-7. [DOI] [PubMed] [Google Scholar]
- Xin L, Lawson DA, Witte ON. Proc Natl Acad Sci U S A. 2005;102:6942–6947. doi: 10.1073/pnas.0502320102. [DOI] [PMC free article] [PubMed] [Google Scholar]
- Zheng SL, Ju JH, Chang BL, Ortner E, Sun J, Isaacs SD, Sun J, Wiley KE, Liu W, Zemedkun M, Walsh PC, Ferretti J, Gruschus J, Isaacs WB, Gelmann EP, Xu J. Cancer Res. 2006;66:69–77. doi: 10.1158/0008-5472.CAN-05-1550. [DOI] [PubMed] [Google Scholar]
Associated Data
This section collects any data citations, data availability statements, or supplementary materials included in this article.
Supplementary Materials
Information concerning the methods for other experiments is provided as supplemental materials and methods.