

Abstract
The physiological function of NAD(P)H:quinone oxidoreductase (NQO1, DT-diaphorase) is to detoxify potentially reactive quinones by direct transfer of two electrons. A similar detoxification role has not been established for its homologue NRH:quinone oxidoreductase 2 (NQO2). Estrogen quinones, including estradiol(E2)-3,4-Q, generated by estrogen metabolism, are thought to be responsible for estrogen-initiated carcinogenesis. In this investigation, we have shown for the first time that NQO2 catalyzes the reduction of electrophilic estrogen quinones and thereby may act as a detoxification enzyme. ESI and MALDI mass spectrometric binding studies involving E2-3,4-Q with NQO2 clearly support the formation of an enzyme-substrate physical complex. The problem of spontaneous reduction of substrate by cofactor, benzyldihydronicotinamide riboside (BNAH), was successfully overcome by taking advantage of the ping-pong mechanism of NQO2 catalysis. The involvement of the enzyme in the reduction of E2-3,4-Q was further supported by addition of the inhibitor quercetin to the assay mixture. NQO2 is a newly discovered binding site (MT3) of melatonin. However, addition of melatonin to the assay mixture did not affect the catalytic activity of NQO2. Preliminary kinetic studies show that NQO2 is faster in reducing estrogen quinones than its homologue NQO1. Both UV and liquid chromatography-tandem mass spectrometry assays unequivocally corroborate the reduction of estrogen ortho-quinones by NQO2, indicating that it could be a novel target for prevention of breast cancer initiation.
Keywords: NQO2, estrogen ortho-quinones, enzyme-substrate complex, LC-MS, MALDI-TOF, kinetics, MT3, melatonin
Introduction
Like NAD(P)H:quinone oxidoreductase 1 (NQO1), its homologue NRH:quinone oxidoreductase 2 (NQO2) is ubiquitous among various tissues, including liver, kidney, brain, heart, lung, etc. [1,2]. In fact, recent studies show that a breast cell line, MCF-10A, expresses the NQO2 enzyme [3]. There is a high level of sequence homology between NQO1 and NQO2, which suggests that NQO2 may have overlapping substrate specificities and similar functions to NQO1 [4,5]. NQO2 is different from NQO1, however, in its cofactor requirements, using a metabolic product of NAD(P)H, dihydronicotinamide riboside (NRH), rather than NAD(P)H as an electron donor. A second major difference between NQO2 and NQO1 is that NQO2 is resistant to typical inhibitors of NQO1, such as dicumarol. Crystal structure analysis of NQO2 shows that it contains a specific metal binding site that is not present in NQO1 [6,7]. Owing to its broad substrate specificity, NQO1 plays an important role in the detoxification of various endogenous and exogenous quinones [8-10], including estrogen quinones [11]. However, the detoxification role of NQO2 has not been found, and it has no known endogenous biological substrates.
Estrogens are metabolized to reactive catechol estrogen quinones [12-14]. These quinones react with DNA to form depurinating N7Gua and N3Ade adducts [12-15]. Abasic sites that are formed by depurination of these adducts are thought to be responsible for inducing mutations critical for cancer initiation [16-18]. The enzymes that can carry out two-electron reduction, such as NQO1 and NQO2, might play a significant role in estrogen-initiated carcinogenesis by regulating the reduction of estrogen quinones to their catechols (Scheme 1). Based on earlier studies, for more than a decade it was thought that estrogen ortho-quinones are not substrates for NQO1 [19]. We recently used novel assay strategies to provide clear evidence for the reduction of estrogen ortho-quinones by NQO1 [11]. Taking into account the similar structural features of NQO1 and NQO2, it is logical to assume that NQO2 could also have a role in detoxification of estrogen quinones and, thus, could be a potential contributor to breast cancer prevention.
Scheme 1.

Proposed redox mechanism operating in estrogen metabolism.
In this article, we have used novel strategies to ascertain the role of NQO2 in catalyzing reduction of estrone(estradiol)-3,4-quinones [E1(E2)-3,4-Q]. For the first time, we have shown the binding of E2-3,4-Q with NQO2 using a soft ionization ESI-MS method and established that estrogen quinones are endogenous biological substrates of NQO2. It was recently discovered that NQO2 is a third cellular site (MT3) where melatonin binds [20-22]. Melatonin, a neurohormone secreted by the pineal gland during the night, has been demonstrated to be anti-carcinogenic in several studies [23-25]. As part of the present research, we also conducted a preliminary study to examine whether there is a link between estrogen metabolism, NQO2 and melatonin.
Experimental Procedures
NQO2, quercetin, benzyldihydronicotinamide riboside (BNAH), and horse myoglobin were purchased from Sigma Chemical Co. (St. Louis, MO). Menadione (MD), 9,10-phenanthrene quinone (Phe-Q) and activated MnO2 were obtained from Aldrich Chemical Co. (Milwaukee, WI). All solvents were HPLC grade and all other chemicals were of the highest grade available. 4-OHE1 and 4-OHE2 were synthesized as previously described [26]. E1(E2)-3,4-Q were freshly synthesized using a reported procedure [27] and used immediately. Sequazyme™, Mass Standards Kit for MALDI-TOF Calibration, which also included a sinapinic acid matrix, was obtained from Applied Biosystems (Foster City, CA, USA).
LC/MS-MS
LC/MS analyses were carried out with a Waters Acquity ultraperformance liquid chromatography (UPLC) system connected with a high performance Quattro Micro triple quadruple mass spectrometer designed for LC/MS-MS operation. Analytical separations on the UPLC system were conducted using an Acquity UPLC BEH C18 1.7 μm column (1 × 100 mm) at a flow rate of 0.15 ml/min. The flow was isocratic with 60% A (0.1% formic acid in H2O) and 40% B (0.1% formic acid in CH3CN), with a total separation time of 3 min. The elutions from the UPLC column were introduced to the Quattro Micro mass spectrometer. The ionization method used for the analysis was electrospray ionization (ESI) in the negative ion (NI) mode. Tandem mass spectrometry (MS-MS) was performed in a multiple reaction monitoring (MRM) mode to produce structural information about 4-OHE2 by fragmenting parent 287.3 m/z ions inside the mass spectrometer and identifying the resulting daughter 160.9 m/z fragment ions. Pure standards were used to optimize the LC/MS conditions prior to analysis.
ESI-MS
A Waters Quattro Micro triple quadruple mass spectrometer was used in all experiments with ESI in positive ion (PI) mode, ESI-MS capillary voltage of 3.0 kV, an extractor cone voltage of 2 V, a sample cone voltage of 45 V, and a detector voltage of 650 V. Cone gas flow was set at 60 l/h. Desolvation gas flow was maintained at 400 l/h. Source temperature and desolvation temperature were set to 100 and 200 °C, respectively. The acquisition range was 500-2000 Da. The sample was introduced to the source at a flow rate of 10 μl/min by using an inbuilt pump. For all the complex formation studies, a methanol:water (1:1) with 0.1% formic acid mixture was used as the carrier solution. ESI interface tuning and mass calibration were accomplished in the PI mode by using a standard horse myoglobin solution. The relative abundance of the different charged species present on ESI mass spectra were measured from their respective peak intensities, assuming that the relative intensities displayed by the different species in the ESI mass spectrum reflect the actual distribution of these species in solution. The masses determined through the deconvolution program have an estimated standard deviation of ± 10 Da.
MALDI-TOF
Mass spectra were acquired with the Voyager DE-PRO MALDI-TOF mass spectrometer (Applied Biosystems) in linear positive ion mode, 20,000 V accelerating voltage, 95% grid voltage, 0.05% guide wire, 900 ns extraction delay time, mass acquisition range of 500-40,000 Da, 50-300 laser shots per spectrum and laser intensity of 1200-1800. The instrument was calibrated with a calibration mixture from New England Biolabs. Spectra were acquired in manual mode by examining signals from random spots on the target.
Formation of NQO2-E2-3,4-Q complex
Ten μl of 50 μM NQO2 and 50 μM test compound (cholesterol, freshly synthesized E2-3,4-Q or MD) were added to 80 μl of 5 mM ammonium acetate, pH 6.8. After mixing at room temperature for 2 min, it was diluted with 400 μl of carrier solution. The complex was taken up in a 250-μl syringe and introduced to ESI-MS by direct infusion.
For MALDI-TOF analysis, 10 μl of 50 μM NQO2 and 2 μl of freshly synthesized 10 μM E2-3,4-Q were mixed in a tube at room temperature for 2 min. A 1-μl aliquot of the assay mixture was added to 10 μl of sinapinic acid matrix. A 1-μl aliquot of NQO2-sinapinic acid solution was applied to a stainless-steel target plate, air dried and the MS spectra were acquired.
Determination of NQO2 activity by using UV-Vis spectroscopy
The anaerobic reduction and oxidation of protein-bound FAD was monitored at 450 nm either in the presence or absence of substrate, inhibitor and cofactor by using a Perkin-Elmer double beam spectrophotometer. Nitrogen was bubbled continuously for 2 h in the buffer, and organic solvents were degassed to ensure anaerobic conditions. The reduction of protein-bound flavin was monitored between 280 and 700 nm. Reoxidation of the flavin was measured by following the increase in absorption at 450 nm. To 1 ml of buffer (25 mM Tris-HCl, pH 6.8) containing 0.7 mg/ml BSA in a 1.5-ml cuvette was added 10 U (0.4 μM, final concentration) of freshly prepared NQO2 (1 eq) and the spectrum was recorded, followed by addition of 0.9 eq BNAH. In the next step, reoxidation of the enzyme was carried out by addition of E1-3,4-Q, E2-3,4-Q, MD or Phe-Q (1.2 eq) to the assay mixture. In the inhibitor study, quercetin (10 μM) was added to both cuvettes and base line correction was made. To check the effect of melatonin on NQO2 activity, 2.5 eq was added to the assay mixture prior to the addition of cofactor and substrate. Control assays were carried out without E1(E2)-3,4-Q, cofactor or quercetin.
Kinetic measurements were carried out at 25 °C in 1 ml of 25 mM Tris-HCl, pH 6.8, containing 0.7 mg/ml BSA in a 1.5-ml cuvette using a UV spectrophotometer. The non-enzymatic reduction of E2-3,4-Q by NADH (ε= 6.3 mM-1/cm-1) or BNAH was monitored by recording the oxidation of these cofactors at 340 nm. The non-enzymatic reaction kinetics were studied by assaying 2.0 μM NADH or BNAH at increasing E2-3,4-Q concentrations. The reduction of NQO2/NQO1 (ε= 11.3 mM-1/cm-1) by the corresponding cofactors and reduction of the substrate, E2-3,4-Q, by reduced NQO2/NQO1 was assayed at 450 nm. In these cases, the kinetic studies were carried out by assaying 0.4 μM NQO2/NQO1 at increasing concentrations of NADH, BNAH or E2-3,4-Q. Km values were calculated with Prizm software (GraphPad Software, CA).
Determination of NQO2 inhibition using LC/MS-MS
Assays were carried out under anaerobic conditions unless otherwise reported. To ensure anaerobic conditions, N2 was continuously bubbled for 2 h in the buffer, and organic solvents were degassed. To 1 ml buffer (25 mM Tris-HCl, pH 6.8) containing 0.7 mg/ml BSA in a 1.5-ml microfuge tube was added 10 U of freshly prepared NQO2, followed by quercetin (10 μM) and 0.9 eq of BNAH. The reaction was initiated by addition of 1.2 eq of E2-3,4-Q to the assay mixture. Control assays were carried out without E2-3,4-Q or cofactor. The assay mixtures were passed through 5000 MW cutoff filters after 2 min and were directly injected on LC/MS for product analysis.
Comparison of NQO2and NQO1 by using LC/MS-MS
The assays were carried out under anaerobic conditions unless otherwise reported. To ensure anaerobic conditions, N2 was continuously bubbled for 2 h in the buffer, and organic solvents were degassed. To 1 ml buffer (25 mM Tris-HCl, pH 6.8) containing 0.7 mg/ml BSA in a 1.5-ml microfuge tube was added 25 U of freshly prepared NQO2 or NQO1, followed by excess BNAH or NADH, respectively. The excess cofactor was removed by filtering through a 5000 MW cutoff filter after 1 min. The reduced enzyme was washed with buffer and filtered to remove traces of cofactor. Finally, the enzyme was taken into 100 μl buffer and reaction was initiated by addition of 1.2 eq of E2-3,4-Q to the assay mixture. The assay mixture was passed through a 5000 MW cutoff filter after 1 min and directly injected on LC/MS for product analysis.
Results
The AM1 energy-minimized structures of E2-3,4-Q, cholesterol and Phe-Q are presented in Figure 1. From these data, the length of the E1(E2)-3,4-Q and Phe-Q molecules is less than ∼11 Å (Figure 1a and c), which could facilitate their entry into the binding site of NQO2. Cholesterol, a structural mimic of estrogens, with an additional bulky side-chain at the C-17 position and a non-aromatic A ring (Figure 1b), was selected as a control for ESI-MS binding studies.
Figure 1.
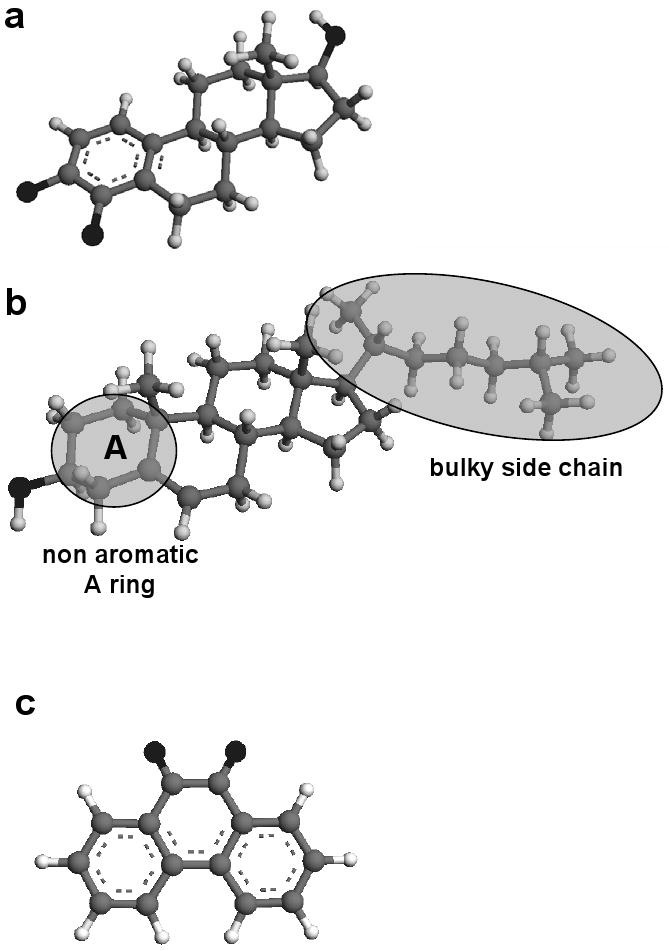
AM1 energy-minimized structures of (a) E2-3,4-Q, (b) cholesterol and (c) Phe-Q.
Determination of the substrate-NQO2 complex by MS
NQO2 alone and its ligand-enzyme complexes were used to optimize the operating conditions of the mass spectrometer to obtain appropriate sensitivity and to prevent dissociation of the enzyme-substrate complex. Multiple charges are observed, as typically seen in ESI-MS [28,29]. The observed molecular masses of intact NQO2 in different charged states (Figure 2a) are presented in Table 1. Most of the signals from different enzyme charged states appear in the region m/z 800-1300. Deconvolution of the ESI spectrum gave a molecular mass of 25,838 Da for NQO2 (Figure 2b). As expected, incubation of cholesterol, which has a bulky side chain and a non-aromatic A ring, with NQO2 did not result in any change in the spectrum compared to NQO2 alone (Figures 2a, b and 2c, d). For MD, with molecular weight 172, the resulting mass of 26,023 Da was consistent with the proposed physical complex (< 0.05% difference) (Figure 2e, f). The mass spectrum after incubation of NQO2 with E2-3,4-Q is presented in Figure 2g. Formation of an NQO2-substrate physical complex was confirmed by observing the shifts in all the charged species, in accordance with the increased m/z ratio, after addition of the substrate, E2-3,4-Q (Table 1). The deconvolution of the NQO2-E2-3,4-Q spectrum resulted in a peak at 26112 Da (Figure 2h). With NQO2-E2-3,4-Q, the observed mass difference was consistent with the mass of the corresponding proposed physical complex (< 0.03% different), which should result in an increase in mass of 286 Da. As indicated by the ESI-MS results, E2-3,4-Q displays strong binding with NQO2 (Figure 2g and 2h).
Figure 2.

Positive-ion electrospray ionization mass spectrum of (a) 1 μM NQO2 in carrier solution, (c) after addition of 1 eq of cholesterol, (e) MD or (g) E2-3,4-Q. The m/z values of major peaks corresponding to different NQO1 charged states (z) are shown under the spectra. See Table 1 for peak assignments. The molecular mass of (b) NQO2 in carrier solution and (d) after addition of 1 eq of cholesterol, (f) MD or (h) E2-3,4-Q is also presented.
Table 1. Calculated and experimental m/z values for the NQO2-substrate complexes.
| Charge (z) |
NQO2 (25838)* |
NQO2 + cholesterol | NQO2 + MD (172) |
NQO2 + E2-3,4-Q (286) |
||
|---|---|---|---|---|---|---|
| + | Observed m/z |
Observed m/z |
Calculated m/z |
Observed m/z |
Calculated m/z |
Observed m/z |
| 20 | 1293 | 1293 | 1301 | 1305 | 1306 | |
| 21 | 1231 | 1232 | 1239 | 1240 | 1244 | |
| 22 | 1175 | 1775 | 1182 | 1183 | 1187 | |
| 23 | 1124 | 1124 | 1131 | 1133 | 1136 | 1125 |
| 24 | 1077 | 1078 | 1084 | 1086 | 1089 | 1080 |
| 25 | 1035 | 1035 | 1040 | 1042 | 1045 | 1039 |
| 26 | 995 | 995 | 1000 | 1001 | 1005 | 1000 |
| 27 | 958 | 958 | 963 | 968 | 965 | |
| 28 | 925 | 924 | 929 | 933 | 931 | |
| 29 | 894 | 893 | 897 | 901 | 901 | |
| 30 | 865 | 863 | 867 | 871 | 871 | |
| 31 | 839 | 843 | 844 | |||
Numbers in parentheses are molecular weights.
Further support for formation of the NQO2-E2-3,4-Q physical complex was obtained by using MALDI-TOF. Figure 3 shows the MALDI-TOF spectra obtained for NQO2 before and after treatment with E2-3,4-Q. The masses obtained, m/z 25834 and 26125, were found to be consistent with the masses for NQO2 and NQO2-E2-3,4-Q (< 0.02% different) and are comparable to the results from ESI –MS.
Figure 3.

MALDI-TOF analysis of (a) NQO2 alone and (b) NQO2- E2-3,4-Q physical complex, after addition of E2-3,4-Q to NQO2. The experimental error is < 0.02%.
NQO2 activity
BNAH spontaneously reduces E1(E2)-3,4-Q (Figure 4). Therefore, the activity of NQO2 in reducing E2-3,4-Q could not be ascertained using conventional assay procedures. To overcome this problem, we took advantage of the ping-pong mechanism of enzyme catalysis. The assay was divided into two steps. First, FAD-NQO2 was reduced with BNAH, and, second, the reduced enzyme was used to carry out the reduction of the substrate. The reduction of substrate by the enzyme was studied by monitoring the redox cycle of FAD in the active site of NQO2. The UV-Vis absorption spectrum of native (oxidized) NQO2 is shown in Figure 5A-D, spectra a. The stoichiometry of BNAH was adjusted to 0.9 eq to avoid spontaneous reduction of the substrate by excess BNAH. Upon addition of BNAH to the assay mixture containing NQO2, the FAD absorption peak at 450 nm completely disappeared, due to its reduction to FADH2 (Figure 5A-D, spectra b). Next, 1.2 eq of E1-3,4-Q, E2-3,4-Q, Phe-Q or MD was added to the reaction mixture, which caused the peak at 450 nm to reappear (Figure 5A-D, spectra c). Excess (1.2 eq) substrate was used in the assay so that it could outnumber any unreacted BNAH, and sufficient molecules would be available for enzyme catalysis. At the completion of the substrate reduction, the spectrum of FAD was completely restored (Figure 5A-D, spectra c). The UV spectra of the substrates, E1-3,4-Q, E2-3,4-Q, Phe-Q and MD alone, are shown in Figure 5A-D, spectra d, respectively. These data clearly demonstrate that NQO2 catalyzes the reduction of E1-3,4-Q and E2-3,4-Q.
Figure 4.
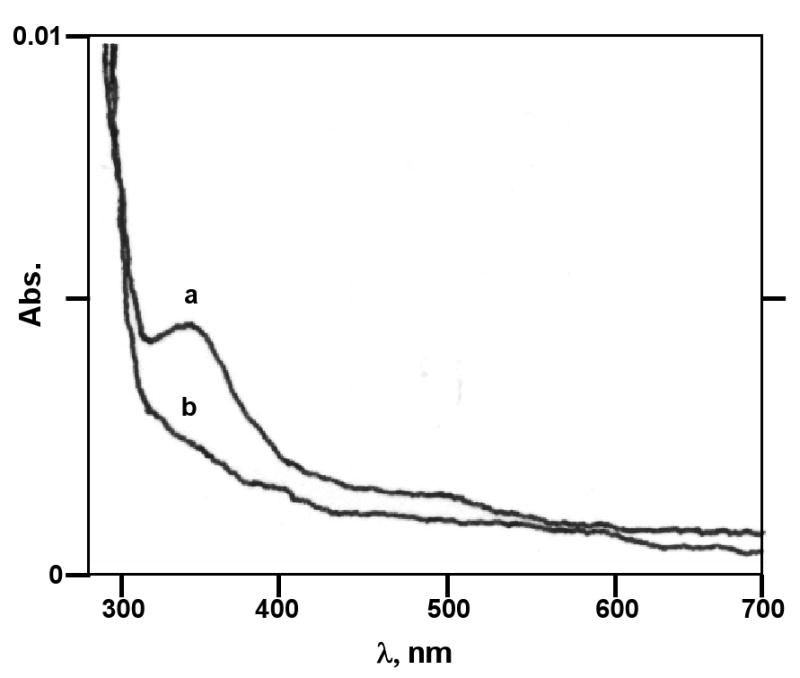
Spectral changes of BNAH following addition of E2-3,4-Q. (a) BANH alone, (b) the spectrum after addition of E2-3,4-Q.
Figure 5.
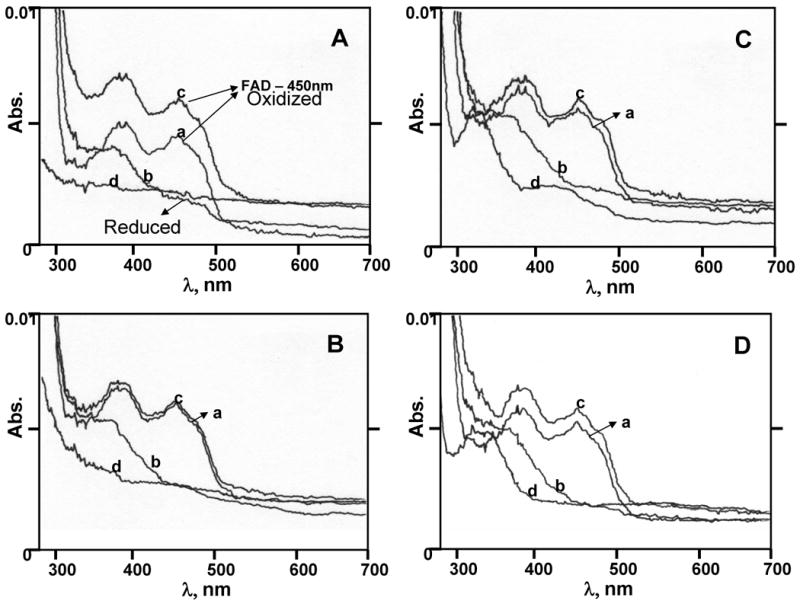
Spectral changes of NQO2 following addition of BNAH and substrate, (A) E1-3,4-Q. (B) E2-3,4-Q, (C) Phe-Q or (D) MD. The absorption spectra were measured after sequential addition of NQO2, BNAH and substrate to 1 ml of 25 mM Tris-HCl, pH 6.8 at room temperature. The concentration of the enzyme was 10 U NQO2 (spectra a). The spectra after addition of 0.9 eq BNAH (spectra b) and 1.2 eq substrate (spectra c), in that order. The control spectra (d) in all assay mixtures for 1.2 eq substrate, E1(E2)-3,4-Q, Phe-Q and MD, alone were also recorded from 280-700 nm.
Effect of melatonin and quercetin on NQO2 activity
Addition of excess melatonin to NQO2 caused no significant reduction in the intensity of the 450 nm FAD absorption peak (Figure 6A, spectrum b). Melatonin binding apparently did not affect the reduction of NQO2-FAD by BNAH and further reduction of the substrate, E2-3,4-Q (Figure 6A, spectra c and d). However, when the quercetin inhibitor was added to the assay mixture prior to addition of the cofactor, the BNAH could not reduce FAD completely (Figure 6B, spectra a-c). To confirm the reduction of E2-3,4-Q, the assay mixtures were passed through a filter and subjected to LC/MS-MS analysis. The levels of 4-OHE2 in the assay mixture were ∼3.5-fold higher compared to the control (Figures 7 and 8). Formation of 4-OHE2 was observed in assays without the cofactor, which may be due to chemical reactions in the mass spectrometer source. When quercetin, a potent inhibitor of NQO2, was added to the assay mixture, the formation of 4-OHE2 was reduced by 64 % compared to the absence of inhibitor (Figure 8).
Figure 6.
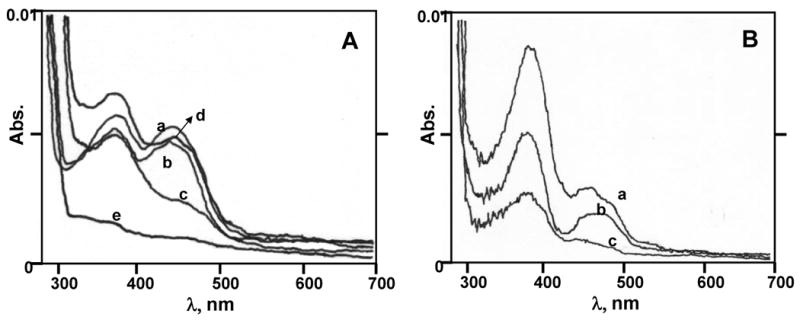
(A) Effect of melatonin on the reduction of NQO2-FAD by BNAH. The absorption spectrum of 10 U NQO2 was recorded before (a) and after sequential addition of 2.5 eq of melatonin (b), 0.9 eq BNAH (c) and 1.2 eq substrate (d). Control spectrum (e) was obtained for melatonin alone. (B) Inhibition of reduction of NQO2-FAD by BNAH with quercetin. The spectroscopic analysis was carried out as described in Methods. The absorption spectrum of 10 U NQO2 was recorded before (a) and after (b) addition of 0.9 eq BNAH. In the inhibition studies, 10 μM quercetin was added to a cuvette containing 10 U NQO2 prior to the addition of 0.9 eq BNAH (c).
Figure 7.

UPLC/MS-MS of standard (A) 4-OHE2 and (B) assay mixture containing 10 U NQO2, 0.9 eq BNAH and 1.2 eq E2-3,4-Q.
Figure 8.

NQO2-catalyzed reduction of E2-3,4-Q in the presence of BNAH as cofactor. (A) To 1 ml buffer (25 mM Tris-HCl, pH 6.8) containing 0.7 mg/ml BSA in a 1.5-ml microfuge tube was added freshly prepared 10 U NQO2, 0.9 eq BNAH and 1.2 eq E2-3,4-Q sequentially. (B) Inhibition of NQO1 was obtained by addition of 10 μM quercetin prior to addition of BNAH and E2-3,4-Q. Control assays were carried out without substrate (C) or cofactor (D). The assay mixtures were filtered and injected on LC/MS for product analysis.
Comparison of NQO2 and NQO1 activity
To eliminate the possible effects from the two cofactors, NADH and BNAH, the reduced forms of NQO1 and NQO2 were prepared as described in Methods and used to reduce E2-3,4-Q. LC/MS analysis showed 1.8-fold higher levels of 4-OHE2 in the NQO2 assay mixture than in the NQO1 mixture (Figure 9).
Figure 9.

Comparison of NQO1 and NQO2-catalyzed reduction of E2-3,4-Q in the presence of NADH or BNAH as cofactor, respectively, was carried out as described in experimental procedures. Levels of 4-OHE2 formed in the NQO1 (A) and NQO2 (B) assay mixture were analyzed by LC/MS.
Kinetic Studies
Both BNAH and NADH reduce E2-3,4-Q spontaneously. Hence, the kinetics of reduction of enzyme by cofactor and the reduction of substrate by reduced enzyme were studied separately. Km values for reduction of the NQO2 and NQO1 enzymes by the BNAH and NADH cofactors were determined to be 0.75 μM and 2.88 μM, respectively (Figure 10a,10d), whereas the Km values for reduction of E2-3,4-Q by the NQO2 and NQO1 enzymes were determined to be 0.033 μM and 0.051 μM, respectively (Figure 10b,10e). As expected in a non-catalyzed chemical reaction, the graph of velocity against substrate concentration was a straight line for both reactions involving chemical reduction of E2-3,4-Q by BNAH or NADH (Figure 10c,10f).
Figure 10.
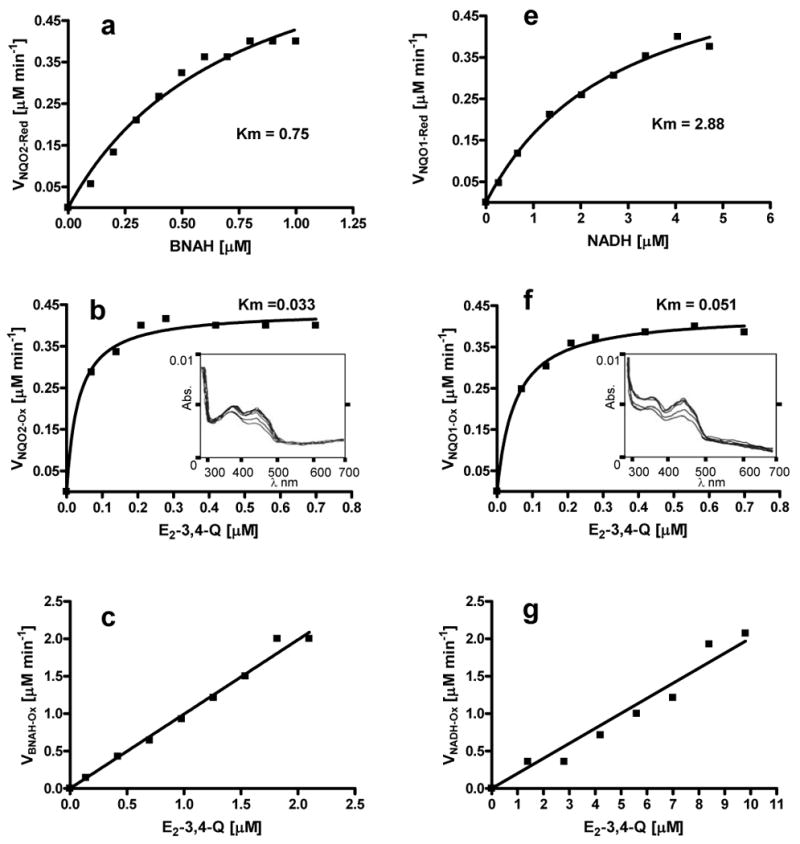
Michaelis-Menten plots for the kinetics of NQO2 and NQO1 catalysis. (a,d) reduction of NQO2 and NQO1 enzymes, respectively, by BNAH and NADH, respectively; (b,e) reduction of E2-3,4-Q by NQO2 and NQO1, respectively, and (c,f) non-enzymatic reduction of E2-3,4-Q by BNAH and NADH, respectively.
In summary, mass spectrometric (ESI-MS and MALDI-TOF) determination of the enzyme-substrate complex and the UV and UPLC-MS studies revealed the ability of NQO2 to reduce the ortho-quinones E1(E2)-3,4-Q and Phe-Q, as well as the para-quinone MD. Melatonin did not affect the catalytic activity of NQO2. NQO2 reduced E2-3,4-Q faster than NQO1.
Discussion
Binding of E2-3,4-Q with NQO2 was confirmed by a soft ionization method, ESI-MS, which has the advantage that labile physical complexes are successfully analyzed intact [30,31]. Experimental data from the MS analysis demonstrated increases in the masses of charged states, which match the theoretical increases in mass after substrate binding to NQO2 (Table 1, Figure 2). Cholesterol was used as a control because its bulky side-chain at the C-17 position is expected to hinder its entry into the binding pocket of the enzyme (Figure 1). In addition, ring A of cholesterol is non-aromatic and cannot have the necessary pi-pi stacking with the aromatic amino acids in the binding pocket. Cholesterol failed to lodge in the binding site of the enzyme, which is evident from the absence of change in the mass spectrum compared to NQO2 alone (Figure 2). Binding by either cofactor or substrate causes a change in the conformation of NQO1 and other proteins [32]. This may be the reason why certain charged species have changed abundances in the mass spectra of NQO2-ligand complexes. Both E2-3,4-Q and MD caused a distinct shift in the charged state signals of NQO2 after binding, suggesting the formation of an NQO2-substrate physical complex. Results from ESI-MS studies were further corroborated by analyzing the NQO2- E2-3,4-Q complex by MALDI-TOF (Figure 3).
BNAH, the most widely used cofactor of NQO2, spontaneously reduced E2-3,4-Q (Figure 4). For this reason, the NQO2 activity assay was carried out in two stages. First, in the absence of oxygen, NQO2 was stoichiometrically reduced with BNAH, which transferred hydride to the FAD bound to the enzyme (Scheme 2). After hydride transfer, the cofactor left and made the binding pocket available for the substrate [33]. Figure 5A-D, spectra b, reflects that the NQO2 enzyme is readily reduced by BNAH, without needing the presence of the substrate as an activating effector. In fact, FAD-NQO2 is reduced by a number of natural and non-natural cofactors [34]. In the next step, hydride was transferred from N-5 of the isoalloxazine of reduced flavin to the ortho-quinone (Scheme 2). The reoxidation of FAD after addition of E1-3,4-Q or E2-3,4-Q, confirming their reduction in the binding pocket of NQO2, is shown in Figure 5A and B, spectra c. To further support the reduction of ortho-quinones in general by NQO2, we have used the stable ortho-Phe-Q as a substrate (Figure 5C). The AM1 energy-minimized structures of E1-3,4-Q, E2-3,4-Q and Phe-Q show that the length of the these molecules is less than ∼11 Å, indicating that the catalytic site is big enough to accommodate these molecules with up to four rings (Figure 1a and c). After this reduction, the resulting hydroquinolate tautomerizes to catechol, 4-OHE2 (Scheme 2), and the isoalloxazine of FAD returns to the oxidized quinoid form. The regeneration of FAD implies that E2-3,4-Q has reached the binding pocket and it did not alkylate the binding site, corroborating the interpretation of our ESI-MS results. Quercetin is one of the potent NQO2 inhibitors [5,34]. The effect of this competitive inhibitor on the reduction of FAD-NQO2 is depicted in Figure 6B. The residual peak at 450 nm suggests that BNAH is unable to reach and reduce FAD in the binding pocket due to the presence of quercetin. This result correlates very well with the observations from the NQO1-dicumarol complex crystal structure analysis reported earlier [35].
Scheme 2.

Proposed mechanism for reduction of o-quinones by NQO2.
Subsequent LC-MS analysis of the reaction mixtures that were used for the above UV assays confirmed the higher levels of 4-OHE2 in the complete assay mixtures than in control mixtures, as well as inhibition of NQO2 by quercetin (Figure 8). The primary objective in using molar equivalents of NQO2, E2-3,4-Q and BNAH in these studies was to avoid nonenzymatic reduction of substrate by BNAH and observe the enzyme catalysis. Due to the selected stoichiometry of enzyme, substrate and cofactor, a 3.5-fold increase of 4-OHE2 formation was observed compared to control (Figure 8). In biological systems a different arrangement might be at work.
Since we have found that both NQO1 and NQO2 can catalyze the reduction of estrogen quinones, it was natural for us to compare their activity. Two major problems were encountered in studying the kinetics of NQO2 and NQO1: The ping-pong mechanism of catalysis involves two steps, one, binding of cofactor, and the second, binding of substrate. Since the binding ability of both NADH and BNAH to the respective enzymes might differ, this can lead to conclusions that may not correctly reflect the kinetics of substrate reduction. Another factor is the spontaneous reduction of substrate by both cofactors. To overcome these difficulties and level the cofactor binding step, we completely reduced both NQO2 and NQO1 with excess BNAH and NADH, respectively, and washed away the excess cofactor. In the following step we now have equally reduced enzymes to carry out reduction of E2-3,4-Q. Preliminary results suggest that NQO2 catalyzes the reduction of estrogen quinones almost twice as fast as NQO1 (Figure 9).
In an attempt to further understand the putative comparative activity of NQO2 and NQO1, we have also overcome above problems by determining the kinetics of the ping-pong mechanism in two separate steps. Km values for reduction of NQO2 by BNAH and reduction of E2-3,4-Q by reduced NQO2 were found to be lower than the respective Km values obtained for reduction of NQO1 by NADH and reduction of E2-3,4-Q by reduced NQO1 (Figure 10). These results further suggest independently that NQO2 may be slightly faster than NQO1 in both of the ping-pong catalysis steps. As anticipated for a non-enzymatic reaction, the velocity of the E2-3,4-Q reduction by BNAH or NADH was found to be directly proportional to the concentration of substrate, which resulted in a straight line (Figure 10 c,f).
Further studies are needed to reveal the contribution of NQO2 and NQO1 in the reduction of estrogen quinones in vivo.
NQO2 was recently found to be a third binding site (MT3) of the neurohormone melatonin. Melatonin levels are found to be lower in women with breast cancer than in healthy women, suggesting a possible link between breast cancer and melatonin [23,24]. It is interesting to note that estrogens, which are known to initiate breast cancer, and melatonin, which might be involved in prevention of breast cancer, have a common binding site, NQO2, indicating a possible mutual relationship. However, in a preliminary in vitro assay, the presence of melatonin did not assist or inhibit FAD reduction, which was followed by quinone reduction (Figure 6A). This suggests that melatonin and estrogens may be independent in exerting their actions. Since these experiments were carried out with the constrained stoichiometry of assay components for the reasons described above, further in vivo studies are needed to examine these results.
In conclusion, we have defined the physiological role of MT3/NQO2 by demonstrating that E1-3,4-Q and E2-3,4-Q are substrates of NQO2. NQO2 deactivates these cancer-initiating estrogen ortho-quinones faster than NQO1. Thus, in addition to NQO1, NQO2 could be a new molecular target to explore. This study opens the way for a novel enzymatic investigation of the highly efficient NQO2 in prevention of breast cancer.
Acknowledgments
This research was supported by the U.S. Army Breast Cancer Research Program grant DAMD 17-03-0229 and by Prevention LLC. Core support at the Eppley Institute was provided by grant P30 CA36727 from the National Cancer Institute.
Abbreviations
- BNAH
benzyldihydronicotinamide riboside
- E1-3, 4-Q
estrone-3,4-quinone
- E2-3, 4-Q
estradiol-3,4-quinone
- ESI
electrospray ionization
- LC/MS
liquid chromatography/mass spectrometry
- MD
menadione
- MRM
multiple reaction monitoring
- MS-MS
tandem mass spectrometry
- NI
negative ion
- NQO1
NAD(P)H:quinone oxidoreductase 1
- NQO2
NRH:quinone oxidoreductase 2
- NRH
dihydronicotinamide riboside
- 4-OHE2
4-hydroxyestradiol
- Phe-Q
9,10-phenanthrene quinone
- PI
positive ion
Footnotes
Publisher's Disclaimer: This is a PDF file of an unedited manuscript that has been accepted for publication. As a service to our customers we are providing this early version of the manuscript. The manuscript will undergo copyediting, typesetting, and review of the resulting proof before it is published in its final citable form. Please note that during the production process errors may be discovered which could affect the content, and all legal disclaimers that apply to the journal pertain.
References
- 1.Long DJ, 2nd, Jaiswal AK. NRH:quinone oxidoreductase2 (NQO2) Chem Biol Interact. 2000;129:99–112. doi: 10.1016/s0009-2797(00)00200-3. [DOI] [PubMed] [Google Scholar]
- 2.Nosjean O, Nicolas JP, Klupsch F, Delagrange P, Canet E, Boutin JA. Comparative pharmacological studies of melatonin receptors: MT1, MT2 and MT3/QR2. Tissue distribution of MT3/QR2. Biochem Pharmacol. 2001;61:1369–1379. doi: 10.1016/s0006-2952(01)00615-3. [DOI] [PubMed] [Google Scholar]
- 3.Burchiel SW, Thompson TA, Lauer FT, Oprea TI. Activation of dioxin response element (DRE)-associated genes by benzo(a)pyrene 3,6-quinone and benzo(a)pyrene 1,6-quinone in MCF-10A human mammary epithelial cells. Toxicol Appl Pharmacol. 2007;221:203–214. doi: 10.1016/j.taap.2007.02.020. [DOI] [PMC free article] [PubMed] [Google Scholar]
- 4.Jaiswal AK, Burnett P, Adesnik M, McBride OW. Nucleotide and deduced amino acid sequence of a human cDNA (NQO2) corresponding to a second member of the NAD(P)H:quinone oxidoreductase gene family. Extensive polymorphism at the NQO2 gene locus on chromosome 6. Biochemistry. 1990;29:1899–1906. doi: 10.1021/bi00459a034. [DOI] [PubMed] [Google Scholar]
- 5.Wu K, Knox R, Sun XZ, Joseph P, Jaiswal AK, Zhang D, Deng PS, Chen S. Catalytic properties of NAD(P)H:quinone oxidoreductase-2 (NQO2), a dihydronicotinamide riboside dependent oxidoreductase. Arch Biochem Biophys. 1997;347:221–228. doi: 10.1006/abbi.1997.0344. [DOI] [PubMed] [Google Scholar]
- 6.Foster CE, Bianchet MA, Talalay P, Zhao Q, Amzel LM. Crystal structure of human quinone reductase type 2, a metalloflavoprotein. Biochemistry. 1999;38:9881–9886. doi: 10.1021/bi990799v. [DOI] [PubMed] [Google Scholar]
- 7.AbuKhader M, Heap J, De Matteis C, Kellam B, Doughty SW, Minton N, Paoli M. Binding of the anticancer prodrug CB1954 to the activating enzyme NQO2 revealed by the crystal structure of their complex. J Med Chem. 2005;48:7714–7719. doi: 10.1021/jm050730n. [DOI] [PubMed] [Google Scholar]
- 8.Ross D, Siegel D. NAD(P)H: quinone oxidoreductase 1 (NQO1, DT-diaphorase), functions and pharmacogenetics. Methods Enzymol. 2004;382:115–144. doi: 10.1016/S0076-6879(04)82008-1. [DOI] [PubMed] [Google Scholar]
- 9.Kiyohara C, Yoshimasu K, Takayama K, Nakanishi Y. NQO1, MPO, and the risk of lung cancer: a HuGE review. Genet Med. 2005;7:463–478. doi: 10.1097/01.gim.0000177530.55043.c1. [DOI] [PubMed] [Google Scholar]
- 10.Bianco NR, Chaplin LJ, Montano MM. Differential induction of quinone reductase by phytoestrogens and protection against oestrogen-induced DNA damage. Biochem J. 2005;385:279–287. doi: 10.1042/BJ20040959. [DOI] [PMC free article] [PubMed] [Google Scholar]
- 11.Gaikwad NW, Rogan EG, Cavalieri EL. Evidence from ESI-MS for NQO1-catalyzed reduction of estrogen ortho-quinones. Free Radic Biol Med. 2007;43:1289–1298. doi: 10.1016/j.freeradbiomed.2007.07.021. [DOI] [PMC free article] [PubMed] [Google Scholar]
- 12.Cavalieri E, Rogan E, Chakravarti D. The role of endogenous catechol quinones in the initiation of cancer and neurodegenerative diseases. Methods Enzymol. 2004;382:293–319. doi: 10.1016/S0076-6879(04)82017-2. [DOI] [PubMed] [Google Scholar]
- 13.Cavalieri E, Chakravarti D, Guttenplan J, Hart E, Ingle J, Jankowiak R, Muti P, Rogan E, Russo J, Santen R, Sutter T. Catechol estrogen quinones as initiators of breast and other human cancers: implications for biomarkers of susceptibility and cancer prevention. Biochim Biophys Acta. 2006;1766:63–78. doi: 10.1016/j.bbcan.2006.03.001. [DOI] [PubMed] [Google Scholar]
- 14.Zahid M, Kohli E, Saeed M, Rogan E, Cavalieri E. The greater reactivity of estradiol-3,4-quinone vs estradiol-2,3-quinone with DNA in the formation of depurinating adducts: implications for tumor-initiating activity. Chem Res Toxicol. 2006;19:164–172. doi: 10.1021/tx050229y. [DOI] [PubMed] [Google Scholar]
- 15.Cavalieri EL, Li KM, Balu N, Saeed M, Devanesan P, Higginbotham S, Zhao J, Gross ML, Rogan EG. Catechol ortho-quinones: the electrophilic compounds that form depurinating DNA adducts and could initiate cancer and other diseases. Carcinogenesis. 2002;23:1071–1077. doi: 10.1093/carcin/23.6.1071. [DOI] [PubMed] [Google Scholar]
- 16.Chakravarti D, Mailander PC, Li KM, Higginbotham S, Zhang HL, Gross ML, Meza JL, Cavalieri EL, Rogan EG. Evidence that a burst of DNA depurination in SENCAR mouse skin induces error-prone repair and forms mutations in the H-ras gene. Oncogene. 2001;20:7945–7953. doi: 10.1038/sj.onc.1204969. [DOI] [PubMed] [Google Scholar]
- 17.Mailander PC, Meza JL, Higginbotham S, Chakravarti D. Induction of A.T to G.C mutations by erroneous repair of depurinated DNA following estrogen treatment of the mammary gland of ACI rats. J Steroid Biochem Mol Biol. 2006;101:204–215. doi: 10.1016/j.jsbmb.2006.06.019. [DOI] [PubMed] [Google Scholar]
- 18.Zhao Z, Kosinska W, Khmelnitsky M, Cavalieri EL, Rogan EG, Chakravarti D, Sacks PG, Guttenplan JB. Mutagenic activity of 4-hydroxyestradiol, but not 2-hydroxyestradiol, in BB rat2 embryonic cells, and the mutational spectrum of 4-hydroxyestradiol. Chem Res Toxicol. 2006;19:475–479. doi: 10.1021/tx0502645. [DOI] [PubMed] [Google Scholar]
- 19.Nutter LM, Zhou B, Sierra EE, Wu YY, Rummel MM, Gutierrez P, Abul-Hajj Y. Cellular biochemical determinants modulating the metabolism of estrone 3,4-quinone. Chem Res Toxicol. 1994;7:609–613. doi: 10.1021/tx00041a004. [DOI] [PubMed] [Google Scholar]
- 20.Nosjean O, Ferro M, Coge F, Beauverger P, Henlin JM, Lefoulon F, Fauchere JL, Delagrange P, Canet E, Boutin JA. Identification of the melatonin-binding site MT3 as the quinone reductase 2. J Biol Chem. 2000;275:31311–31317. doi: 10.1074/jbc.M005141200. [DOI] [PubMed] [Google Scholar]
- 21.Souza AV, Visconti MA, Castrucci AM. Melatonin biological activity and binding sites in human melanoma cells. J Pineal Res. 2003;34:242–248. doi: 10.1034/j.1600-079x.2003.02928.x. [DOI] [PubMed] [Google Scholar]
- 22.Mailliet F, Ferry G, Vella F, Thiam K, Delagrange P, Boutin JA. Organs from mice deleted for NRH:quinone oxidoreductase 2 are deprived of the melatonin binding site MT3. FEBS Lett. 2004;578:116–120. doi: 10.1016/j.febslet.2004.10.083. [DOI] [PubMed] [Google Scholar]
- 23.Schernhammer ES, Hankinson SE. Urinary melatonin levels and breast cancer risk. J Natl Cancer Inst. 2005;97:1084–1087. doi: 10.1093/jnci/dji190. [DOI] [PubMed] [Google Scholar]
- 24.Lenoir V, de Jonage-Canonico MB, Perrin MH, Martin A, Scholler R, Kerdelhué B. Preventive and curative effect of melatonin on mammary carcinogenesis induced by dimethylbenz[a]anthracene in the female Sprague-Dawley rat. Breast Cancer Res. 2005;7:R470–R476. doi: 10.1186/bcr1031. [DOI] [PMC free article] [PubMed] [Google Scholar]
- 25.Shiu SY. Towards rational and evidence-based use of melatonin in prostate cancer prevention and treatment. J Pineal Res. 2007;43:1–9. doi: 10.1111/j.1600-079X.2007.00451.x. [DOI] [PubMed] [Google Scholar]
- 26.Saeed M, Zahid M, Rogan E, Cavalieri E. Synthesis of the catechols of natural and synthetic estrogens by using 2-iodoxybenzoic acid (IBX) as the oxidizing agent. Steroids. 2005;70:173–178. doi: 10.1016/j.steroids.2004.11.005. [DOI] [PubMed] [Google Scholar]
- 27.Dwivedy I, Devanesan P, Cremonesi P, Rogan E, Cavalieri E. Synthesis and characterization of estrogen 2,3- and 3,4-quinones. Comparison of DNA adducts formed by the quinones versus horseradish peroxidase-activated catechol estrogens. Chem Res Toxicol. 1992;5:828–833. doi: 10.1021/tx00030a016. [DOI] [PubMed] [Google Scholar]
- 28.van Duijn E, Simmons DA, van den Heuvel RH, Bakkes PJ, van Heerikhuizen H, Heeren RM, Robinson CV, van der Vies SM, Heck AJ. Tandem mass spectrometry of intact GroEL-substrate complexes reveals substrate-specific conformational changes in the trans ring. J Am Chem Soc. 2006;128:4694–4702. doi: 10.1021/ja056756l. [DOI] [PubMed] [Google Scholar]
- 29.Vermeiren CL, Pluym M, Mack J, Heinrichs DE, Stillman MJ. Characterization of the heme binding properties of Staphylococcus aureus IsdA. Biochemistry. 2006;45:12867–12875. doi: 10.1021/bi0607711. [DOI] [PubMed] [Google Scholar]
- 30.Felitsyn N, Peschke M, Kebarle P. Origin and number of charges observed on multiply-protonated native proteins produced by ESI. Int J Mass Spec. 2002;219:39–62. [Google Scholar]
- 31.Beck JL, Colgrave ML, Ralph SF, Sheil MM. Electrospray ionization mass spectrometry of oligonucleotide complexes with drugs, metals, and proteins. Mass Spectrom Rev. 2001;20:61–87. doi: 10.1002/mas.1003. [DOI] [PubMed] [Google Scholar]
- 32.Winski SL, Faig M, Bianchet MA, Siegel D, Swann E, Fung K, Duncan MW, Moody CJ, Amzel LM, Ross D. Characterization of a mechanism-based inhibitor of NAD(P)H:quinone oxidoreductase 1 by biochemical, X-ray crystallographic, and mass spectrometric approaches. Biochemistry. 2001;40:15135–15142. doi: 10.1021/bi011324i. [DOI] [PubMed] [Google Scholar]
- 33.Li R, Bianchet MA, Talalay P, Amzel LM. The three-dimensional structure of NAD(P)H:quinone reductase, a flavoprotein involved in cancer chemoprotection and chemotherapy: mechanism of the two-electron reduction. Proc Natl Acad Sci U S A. 1995;92:8846–8850. doi: 10.1073/pnas.92.19.8846. [DOI] [PMC free article] [PubMed] [Google Scholar]
- 34.Boutin JA, Chatelain-Egger F, Vella F, Delagrange P, Ferry G. Quinone reductase 2 substrate specificity and inhibition pharmacology. Chem Biol Interact. 2005;151:213–228. doi: 10.1016/j.cbi.2005.01.002. [DOI] [PubMed] [Google Scholar]
- 35.Asher G, Dym O, Tsvetkov P, Adler J, Shaul Y. The crystal structure of NAD(P)H quinone oxidoreductase 1 in complex with its potent inhibitor dicoumarol. Biochemistry. 2006;45:6372–6378. doi: 10.1021/bi0600087. [DOI] [PubMed] [Google Scholar]