Abstract
Epac2 is a member of the family of exchange proteins directly activated by cAMP (Epac). Our previous studies suggest a model of Epac activation in which cAMP binding to the enzyme induces a localized “hinge” motion that reorients the regulatory lobe relative to the catalytic lobe without inducing large conformational changes within individual lobes. In this study, we identified the location of the major hinge in Epac2 by normal mode motion correlation and structural alignment analyses. Targeted mutagenesis was then performed to test the functional importance of hinge bending for Epac activation. We show that substitution of the conserved residue phenylalanine 435 with glycine (F435G) facilitates the hinge bending and leads to a constitutively active Epac2 capable of stimulating nucleotide exchange in the absence of cAMP. In contrast, substitution of the same residue with a bulkier side chain, tryptophan (F435W), impedes the hinge motion and results in a dramatic decrease in Epac2 catalytic activity. Structural parameters determined by small angle x-ray scattering further reveal that whereas the F435G mutant assumes a more extended conformation in the absence of cAMP, the F435W mutant is incapable of adopting the fully extended and active conformation in the presence of cAMP. These findings demonstrate the importance of hinge motion in Epac activation. Our study also suggests that phenylalanine at position 435 is the optimal size side chain to keep Epac closed and inactive in the absence of cAMP while still allowing the proper hinge motion for full Epac extension and activation in the presence of cAMP.
Exchange proteins directly activated by cAMP (Epac)2 are a family of novel intracellular sensors for the second messenger cAMP (1, 2). Unlike the classic eukaryotic cAMP receptor, cAMP-dependent protein kinase (protein kinase A; PKA), Epac proteins do not function as protein kinases that phosphorylate downstream substrates. Instead, they act as guanine nucleotide exchange factors and exert their functions by activating small GTP-binding proteins, Rap1 and Rap2. At the cellular level, Epac proteins assume distinct subcellular localization (3), and depending upon the specific cellular environment, Epac and PKA may act independently, converge synergistically, or oppose each other in regulating a specific cellular function (4, 5).
Both Epac and PKA share a common cyclic nucleotide binding domain (CBD), a compact and evolutionarily conserved structural motif found in a variety of proteins with diverse cellular functions (6). CBDs act as molecular switches for sensing intracellular second messenger cAMP levels and regulate the functionality of the domain(s) to which they are linked (6, 7). In depth structural and biophysical analyses of CBDs in several CBD-containing families, including cAMP receptor proteins, PKAs, and cyclic nucleotide-gated ion channels, have revealed a conserved structural core as well as functional motifs important for cyclic nucleotide-induced activation (8–11). The CBD is composed of an eight-strand β-barrel core that forms the base of the nucleotide binding pocket and a lateral α-helical bundle subdomain. Although the β-barrel core remains relatively constant between the ligand-free and nucleotide-bound states, binding of cAMP to a CBD leads to significant conformational changes in the overall arrangement of the α-helical bundle subdomain. A general mechanism of cyclic nucleotide-induced activation of CBD-containing proteins has been recently proposed (12). In this model, binding of cAMP leads to the retraction of the phosphate-binding cassette toward the cyclic nucleotide binding pocket and consequently releases the steric hindrance imposed on the α-helix C-terminal to the β-barrel, termed the CBD lid, by a conserved hydrophobic residue within the phosphate-binding cassette. These structural changes result in a hinge motion that allows the lid to move closer to the β-barrel core and to interact with the base of the cyclic nucleotide.
The recently solved crystal structure of Epac2 reveals that, unlike other CBD-containing proteins, the corresponding lid region in Epac points away from the cAMP binding pocket as a two-strand β-sheet that forms the first part of the five-strand β-sheet “switchboard” structure (13). Although this major structural difference suggests that the detailed mechanisms of PKA and Epac activation by cAMP will most likely be different at the atomic level, it is not clear if the aforementioned general mechanism, namely the hinge motion, is conserved during Epac activation. To address this important question, we determined the effects of targeted hinge perturbations on Epac activation using site-directed mutagenesis that specifically targeted a key residue in the hinge region of Epac2.
EXPERIMENTAL PROCEDURES
Protein Expression and Purification
Recombinant full-length Epac2 and C-terminal truncated Rap1-(1–167) were expressed as GST fusion proteins in Escherichia coli CK600K cells. Cell growth and protein induction for recombinant Epac2 were performed as described previously (14), except that 17 g/liter NaCl, 0.6 g/liter betaine, and 2.3 g/liter proline were added to the growth medium when the cell density reached 0.5, as measured by absorption at 600 nm. Recombinant Epac2 and Rap1-(1–167) with the GST tag cleaved were purified essentially as described by Rehmann et al. (15). All proteins used in this study were at least 95% pure, as judged by SDS-PAGE.
Site-directed Mutagenesis
F435G and F435W mutants of Epac2 were generated using the QuikChange site-directed mutagenesis kit (Stratagene).
Equilibrium Titration of Fluorescent cAMP Analog
All of the fluorescence measurements were performed at 23 °C using a FluoroMax-3 spectrofluorometer equipped with a thermostatic cell holder and a magnetic stirrer. Titration of the fluorescent cAMP analog, 8-NBD-cAMP, with purified Epac2 was carried out as described elsewhere (16). Briefly, an increasing amount of the protein was titrated into a cuvette containing 0.1 μm 8-NBD-cAMP in buffer A (10 mm Tris-HCl, pH 7.5, 150 mm NaCl, 1 mm EDTA, 1 mm dithiothreitol). Fluorescence emission spectra between 500 and 600 nm were recorded with the excitation wavelength set at 471 nm. Fluorescence intensity at 540 nm was plotted as a function of protein concentration.
Measurement of in Vitro Guanine Nucleotide Exchange Factor (GEF) Activity of Epac2 Proteins
A fluorescence-based assay was used to measure the in vitro GEF activity of Epac2 and its mutants using a C-terminal truncated Rap1-(1–167) as previously described (17). Briefly, 0.2 μm Rap1-(1–167) loaded with the fluorescent GDP analog, Mant-GDP, was incubated with 0.1 μm Epac2 in buffer B (50 mm Tris-HCl, pH 7.5, 5 mm MgCl2, and 1 mm dithiothreitol) containing a 100-fold molar excess of unlabeled GDP (20 μm) and various concentrations of cAMP between 0 and 700 μm. Exchange of Mant-GDP by GDP was measured as a decrease in fluorescence intensity over time using excitation and emission wavelengths of 366 and 450 nm, respectively. Typically, decay in the fluorescence intensity was recorded over a time course of 6000 s for wild type (WT) and Epac2-F435G proteins or 10,000 s for the Epac2-F435W mutant, with data points taken every 60 s. The reaction rate constant (observed kGEF) was obtained by fitting the experimental data to a single exponential equation (15). The observed kGEF versus cAMP concentration was used to calculate the activation constant, AC50, and turnover rate kmax, as described previously (18).
Association of Epac2 and Rap1B Monitored by Affinity Pull-down
Effects of Phe435 substitution with glycine or tryptophan on the association of Epac2 with Rap1B were examined by an affinity pull-down assay using purified recombinant proteins. GST-Rap1B affinity resin (4.1 mg of protein per 1 ml of beads) was prepared by incubation of purified GST-Rap1B with glutathione-Sepharose 4B resin in buffer C (40 mm Tris, pH 7.5, 160 mm NaCl, 5 mm dithiothreitol, and 1 mm EDTA), followed by an extensive wash with the buffer A. Rap1B affinity resin (15 μl) was incubated for 4 h with an equimolar amount of wild type or mutant Epac2 protein at 4 °C in buffer A in the absence or presence of 300 μm cAMP. At the end of the incubation, the resin was spun down and washed twice with 250 μl of the incubation buffer. Associated proteins were eluted from the beads with 15 mm GSH in 10 mm Tris and 300 mm NaCl (pH 8.0) and analyzed by SDS-PAGE. Control experiments were performed in parallel using an equal amount of glutathione-Sepharose beads only.
Small Angle X-ray Scattering (SAXS) Measurements
SAXS data of Epac2 proteins in buffer A were collected at 12 °C on the University of Utah SAXSess (Anton Paar) instrument using CuKα radiation (λ = 1.54 Å) and an image plate detector. Two-dimensional data collected from the image plate were integrated to one dimension and reduced to I(Q) versus Q (where Q = 4π(sin θ)/λ) using the SAXSquant software package provided by the vendor. The net scattering from the protein was calculated by subtraction of a normalized buffer spectrum. For WT Epac2, different protein concentrations (between 1 and 15 mg/ml) were measured to determine the optimal concentration for SAXS measurements and to ensure that there were no concentration-dependent effects on the scattering due to protein aggregation or interparticle effects. The optimal concentration of WT Epac2, 2–5 mg/ml, was used for analysis of WT and mutant proteins.
The probable distribution of vector lengths P(r) as a function of distance between scattering centers, r, was derived from the inverse Fourier transformation of I(Q) using the program GNOM (20) over the Q-range 0.013–0.1551 Å−1. The boundary constraints of P(r) = 0 at r = 0 and at the maximum linear dimension, Dmax, were applied to P(r). A smearing correction was applied in GNOM to correct for the slit geometry of the SAXSess instrument. The radius of gyration, Rg, was determined by GNOM and by Guinier analysis. Guinier analysis indicated a linear fit at low Q (i.e. Q·Rg < 1.4), consistent with there being no significant nonspecific aggregation of the sample.
RESULTS
Hinge Analysis of Epac2
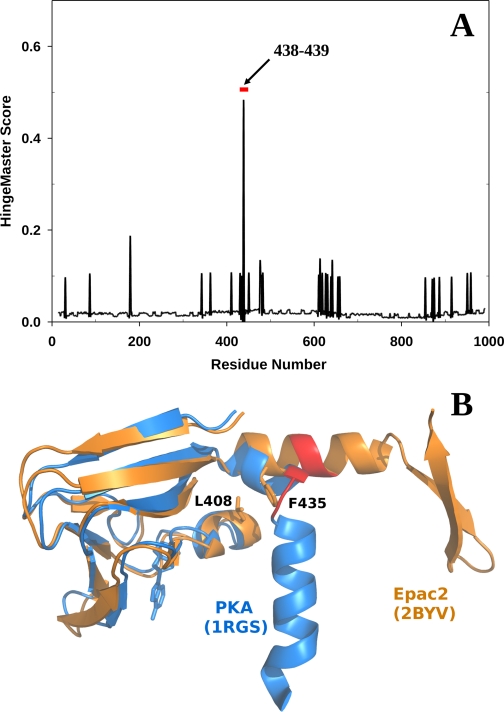
Extensive structural analyses by x-ray crystallographic and solution biophysical techniques suggests that activation of Epac proteins by cAMP involves a hinge motion between the regulatory and catalytic lobes of the protein. To identify the precise location of the hinge, we subjected the apo-Epac2 crystal structure to further analysis using the HingeMaster software program that predicts the hinge location in a protein by integrating existing hinge predictors (TLSMD, StoneHinge, FlexOracle, and HingeSeq) with a family of novel hinge predictors based on grouping residues with correlated normal mode motions (21). Because each of these methods predicts hinges using very different sources of information (experimental thermal factors, bond constraint networks, energetics, and sequence and normal modes, respectively), HingeMaster improves predictions by integrating these complementary methods into a combined predictor using a weighted voting scheme. Our analysis revealed a major hinge in Epac2 around residues 438–439 (Fig. 1). Initial examination of this predicted hinge suggested that this is an unusual location in the structure for a hinge, since residues 438 and 439 are positioned in the middle of an α-helix in the apo-Epac2 crystal structure. However, careful sequence alignment and structural comparison between Epac and the regulatory subunits of PKA revealed that the predicted hinge region in Epac2 matches exactly with the hinge of the first CBD in PKA (Fig. 1B).
FIGURE 1.
Hinge analyses of Epac2. A, combined hinge prediction scores of the Epac2 structure using the HingeMaster server as a function of Epac2 amino acid residue number. Red bar, predicted hinge region. B, superimposition of the second CBD of the apo-Epac2 structure (Protein Data Bank code 2BYV) shown in orange and the first CBD of the cAMP-bound PKA RIα structure (Protein Data Bank code 1RGS) shown in blue. The hinge (Protein Data Bank code 1RGS) and the predicted hinge region (Protein Data Bank code 2BYV) are both highlighted in red. B was made using PyMol (25).
Effect of Hinge Mutation on Epac2 Catalytic Activity
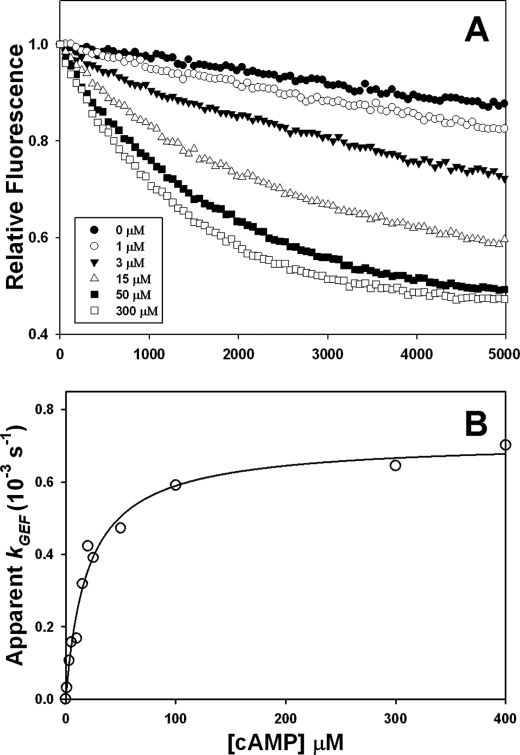
To determine the functional importance of the proposed hinge motion in Epac activation, we targeted the conserved Phe435 residue by site-directed mutagenesis (Fig. 1B). Phe435 is one of the several conserved hydrophobic residues that have been previously identified to be potentially important for anchoring and stabilizing the hinge structure (22). If the hinge motion is important for Epac2 activation, loosening or stiffening of the hinge will probably enhance or suppress Epac2 activation, respectively. To test this hypothesis, we substituted the phenylalanine at 435 with either a glycine or a tryptophan to facilitate or interfere with hinge bending, respectively. The effect of these mutations on Epac2 GEF activity was examined using a fluorescence-based assay where Rap1-bound fluorescent Mant-GDP was exchanged against an excess of unlabeled free GDP. Released free Mant-GDP has a decreased fluorescence intensity compared with protein-bound Mant-GDP. Although WT Epac2 is not capable of stimulating Mant-GDP-dissociation in the absence of cAMP, increases in Epac2 GEF activity were observed as a function of cAMP concentration (Fig. 2A). When the observed rate of Mant-GDP release was plotted against the cAMP concentration (Fig. 2B), the maximal GEF rate (kmax) under saturating cAMP concentrations and the half-maximal activation constant (AC50) were calculated to be 0.72 × 10⁻³ s−1 and 20.2 μm, respectively (Table 1). These measurements are in excellent agreement with the literature values (15).
FIGURE 2.
GEF activity of Epac2. A, activation of Rap1 by Epac2 was monitored by incubating 0.1 μm Epac2 with 0.2 μm Rap1-(1–167) loaded with Mant-GDP in the presence of 20 μm GDP and various concentrations of cAMP, as indicated. The kinetics of nucleotide exchange of Mant-GDP by GDP was measured as a time-dependent decrease in fluorescence intensity. B, dependence of Epac2 activity on cAMP concentration. The observed initial rates of exchange (kGEF), calculated by fitting of the data in Fig. 2A to a single exponential decay, are plotted against cAMP concentration.
TABLE 1.
Catalytic parameters for WT and mutant Epac2 proteins
| WT Epac2 | Epac2-F435G | Epac2-F435W | |
|---|---|---|---|
| k0 (s−1)a | 0 | 0.43 × 10⁻³ | 0 |
| kmax (s−1)a | 0.72 × 10⁻³ | 0.72 × 10⁻³ | 0.15 × 10⁻³ |
| AC50 (μm)a | 20.2 | 25.2 | 22.7 |
a k0 and kmax are the apparent guanine nucleotide exchange rate under zero or saturating concentration of cAMP, respectively, whereas AC50 is the half-maximal activation constant.
Unlike the WT protein, Epac2-F435G was capable of stimulating Mant-GDP dissociation in the absence of cAMP (Fig. 3A), indicating that Epac2-F435G exhibited partial constitutive activity. The addition of cAMP led to a further increase in GEF activity in a dose-dependent manner (Fig. 3B). Although the kmax and AC50 values of Epac2-F435G (0.72 × 10⁻³ s−1 and 25.2 μm, respectively) were essentially identical to that of the WT, the observed GEF rate (kGEF) of Epac2-F435G in the absence of cAMP was determined to be 0.43 × 10⁻³ s−1, more than 60% of the kmax. In contrast, substitution of Phe435 with the bulkier tryptophan side chain resulted in a dramatic decrease in the ability of Epac2 to stimulate the GEF activity of Rap1 (Figs. 3, C and D). Similar to the WT, Epac2-F435W was inactive without cAMP, but the kmax value (0.15 × 10⁻³ s−1) for Epac2-F435W in the presence of saturating cAMP was only 20% of the WT kmax value, whereas its AC50 value (22.7 μm) was no different from that of the WT or the Epac2-F435G mutant (Table 1).
FIGURE 3.
Altered GEF activities of the Epac2-F435G and Epac2-F435W mutants. Activation of Rap1 by Epac2-F435G (A) or Epac2-F435W (C) in the absence or presence of various concentrations of cAMP was monitored by following the time-dependent decrease in fluorescence intensity as a measure of the rate of exchange of Mant-GDP by GDP. Dependence of Epac2-F435G (B) or Epac2-F435W (D) GEF activity (kGEF) on cAMP concentration is shown.
Association of Epac2 and Rap1B Monitored by Affinity Pull-down
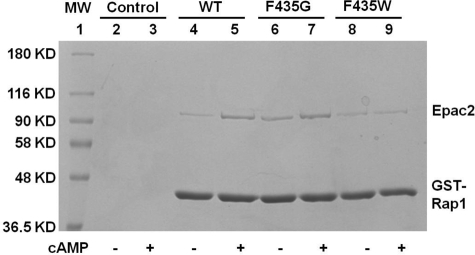
To further test whether hinge mutations at phenylalanine 435 affect interactions of Epac2 with Rap1B, we performed direct affinity pull-down experiments using GST-Rap1 and purified Epac2 proteins (WT, F435G, and F435W). These data are shown in Fig. 4. In the absence of cAMP, GST-Rap1 pulled down very little WT or F435W but did pull down significant amounts of F435G. In the presence of saturating cAMP concentrations, GST-Rap1 pulled down comparable amounts of WT and F435G Epac2 but very little F435W. These results are consistent with the enzymatic data obtained by measuring the GEF activity of Epac2 WT and mutant proteins (Figs. 2 and 3) and support the conclusion that the F435G hinge mutant interacts with Rap1 in the absence of cAMP, whereas the F435W mutant is impaired in its ability to interact with Rap1 even in the presence of saturating cAMP.
FIGURE 4.
Association of Rap1B with WT or mutant Epac2 protein in the absence or presence of 300 μm cAMP. Gel image of a pull-down assay performed using GST-Rap1 and identical concentrations of wild type and mutant Epac2 proteins. Lane 1, protein molecular weight markers; lanes 2 and 3, beads only controls; lanes 4 and 5, WT Epac2; lanes 6 and 7, Epac2-F435G; lanes 8 and 9, Epac2-F435W.
Effect of Hinge Mutations on Epac2 Protein Integrity and cAMP-binding Activity
To ensure that the mutations did not affect the structural integrity of the mutant proteins and their ability to bind cAMP, we measured the overall secondary structure and cAMP-binding affinity of the mutant Epac2 proteins. As shown in Fig. 5A, superimposable CD spectra were obtained using WT and mutant Epac2 proteins, suggesting that Epac2-F435G and Epac2-F435W were folded correctly with overall secondary structures identical to those of the WT protein. In addition, cAMP binding determined using the fluorescently labeled cAMP analog, 8-NBD-cAMP, showed superimposable binding isotherms (Fig. 5B), suggesting that both Epac2-F435G and Epac2-F435W mutants bound to cAMP with an affinity similar to that of the WT protein. These data clearly show that substitution of Phe435 with glycine or tryptophan does not significantly affect overall protein folding or cAMP binding activity.
FIGURE 5.
Secondary structure and ligand-binding characterization of WT and mutant Epac2 proteins. A, CD spectra of the WT Epac2, Epac2-F435G, and Epac2-F435W proteins at 1 mg/ml concentration. B, cAMP-binding isotherms of WT Epac2, Epac2-F435G, and Epac2-F435W monitored using 8-NBD-cAMP as described under “Experimental Procedures.”
Effects of Hinge Mutation on Epac2 Structure Determined by SAXS
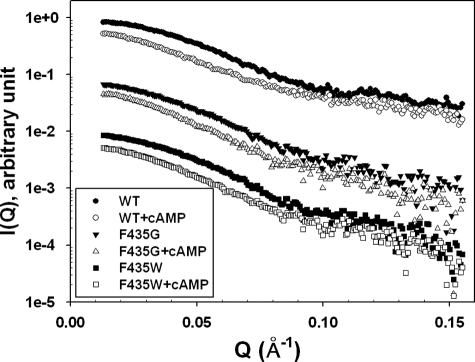
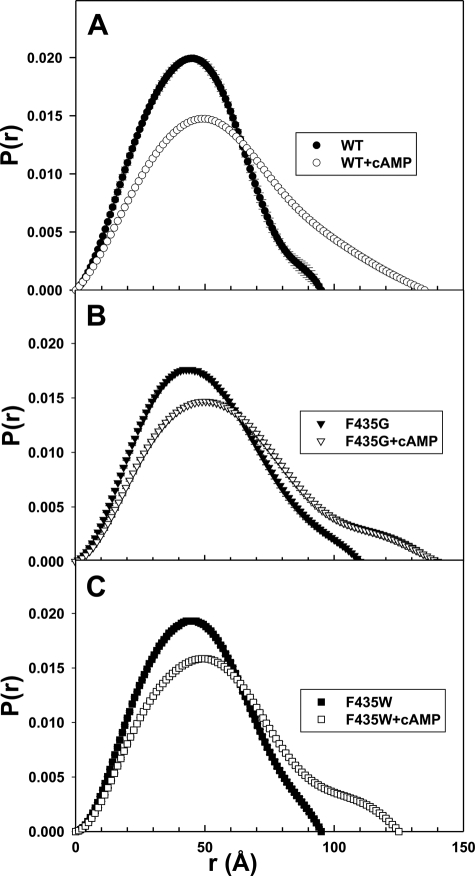
To investigate the corresponding structural perturbations introduced by F435G and F435W mutations, we monitored and compared the global solution structures of WT and mutant Epac2 proteins by SAXS. The SAXS curves (I(Q) versus Q) for the WT and mutant Epac2 are shown in Fig. 6, whereas the vector length distribution P(r) curves of the WT and mutant Epac2 proteins in the presence and absence of cAMP are shown in Fig. 7. The basic scattering parameters, Rg and Dmax, are summarized in Table 2. The P(r) curve for WT Epac2 suggests that it assumes a compact globular conformation with a Dmax value of ∼95 Å. Binding of cAMP to Epac2 led to significant increases in both Rg and Dmax, indicating that Epac2 assumes a much more extended or open conformation in the presence of cAMP (Fig. 7A and Table 2). The F435G mutant is less compact than the WT protein in the absence of cAMP, as reflected by a significant increase in Dmax (∼110 versus ∼95 Å) and Rg (38.0 versus 34.0 Å), and the F435G mutant is slightly more extended than the WT protein in the presence of cAMP (Dmax ∼140 Å versus ∼135 Å; Rg of 45.3 Å versus 44.2 Å; Fig. 7B and Table 2). In contrast, the F435W mutant is similar in overall shape to WT Epac2 in the absence of cAMP but does not become as extended (Dmax ∼125 Å, Rg of 42.4 Å) as WT or the F435G mutant in the presence of cAMP (Fig. 7C). These data are consistent with the notion that the hinge region plays a key role in the domain dynamics of Epac2 and illustrate that the size of a critical amino acid side chain proximal to the hinge region can affect the overall structure and domain dynamics of both the apo- and the cAMP-bound forms of Epac2.
FIGURE 6.
Small angle x-ray scattering profiles for WT and mutant Epac2 proteins. I(Q) versus Q profiles for WT Epac2, Epac2-F435G, and Epac2-F435W proteins in the presence or absence of cAMP (300 μm). Scattering curves have been arbitrarily offset along the y axis to facilitate comparison.
FIGURE 7.
P(r) versus r plots for WT and mutant Epac2 proteins. Comparison of P(r) curves for the WT Epac2 (A), Epac2-F435G (B), and Epac2-F435W (C) proteins in the absence or presence of cAMP (300 μm). The P(r) was normalized relative to the area under the curve.
TABLE 2.
SAXS structural parameters for WT and mutant Epac2 proteins in the presence and absence of cAMP
Rg and Dmax were determined from the P(r), as discussed under “Experimental Procedures” using data over the Q range 0.013–0.1551 Å−1.
| WT Epac2 | Epac2-F435G | Epac2-F435W | |
|---|---|---|---|
| Rg (Å) | |||
| Epac2 | 34.0 ± 0.2 | 38.0 ± 0.2 | 35.1 ± 0.1 |
| Epac2 + cAMP | 44.2 ± 0.3 | 45.5 ± 0.4 | 42.4 ± 0.3 |
| Dmax (Å) | |||
| Epac2 | 95 | 110 | 95 |
| Epac2 + cAMP | 135 | 140 | 125 |
DISCUSSION
The Epac family proteins represent the newest members of the CBD-containing proteins. They act as GEFs and exert their functions by activating small GTP-binding proteins, Rap1 and Rap2. Unlike PKA, Epac contains both catalytic and regulatory domains in a single polypeptide chain. Our previous studies suggest a model of Epac activation in which cAMP binding to the enzyme induces a localized “hinge” motion that reorients the regulatory domain relative to the catalytic domain without inducing large conformational changes within either of the individual domains (22, 23). If our hypothesis that cAMP-induced hinge motion is essential for Epac activation is correct, stabilization or disruption of the hinge bending will probably enhance or suppress cAMP-induced Epac activation, respectively. Thus, the validity of our hinge bending model of Epac activation can be tested using targeted mutagenesis of critical amino acids proximal to the interdomain hinge region.
Sequence analysis using hinge prediction software reveals a potential interdomain hinge in Epac2 around residues 438–439, which corresponds to the interdomain hinge of the first CBD in PKA (Fig. 1). Based on our earlier structural modeling studies, the hinge bending in the cAMP-bound Epac CBD structure is maintained by hydrophobic interactions formed among Leu408, Phe435, and Leu439. All of these residues are conserved between the sole CBD of Epac1 and the second high affinity CBD of Epac2. In this report, we present structural and functional characterizations of two Epac2 mutants in which Phe435 has been substituted with either glycine or tryptophan to facilitate or interfere with the hinge bending, respectively.
The GEF activities of the WT Epac2 and F435G mutant are essentially identical in the presence of saturating concentrations of cAMP. However, unlike WT Epac2, the Epac2-F435G mutant is able to partially activate Rap1 in the absence of cAMP. This suggests that the naturally occurring phenylalanine at position 435 restricts hinge motion just enough to fully inhibit GEF activity in the absence of cAMP but allows full hinge motion in the presence of cAMP. In contrast, the Epac2-F435W mutant is significantly less active than the WT enzyme in the presence of saturating concentrations of cAMP. These data are interpreted as being complementary to the effects of the F435G mutation and further support our prediction regarding the location and key role of interdomain “hinge” bending in Epac activation. The fact that Phe435 is highly conserved among Epac proteins is consistent with it being located at a critical position within the “hinge region” to optimally control coupling of cAMP binding to enzyme activation.
It has been proposed that in solution Epac can exist in two conformations (active and inactive), which are in dynamic equilibrium (18). According to this model, cAMP-free Epac exists predominantly in the inactive state, whereas protein in complex with cAMP adopts mostly an active conformation. Thus, this model describes Epac activation by cAMP as a shift of the preexisting equilibrium to the active state upon cAMP binding. Our results suggest that the hinge motion described in this study represents the major conformational change between the inactive and active states at equilibrium. Replacing phenylalanine with glycine at 435 allows more facile movement of domains on either side of the hinge and shifts the conformational equilibrium to the active conformation state in the absence of cAMP. On the basis of the enzyme activity analysis of the F435G mutant in the absence of cAMP (Fig. 3B), it is estimated that more than 60% of the Epac2-F435G protein can assume a conformational state that resembles the active cAMP-bound conformation of WT Epac2.
Our steady-state SAXS results indicate that in solution the Epac2-F435G mutant and WT Epac2 have similar extended structures in the presence of cAMP. In the absence of cAMP, both structures are more compact, but the ensemble average conformation of the F435G mutant is more extended than WT Epac2, which might allow the catalytic domain of F435G mutant to interact with Rap1 in the absence of cAMP. In contrast, the F435W mutant is similar to WT Epac2 in the absence of cAMP, but this mutant does not become as extended as WT in the presence of cAMP. These data are consistent with our model regarding the role of the interdomain hinge region in mediating cAMP-regulated conformational changes and the essential role of Phe435 in regulating Epac2 domain dynamics. Indeed, the dynamic equilibrium between the active/extended and inactive/compact conformations of the protein in solution are reflected in the observed small angle x-ray scattering profile of the protein, which represents the time and ensemble average of these conformational states. The larger Rg and Dmax values of the F435G mutant in the absence of cAMP relative to WT indicate a shift in the conformational equilibrium toward the active/extended state, a state that can more readily interact with Rap1. In contrast, the smaller Rg and Dmax values (relative to WT) of the F435W mutant in the presence of cAMP indicate that this mutant cannot fully shift to the active/extended state due to restricted hinge motion.
We have attempted to model our SAXS data using published Epac2 crystal structures. Although the calculated Rg (33 Å) value based on the apo-Epac2 structure is similar to the experimentally determined Rg (34 Å), the predicted SAXS curve calculated using CRYSOL based on the full-length apo-Epac2 crystal structure (2BYV) is significantly different from that of the experimentally measured apo-Epac2 scattering profile at Q values greater than 0.07 Å−1. Rigid body modeling using the program BUNCH led to a significant improvement of the overall fitting of the calculated and measured scattering profiles. However, the calculated and measured scattering profiles still differ significantly at higher Q values (>0.1 Å−1). These analyses suggest that the overall size and shape of Epac2 in solution is similar to that of Epac2 in the crystal structure but that there are differences. The differences are most likely because multiple conformational states of Epac2 exist in solution, all of which contribute to the observed SAXS profile, whereas the crystal structure of apo-Epac2 captures only a single stable conformation of the protein. This conclusion is consistent with the idea presented in this study that in solution Epac2 exists as a dynamic ensemble of multiple conformational states. To adequately model the conformational states contributing to the observed Epac2 SAXS data will require additional experimental data and more sophisticated structural modeling methods.
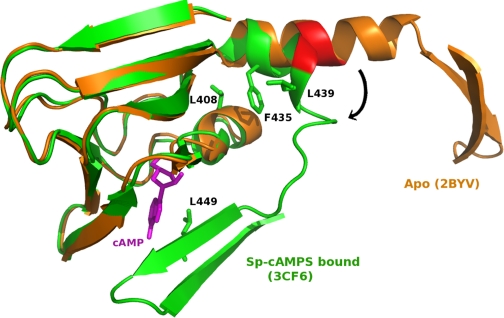
During the preparation of our manuscript, an elegant x-ray crystal structure of a deletion Epac2, Δ(1–305)Epac2, in complex with Sp-cAMPS and Rap1B was published (24). This 2.2 Å resolution structure indeed confirms that the major conformational change induced by binding of cAMP during Epac activation is a hinge motion. In fact, as predicted by the HingeMaster program, the pivot of the hinge is located exactly at residues 438 and 439 in the active Epac2 structure (Fig. 8), where the last two turns of the hinge helix “melt” to accommodate the hinge bending and consequently reorient the catalytic domain relative to the CBD domain (24). Moreover, the bending of the hinge is stabilized by hydrophobic interactions formed among residues Leu408, Phe435, and Leu439 as well as the stacking of Leu449 to the adenine base of the cAMP, consistent with our earlier predictions based on homology modeling analyses (22, 23). However, unlike PKA and our earlier hypothesis, the lid of the CBD in cAMP-bound Epac2 structure is not a simple helix but instead consists of the C-terminal β-strands of the CBD and the first helix of the RAS exchange motif domain (24). Nevertheless, the results of the present study and the recent Epac2 crystal structure support a general activation mechanism, namely an interdomain hinge motion, for all CBD-containing proteins.
FIGURE 8.
Hinge motion and Epac2 activation. The second CBD of the inactive apo-Epac2 structure (Protein Data Bank code 2BYV; shown in orange) and the active Sp-cAMPS-bound Epac2 (Protein Data Bank code 3CF6; shown in green) are superimposed. The hinge or the predicted hinge region is highlighted in red, and the Sp-cAMPS ligand is colored in purple. This figure was made using PyMol (25).
Acknowledgments
We thank Professor Alfred Wittinghofer (Abteilung Strukturelle Biologie Max-Planck-Institut für Molekulare Physiologie), Dr. Holger Rehman, and Professor Johannes Bos (University Medical Center Utrecht Universiteitsweg) for providing E. coli CK600K cells and pGEX-4T-Epac2 constructs. We also thank Victor Camacho for assisting in collecting and analyzing some of the small angle X-ray scattering data and Dr. Jill Trewhella for advice and generous permission to use her laboratory facilities.
This work was supported, in whole or in part, by National Institutes of Health, NIGMS, Grant GM066170, American Heart Association Grant-in-Aid 0755049Y, and NIEHS Center Grant ES006676. X-ray scattering data were collected at the University of Utah using facilities that are supported by United States Department of Energy Grant DE-FG02-05ER64026 (to Jill Trewhella).
- Epac
- exchange protein(s) directly activated by cAMP
- 8-NBD-cAMP
- 8-[[2-[(7-nitro-4-benzofurazanyl)amino]ethyl]thio]adenosine-3′,5′-cyclic monophosphate
- CBD
- cAMP binding domain
- GEF
- guanine nucleotide exchange factor
- Mant-GDP
- 3′-O-(N-methylanthraniloyl)guanosine diphosphate
- PKA
- protein kinase A/cAMP-dependent protein kinase
- Rap
- Ras-proximate
- SAXS
- small angle x-ray scattering
- Sp-cAMPS
- Sp-adenosine-3′,5′-cyclic monophosphorothioate
- GST
- glutathione S-transferase
- WT
- wild type.
REFERENCES
- 1.de Rooij J., Zwartkruis F. J., Verheijen M. H., Cool R. H., Nijman S. M., Wittinghofer A., Bos J. L. (1998) Nature 396,474–477 [DOI] [PubMed] [Google Scholar]
- 2.Kawasaki H., Springett G. M., Mochizuki N., Toki S., Nakaya M., Matsuda M., Housman D. E., Graybiel A. M. (1998) Science 282,2275–2279 [DOI] [PubMed] [Google Scholar]
- 3.Qiao J., Mei F. C., Popov V. L., Vergara L. A., Cheng X. (2002) J. Biol. Chem. 277,26581–26586 [DOI] [PubMed] [Google Scholar]
- 4.Mei F. C., Qiao J., Tsygankova O. M., Meinkoth J. L., Quilliam L. A., Cheng X. (2002) J. Biol. Chem. 277,11497–11504 [DOI] [PubMed] [Google Scholar]
- 5.Cheng X., Ji Z., Tsalkova T., Mei F. (2008) Acta Biochim. Biophys. Sin. 40,651–662 [DOI] [PMC free article] [PubMed] [Google Scholar]
- 6.Kannan N., Wu J., Anand G. S., Yooseph S., Neuwald A. F., Venter J. C., Taylor S. S. (2007) Genome Biol. 8,R264. [DOI] [PMC free article] [PubMed] [Google Scholar]
- 7.Berman H. M., Ten Eyck L. F., Goodsell D. S., Haste N. M., Kornev A., Taylor S. S. (2005) Proc. Natl. Acad. Sci. U.S.A. 102,45–50 [DOI] [PMC free article] [PubMed] [Google Scholar]
- 8.Knighton D. R., Zheng J. H., Ten Eyck L. F., Ashford V. A., Xuong N. H., Taylor S. S., Sowadski J. M. (1991) Science 253,407–414 [DOI] [PubMed] [Google Scholar]
- 9.Su Y., Dostmann W. R., Herberg F. W., Durick K., Xuong N. H., Ten Eyck L., Taylor S. S., Varughese K. I. (1995) Science 269,807–813 [DOI] [PubMed] [Google Scholar]
- 10.Kim C., Xuong N. H., Taylor S. S. (2005) Science 307,690–696 [DOI] [PubMed] [Google Scholar]
- 11.Wu J., Brown S. H., von Daake S., Taylor S. S. (2007) Science 318,274–279 [DOI] [PMC free article] [PubMed] [Google Scholar]
- 12.Rehmann H., Wittinghofer A., Bos J. L. (2007) Nat. Rev. Mol. Cell Biol. 8,63–73 [DOI] [PubMed] [Google Scholar]
- 13.Rehmann H., Das J., Knipscheer P., Wittinghofer A., Bos J. L. (2006) Nature 439,625–628 [DOI] [PubMed] [Google Scholar]
- 14.Mei F. C., Cheng X. D. (2005) Mol. Biosyst. 1,325–331 [DOI] [PubMed] [Google Scholar]
- 15.Rehmann H. (2006) Methods Enzymol. 407,159–173 [DOI] [PubMed] [Google Scholar]
- 16.Kraemer A., Rehmann H. R., Cool R. H., Theiss C., de Rooij J., Bos J. L., Wittinghofer A. (2001) J. Mol. Biol. 306,1167–1177 [DOI] [PubMed] [Google Scholar]
- 17.van den Berghe N., Cool R. H., Horn G., Wittinghofer A. (1997) Oncogene 15,845–850 [DOI] [PubMed] [Google Scholar]
- 18.Rehmann H., Rueppel A., Bos J. L., Wittinghofer A. (2003) J. Biol. Chem. 278,23508–23514 [DOI] [PubMed] [Google Scholar]
- 19.Deleted in proof
- 20.Svergun D. I., Semenyuk A. V., Feigin L. A. (1988) Acta Crystallogr. Sect. A 44,244–250 [Google Scholar]
- 21.Flores S. C., Keating K. S., Painter J., Morcos F., Nguyen K., Merritt E. A., Kuhn L. A., Gerstein M. B. (2008) Proteins 73,299–319 [DOI] [PubMed] [Google Scholar]
- 22.Brock M., Fan F., Mei F. C., Li S., Gessner C., Woods V. L., Jr., Cheng X. (2007) J. Biol. Chem. 282,32256–32263 [DOI] [PubMed] [Google Scholar]
- 23.Yu S., Fan F., Flores S. C., Mei F., Cheng X. (2006) Biochemistry 45,15318–15326 [DOI] [PMC free article] [PubMed] [Google Scholar]
- 24.Rehmann H., Arias-Palomo E., Hadders M. A., Schwede F., Llorca O., Bos J. L. (2008) Nature 455,124–127 [DOI] [PubMed] [Google Scholar]
- 25.DeLano W. L. (2002) The PyMOL Molecular Graphics System, DeLano Scientific LLC, Palo Alto, CA [Google Scholar]


