Abstract
We present a framework for hypothesis testing of differences between groups of DTI fiber tracts. An anatomical, tract-oriented coordinate system provides a basis for estimating the distribution of diffusion properties. The parametrization of sampled, smooth functions is normalized across a population using DTI atlas building. Functional data analysis, an extension of multivariate statistics to continuous functions is applied to the problem of hypothesis testing and discrimination. B-spline models of fractional anisotropy (FA) and Frobenius norm measures are analyzed jointly. Plots of the discrimination direction provide a clinical interpretation of the group differences. The methodology is tested on a pediatric study of subjects aged one and two years.
1 Introduction
The diffusion properties of white matter tracts measured by DTI provide a novel and important source of information for group comparison and regression in clinical neuroimaging studies. Significant challenges remain in the development of an automatic framework for testing significance of group differences in a manner which provides clinically relevant results. Previous work has shown the importance of modeling the diffusion properties of a fiber tract as functions sampled by arc length along the axis of the bundle [1,2]. The major challenge in applying this type of analysis is the need for a consistent parametrization of fiber bundles across a large population of images. Deformable registration has been proposed as a method of mapping a population to a reference atlas coordinate system [3,4,5]. Most of the analysis using atlas building has focused on independent voxelwise tests, which can be challenging to interpret and require sophisticated multiple comparison correction. Most studies have also analyzed fractional anisotropy (FA) or mean diffusivity (MD) values independently. We propose to combine the anatomically relevant coordinate system of tract statistics with the population coordinate system provided by atlas building. The combination of the tract coordinate system with atlas building provides an automated, clinically interpretable framework for understanding group differences. The closest related work has been done using nonlinear registration and projection onto a skeleton representation of FA [6]. Another proposed approach uses fiber clustering to compute correspondence across a population [7].
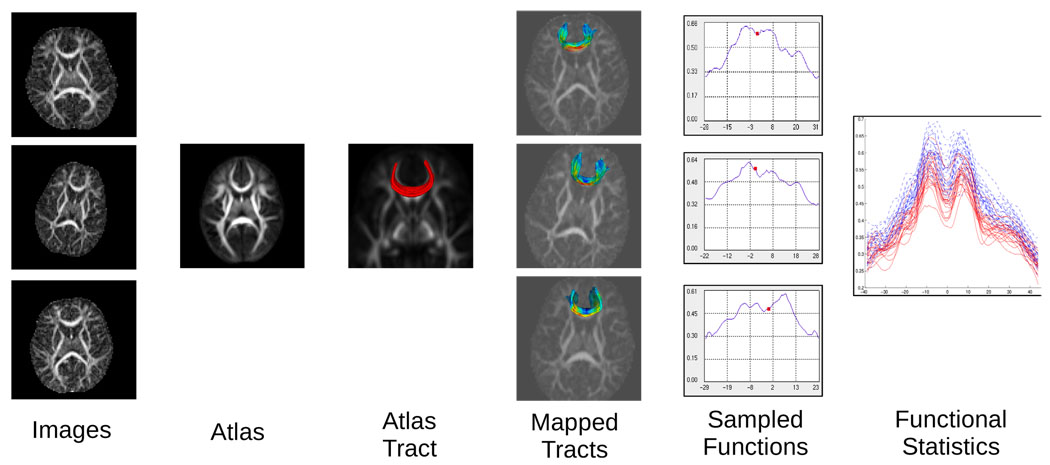
We use deformable registration to estimate and remove shape variability in a population of images. Analysis of shape normalized fiber bundles is performed in an anatomically relevant coordinate system based on fiber tractography. The atlas normalized diffusion measures are treated as a continuous smooth function of arc length, and statistical tests are applied for the joint analysis of the orthogonal FA and Frobenius norm measures. The framework provides a single multivariate hypothesis test between groups eliminating the need for multiple comparison correction and incorporating the joint information of tensor anisotropy and size. Visualization of the linear discriminant provides a clinically meaningful interpretation of the group differences as shown in an example study of pediatric images. Fig. 1 shows an overview of the analysis procedure.
Fig. 1.
Schematic overview of the tract analysis procedure
2 Atlas Parametrization and Fiber Extraction
Atlas building based on diffeomorphic registration estimates a set of transformations such that each image in the population can be mapped into the atlas coordinate system. In the DTI atlas building framework, each tensor image Ii is mapped into a common atlas space by a transformation Ti with inverse using appropriate measures to account for reorientation and interpolation of tensors. For the study presented here, the procedure of Goodlett et al. based on the atlas building procedure of Joshi et al. is applied [4,8]. In our framework, images from two groups are combined to produce a single pooled atlas. Our assumption is that the overall topology of the images in the two groups are similar enough to allow all images to be combined into one atlas, but differences may occur in the diffusion properties of fiber tracts. Thus, we use registration to normalize the image shapes and perform statistics on the diffusion properties of the normalized fiber bundles. The set of tensor images are averaged in atlas space to produce an atlas tensor image with improved signal-to-noise ratio (SNR). The average tensor volume allows reliable extraction of tracts even in populations of images with low SNR such as pediatric images. The diffeomorphic transforms guaranteed by the atlas building procedure allow atlas tracts to be mapped back into each individual subject.
Fiber tracts are extracted in the average tensor image using a standard Runge-Kutta streamline integration technique based on the principal eigenvector field. Source and target regions are manually developed to extract each bundle of interest. For each subject, the data within the fiber bundle is modeled as a sampled function of arc length using a method similar to that described in Corouge et al. [1]. The result of the procedure is a set of sampled functions parametrized by arc length tj ∈ [−a, b] from the atlas fiber tract. The atlas-normalized parametrization of the curves is possible because of the smooth, invertible nature of the transformations Ti, . That is the samples from each subject are obtained by FAi(Ti(tj)) for each sample point tj in the atlas tract. A sampled function is created for each tensor scalar measure such as fractional anisotropy, mean diffusivity (MD), Frobenius norm ∥D∥, etc. For the purpose of this work we chose FA and the Frobenius norm as orthogonal anisotropy and size measures respectively [9]. Fig. 2 shows the sampled curves extracted for the genu fiber bundle for our example study.
Fig. 2.
(a) Genu tract extracted from the tensor atlas colored by FA value. The diffusion values are sampled along the atlas-normalized arc length for each individual in the study for FA and Frobenius norm values. The sampled FA and Frobenius norm functions for the two groups are shown in (b) and (c) respectively. The one year old subjects are the dashed red lines and the two year old subjects are the solid blue lines. The spikes in the center of the Frobenius norm functions are likely partial voluming with the ventricles.
3 Functional Data Analysis
Image sampling as well as the fiber tract extraction process create a sampled representation of the fiber bundle diffusion properties. However, there exists a continuous underlying biology which generates these samples. Therefore, statistical analysis of the sampled diffusion functions must account for the underlying continuity and spatial correlation of the samples. We compute statistics of the diffusion curves as an infinite-dimensional extension to multivariate statistics known as functional data analysis [10]. The simplest extensions of ordinary statistics to the functional setting are the sample mean function f̄(t) and the sample variance-covariance function υ(s, t), which is the bivariate function given by
| (1) |
The diagonal of the function, υ(t, t), is the pointwise variance. Hypothesis testing and discriminant analysis of the space of functions has an inherent high dimension low sample size problem, because of the infinite dimensional space of continuous functions. Regularization methods are, therefore, essential in the computation of functional statistics. To enforce regularity, B-spline fitting and functional principal components analysis (PCA) is used for data driven smoothing where the number of retained PCA modes acts as a smoothing parameter.
In order to make computations tractable smooth basis functions are fit to the sampled diffusion curves. B-splines were selected as basis functions due to the nonperiodic nature of the data, the compact support of the B-spline basis, and the ability to enforce derivative continuity. A large number of B-spline bases are first fit to the sampled functions using a least squares approach. The number of basis functions is chosen subjectively to maintain local features while providing some smoothing. Computation of the mean function is computed by the sample mean of the B-spline coefficients. Computation of the variance-covariance function requires accounting for mapping between basis coefficients and function values. Let fi(t) be the B-spline function fit to the samples from subject i. In matrix notation we express all functions fi(t) as a matrix of coefficients C times the basis functions ϕ
| (2) |
Similarly, the variance-covariance function of f(t) can be written as
| (3) |
Principal component analysis (PCA) of the functions fi(t) decomposes υ(s, t) into the orthogonal unit eigenfunctions ξ(t) which satisfy
| (4) |
The B-Spline basis is not orthonormal resulting in a non-symmetric eigenvalue problem to solve (4). As shown in Ramsay and Silverman [10], this minimization can solved by the symmetric eigenvalue problem for the basis coefficients b, with the change of variable W1/2u = b as
| (5) |
where W is the matrix of basis function inner products with entries
| (6) |
In our analysis we consider jointly the analysis of FA and tensor norm functions with basis coefficients C1 and C2 respectively. We therefore compute PCA from the eigenanalysis of Σ, where
| (7) |
Hypothesis testing and discriminant analysis is performed on the projection into the first K PCA modes, where K serves as a smoothing parameter. Let xi and yi be the projection of the curves from the two population of functions fi(t) and gi(t) into the PCA space. In this space the basis mapping has already been incorporated and standard multivariate analysis can be applied. The normal parametric hypothesis test for mean differences is the Hotelling T2 statistic,
| (8) |
where S is the pooled covariance matrix. In order to relax the normality assumptions associated with the parametric test, we apply a permutation test based on the T2 statistic to compute the p-value.
The T2 statistic is proportional to the group mean differences projected on the Fisher linear discriminant (FLD),
| (9) |
The linear discriminant, therefore, provides a direction for interpreting the group differences. The coefficients of the discriminant can be expanded into the original function basis so that FLD(t) = ϕ(t)ω is a function whose inner product with the original data provides maximal separation between the groups.
4 Pediatric Data Application and Validation
We have tested the methodology on a study of pediatric DTI images. A population of 22 one year old subjects and 30 two year old subjects were chosen from a database of pediatric DTI. In this example we expected to find large differences between the two groups, and the purpose of this study is to illustrate the methodology rather than to determine clinical results. Each image was acquired with 2x2x2mm3 isotropic voxels, 10 repetitions of a six direction protocol, and a b-value of 1000s/mm2. We selected as representative fiber bundles the genu of the corpus callosum and the left motor tract. An atlas was computed from the combined set of 52 images, and tractography was performed to extract the two tracts.
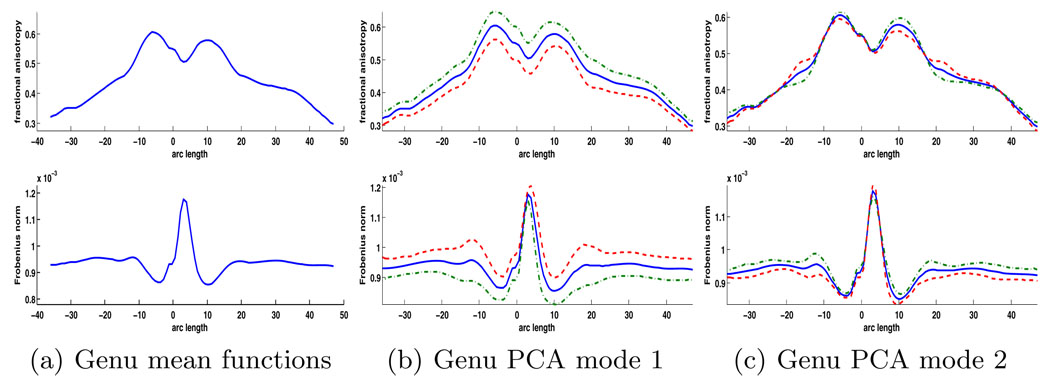
Sampled functions of FA and tensor norm parametrized by atlas-normalized arc length were computed in the genu and left motor tracts. For the genu curves, a B-spline basis with 60 basis functions was used to provide preliminary smoothing and smooth curve estimation. For the motor tract, 80 basis functions were used. Functional joint PCA of FA and Frobenius norm was then estimated for the whole population. The number of PCA modes was selected to retain 90% of the total variance. For this study 7 and 11 PCA modes were retained for the genu and motor tracts respectively. The mean function plus the first two principal modes for the genu tract are shown below in Fig. 3.
Fig. 3.
Visualization of the PCA modes for the joint analysis of FA and Frobenius norm in the genu tract. The (a) mean functions for the combined population are shown with (b) the first and (c) second PCA modes. The first PCA mode accounts for a large percentage of the variability and shows an overall constant change in FA and an anti-correlated constant change in norm.
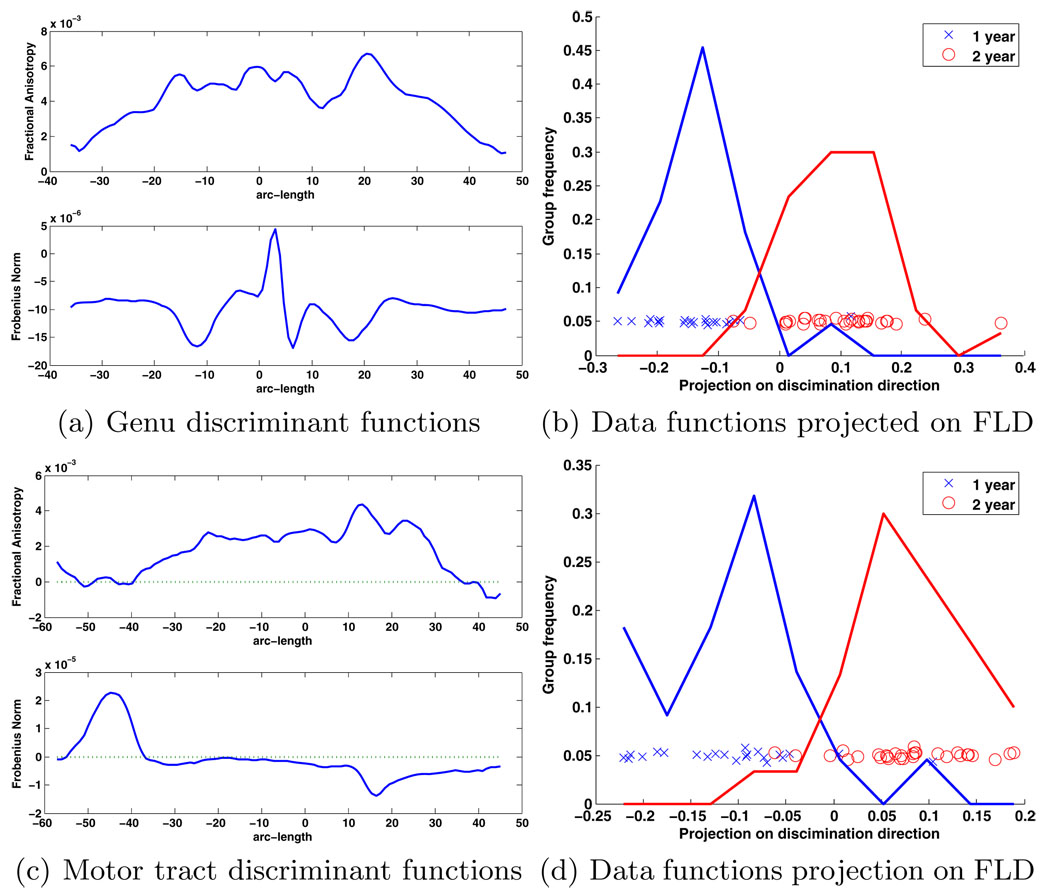
The Hotelling T2 statistic was then computed in PCA space. The genu tract test was extremely significant with a T2 statistic of 133.1 and parametric p-value of 3.3e-8. The motor tract was also extremely significant with T2 statistic of 93.8 and a parametric p-value of 2.7e-6. In this case there was such a large difference between groups that the permutation test did not result in any permutations with a statistic greater than the original. The p-values are uncommonly low because of the strong differences in the test data and the relatively large sample size. Visualization of the discriminant direction provides an interpretation of the detected differences and is shown in Fig. 4. The discriminant direction for the genu tract shows the difference from one to two year old groups is caused by an overall increase in FA and correlated decrease in Frobenius norm. Furthermore, the increased value of FA in the center of the tract indicates the central region of the tract provides more discriminative power between the two groups. These results are similar to differences which have been found between neonates and one year old subjects in the same tract [11]. The results in the motor tract indicate a similar constant increase in FA across the whole tract, and the Frobenius norm increases towards the inferior region of the tract, and decreases at a specific location in the superior region of the tract.
Fig. 4.
Linear discriminants from one to two years for the (a) genu and (c) left motor tracts expanded into original functional basis. These are the functions integrated with the original data that maximally separate the groups. In the genu tract the FA values increase from one to two years, and the Frobenius norm values decrease. For the motor tract, the results are similar for FA, but the norm increases at the base of the tract and decreases towards the top. The projection of the (b) genu and (d) motor tract curves onto the discrimination direction shows the strong separation between the groups.
5 Conclusions and Discussion
Computing fiber tract statistics as a function of arc length provides a sensitive mechanism for detecting and understanding changes in fiber tract properties between populations. Our framework avoids the problems of multiple comparison correction by providing a single nonparametric hypothesis test for each fiber bundle. Furthermore, the discrimination information contained within the hypothesis test can be visualized to provide a clinically relevant interpretation of the group differences. The framework presented here is closely related to previous work on shape analysis using PCA, and we intend to explore in more detail how tools from shape analysis can be applied to this problem. We are currently applying the methodology to a study of Schizophrenia in adults.
Footnotes
This work is part of the National Alliance for Medical Image Computing (NA-MIC), funded by the National Institutes of Health through Grant U54 EB005149 as well as support from the NIMH Silvio O. Conte Center Grant MH064065. Dr. Fletcher is partially funded through an Autism Speaks Mentor-Based Postdoctoral Fellowship.
References
- 1.Corouge I, Fletcher PT, Joshi S, Gouttard S, Gerig G. Fiber tract-oriented statistics for quantitative diffusion tensor MRI analysis. Medical Image Analysis. 2006;10(5):786–798. doi: 10.1016/j.media.2006.07.003. [DOI] [PubMed] [Google Scholar]
- 2.Fletcher PT, Tao R, Joeng WK, Whitaker R. A Volumetric Approach to Quantifying Region-to-Region White Matter Connectivity in Diffusion Tensor MRI. In: Karssemeijer N, Lelieveldt B, editors. IPMI 2007. LNCS. vol. 4584. Heidelberg: Springer; 2007. pp. 346–358. [DOI] [PubMed] [Google Scholar]
- 3.Peyrat JM, Sermesant M, Pennec X, Delingette H, Xu C, McVeigh E, Ayache N. A Computational Framework for the Statistical Analysis of Cardiac Diffusion Tensors: Application to a Small Database of Canine Hearts. IEEE Transactions on Medical Imaging. 2007;26(11):1500–1514. doi: 10.1109/TMI.2007.907286. [DOI] [PubMed] [Google Scholar]
- 4.Goodlett C, Davis B, Jean R, Gilmore J, Gerig G. Improved Correspondance for DTI population studies via unbiased atlas building. In: Larsen R, Nielsen M, Sporring J, editors. MICCAI 2006. LNCS. vol. 4191. Heidelberg: Springer; 2006. pp. 260–267. [DOI] [PubMed] [Google Scholar]
- 5.Zhang H, Yushkevich PA, Rueckert D, Gee JC. Unbiased white matter atlas construction using diffusion tensor images. In: Ayache N, Ourselin S, Maeder A, editors. MICCAI 2007, Part I. LNCS. vol. 4791. Heidelberg: Springer; 2007. pp. 211–218. [DOI] [PubMed] [Google Scholar]
- 6.Smith SM, Jenkinson M, Johansen-Berg H, Rueckert D, Nichols TE, Mackay CE, Watkins KE, Ciccarelli O, Cader MZ, Matthews PM, Behrens TE. Tract-based spatial statistics: Voxelwise analysis of multi-subject diffusion data. NeuroImage. 2006;31:1487–1505. doi: 10.1016/j.neuroimage.2006.02.024. [DOI] [PubMed] [Google Scholar]
- 7.O’Donnell L, Westin CF, Golby A. Tract-Based Morphometry. In: Ayache N, Ourselin S, Maeder A, editors. MICCAI 2007, Part II. LNCS. vol. 4792. Heidelberg: Springer; 2007. pp. 161–168. [Google Scholar]
- 8.Joshi S, Davis B, Jomier M, Gerig G. Unbiased diffeomorphic atlas construction for computational anatomy. NeuroImage. 2004;23 suppl. 1:S151–S160. doi: 10.1016/j.neuroimage.2004.07.068. [DOI] [PubMed] [Google Scholar]
- 9.Ennis DB, Kindlmann G. Orthogonal tensor invariants and the analysis of diffusion tensor magnetic resonance images. Magnetic Resonance in Medicine. 2006;55(1):136–146. doi: 10.1002/mrm.20741. [DOI] [PubMed] [Google Scholar]
- 10.Ramsay J, Silverman B. Functional Data Analysis. 2nd edn. Heidelberg: Springer; 2005. [Google Scholar]
- 11.Gilmore JH, Lin W, Corouge I, Vetsa YS, Smith JK, Kang C, Gu H, Hamer RA, Lieberman JA, Gerig G. Early Postnatal Development of Corpus Callosum and Corticospinal White Matter Assessed with Quantitative Tractography. American Journal of Neuroradiology. 2007;28(9):1789–1795. doi: 10.3174/ajnr.A0751. [DOI] [PMC free article] [PubMed] [Google Scholar]


