

Abstract
Mesoscopic simulations and electron microscopy of N-BAR domain-induced liposome remodeling are used to characterize the process of liposome tubulation and vesiculation. The overall process of membrane remodeling is found to involve complex couplings among the N-BAR protein density, the degree of N-BAR oligomerization, and the membrane density. A comparison of complex remodeled liposome structures from mesoscopic simulations with those measured by electron microscopy experiments suggests that the process of membrane remodeling can be described via an appropriate mesoscopic free energy framework. Liposome remodeling more representative of F-BAR domains is also presented within the mesoscopic simulation framework.
Introduction
The membrane remodeling capacity of the Bin/amphiphysin/Rvs (BAR) protein domain (1–11), a crescent-shaped homodimer with a number of highly conserved, positively charged residues on its concave surface, is believed to involve both the molecular structure (2,3) and charge distribution (4) of the BAR domain. This domain preferentially binds to regions of specific membrane curvature in negatively charged membranes and has been proposed to act as a curvature sensor in vivo (1,3). In vitro, N-BAR domains (a BAR domain plus an N-terminal amphipathic helix) can remodel liposomes into narrow tubules (3,5,8). Theoretical studies predict that N-terminal amphipathic helices alone can bend membranes (12), a result that had been previously shown by large-scale molecular dynamics (MD) simulations (10). Experimentally, however, there is still debate (13) on this issue.
It is possible that N-BAR domains sense curvature via density variations on the membrane surface (14), in that the N-terminal amphipathic helices seek out low-density regions of the outer bilayer leaflet, which facilitate partial helix insertion into the bilayer leaflet. Membrane bending is highly correlated with outer leaflet dilation, as well as inner leaflet compression, and thus the curvature sensing ability of N-BAR domains could be more of a result of helix insertion being facilitated by transient low density regions of the outer bilayer leaflet (e.g., from membrane undulations and other distortions).
Liposome remodeling has also been found to be dependent on the bulk concentration of N-BARs in the surrounding solvent (1), deforming liposomes into buds at low N-BAR concentrations, tubules at intermediate concentrations, and small vesicles at high concentrations (1). This result suggests that under some conditions liposome remodeling may involve the collective organization of many N-BAR proteins, similar to that observed in coarse-grained simulations of membrane remodeling by protein inclusions (15).
Tubulation of liposomes has also been observed with F-BAR domains (EFC Extended FCH) (5–7), where the tubulated structures can possess a structured F-BAR coat (6). However, the diameter of the F-BAR coated tubules was almost three times that observed with N-BARs. It was also observed that F-BARs can form small clusters on membrane surfaces, further indicating that a collective oligomerization (6) (i.e., the ensemble effect) is possible. F-BAR binding and remodeling occurs in two distinct stages where F-BAR oligomerization is required for tubulation to proceed. It is reasonable to propose that, at least under certain conditions, a similar mechanism may exist for N-BARs, where striations on tubules have been observed (8). To keep the terminology clear, from this point forward, the term “domain” will be dropped when referring to the BAR protein dimer; instead, only the term “BAR”, or “BARs”, will be used. When appropriate, the term BAR alone will refer to both N-BARs and F-BARs.
Electron microscopy (EM) is a valuable tool to investigate membrane remodeling processes on a molecular level (1–8,16), as EM is presently the only technique that can image membrane-binding proteins in their native environment. EM has helped to identify membrane-modulating domains of various proteins, e.g., dynamin (17) and the BAR-domain family proteins. These proteins sometimes assemble in a highly ordered fashion, causing liposomes to form membrane tubules. Frost et al. exploited this property to reconstruct cryo electron micrographs of the F-BAR domain of FBP 17 bound to the membrane bilayer (6). The F-BAR domain forms helical oligomers on the surface of membranes, which is a crucial ability for this domain to modulate membranes as discussed earlier. Impairment of the self-assembly through point mutations impairs tubule formation (6). Yet, it remains to be seen whether this property holds true for all BAR proteins or if it is different for each subfamily.
Explaining N-BAR remodeling from a theoretical viewpoint requires, at a minimum, incorporating the anisotropic nature of the BAR domain into the model. BARs will preferentially bend membranes along certain directions (9,10). The observed striations on tubules (8), along with results from MD and CG simulation (9,10,18), indicate that N-BARs bend membranes most strongly in a direction almost (but not quite) along the long axis of the BAR. When strongly oligomerized, entire mesoscopic regions of a membrane can be sculpted along a direction associated with the oligomer structure (11).
Theoretically, the problem of anisotropic inclusions in membranes has received relatively little attention (19–22). Distinct from isotropic membrane inclusions that can result in an isotropic spontaneous curvature, anisotropic inclusions couple to membrane curvature depending on their relative orientation to the membrane. This effect was first proposed by Fischer (19), and subsequent models were developed and analyzed (20–22). The resulting membrane model for anisotropic inclusions is different from the original Helfrich model (23), which was based on rotational invariance. The model for anisotropic inclusions contains both a mean and deviatoric contribution to the energy, and both must be considered. The deviatoric contribution is not a topological invariant as with the Gaussian modulus that appears in the Helfrich model (22) and, as such, the traditional Helfrich model cannot be applied directly.
We have developed a discrete mesoscopic quasiparticle approach, denoted the elastic membrane version 2 (EM2) model (24), that was originally designed to give a discrete representation of a Helfrich model for membrane bending (23) under certain deformations. The quasiparticles are not directly related to molecules, but are more abstracted objects having length scales at ∼5–10 nm. BAR remodeling phenomena can also be examined using EM2 (11), where explicit N-BARs interacting with the membrane surface are modeled via an additional spontaneous curvature which captures the average behavior of collections of N-BARs interacting with the membrane. We have further developed quasiparticle methodologies to model membrane composition superimposed on discrete membrane models (25,26), where the discrete membrane plays a dual role both in defining the surface of the membrane as well as acting as the computational template on which to evaluate the locally varying membrane composition using, for example, a Landau model for the composition (27,28). If a mesoscopic solvent is included (24), this approach can be further extended to model solute (e.g., BAR) density variations in the surrounding media.
In our previous work, the spontaneous curvature field arising from the locally averaged effect of the BAR domains on the membrane could be isotropic or anisotropic (11). The formulation with the anisotropic spontaneous curvature was able to locally bend a membrane along a specific direction depending on the directionality of the field, exactly as that studied theoretically (19–22). It was observed that vesiculation at high densities only occurred when the isotropic spontaneous curvature model was used (corresponding to isotropic arrangements of N-BARs), whereas tubulation required anisotropic spontaneous curvatures (corresponding to some degree of average alignment of N-BARs) (11). However, the requirement for two distinct models suggested that a further refinement of the approach was required to describe the full range of membrane remodeling with a single underlying model. The original work also imposed a constant N-BAR density on the bilayer, did not allow for a locally varying lipid composition, and the membrane bending modulus was taken to be constant.
A more refined mesoscopic model should allow for a spatially varying N-BAR density (reflecting local variations in N-BAR density in the solvent and on the membrane surface), as well as a spatially varying lipid composition. An important consequence of N-BAR binding is a preferred local coordinate frame on the membrane and the more refined model includes the effect of N-BARs both explicitly through the deviatoric contribution and implicitly by allowing the spontaneous curvature to depend on N-BAR density (11). This article will therefore examine N-BAR mediated liposome remodeling by combining our generalized EM2 membrane model (11) with a spatially varying N-BAR and membrane composition (25,26). Both N-BARs and the larger F-BARs will be considered. Importantly, a direct comparison with recent electron microscopy experiments will also be given. The next section will highlight the discrete mesoscopic model and provide details of the electron microscopy experiments. The simulation results, and a comparison with electron microscopy experiments, will then follow.
Methods
Discrete mesoscopic model
In our previous work (11,24–26), a continuum membrane model was subsequently discretized into quasiparticles to provide a more computationally flexible and efficient approach. Here, the discrete form will be used from the outset to highlight key components of the generalized anisotropic EM2 membrane model. It can be shown using a similar analysis as was previously used (24) that when the N-BAR density is constant on the membrane surface, the discrete EM2 model with an anisotropic spontaneous curvature maps over to the anisotropic inclusion model proposed in the literature (19–22). Specific mathematical details of the model are provided in the Appendices.
The full mesoscopic system consists of a discrete EM2 membrane consisting of N quasiparticles immersed in NS solvent quasiparticles. The total number of quasiparticles in the system is NB = NS + N. With the anisotropic spontaneous curvature model, each EM2 quasiparticle contains an in-plane nT vector that gives the local directionality of the spontaneous curvature, along with a membrane normal vector, Ω. Superimposed only on the EM2 membrane is an additional membrane composition variable, ϕM, that models the local net negative lipid charge density in the membrane. This component of the model is motivated by experimental evidence that the positively charged arch of the BAR interacts with negatively charged lipids (1,4) and thus incorporates the effect of, for example, protein-mediated lipid sequesterization (4,29–31) into the mesoscopic model. Other more complicated composition variables could, in principle, also be incorporated. The solvent is modeled with smooth particle applied mechanics (SPAM) (32–35), as previously done to model flagellar filaments (36). Superimposed on both the mesoscopic solvent and EM2 membrane is an additional N-BAR density variable ϕB, which describes local enhancements or depletions of N-BAR density in both the surrounding solvent and on the liposome surface.
The total free energy of the discrete N-BAR/membrane system is given by
| (1) |
where the discrete energy, H, originates from a continuum level free energy difference model, and thus each term in Eq. 1 can be related to a specific free energy component of the system. The physical significance of each term in Eq. 1 is summarized in Table 1 and discussed in the Appendices. Specific values of various coefficients that appear in each of the terms are given in Table S1 in the Supporting Material. Both ϕB and ϕM evolve as the membrane structure remodels, using a SPAM (32–35) discretized version of Landau-Ginzburg dynamics (25,26,37–39). As such, both HS and HM in Eq. 1 are discrete versions of Landau models for the N-BAR density (27,28) and membrane composition (25,26).
Table 1.
Physical description of the different terms in the mesoscopic model, Eq. 1
| Term | Free energy component contribution |
|---|---|
| HS | Free energy cost arising from a spatially varying BAR density, given by ϕB. |
| HEM2 | Elastic (i.e., quadratic) membrane bending free energy. |
| HM | Free energy cost of variations in the membrane lipid composition, given by ϕM. |
| HS,M | Free energy contribution arising from the coupling of the BAR density and membrane lipid composition (i.e., ϕB and ϕM, respectively). |
| HO | Explicit oligomerization free energy. Accounts for the possibility that BARs may oligomerize in the process of membrane tubulation and is motivated by the experimental observation of striations on amphiphysin N-BAR (8) and F-BAR tubules (6). |
A number of new features are also included in this model, and these are:
-
1.
The membrane bending modulus increases with increasing BAR density on the liposome surface as one would expect physically.
-
2.
The magnitude of the spontaneous curvature increases with BAR density.
-
3.
BAR binding on the membrane can occur via two different mechanisms, denoted as intrinsic curvature coupling (IC), and composition coupling (CC). IC causes N-BAR density to accumulate on the membrane in regions where the local curvature of the membrane matches the local anisotropic spontaneous curvature that is generated by the BAR density. This type of curvature coupling is related to differing interaction propensities for the N-BAR amphipathic helices with the membrane surface. Indeed, this curvature-sensing property can also be interpreted as density coupling (14) within the EM2 model. The bending energy of the EM2 membrane arises from the interaction between membrane normal vectors, Ω; however, this energy can also be generated via two effective membrane sheets separated by a membrane thickness, h (40,41), where, upon bending, the outer leaflet dilates, whereas the inner one compresses. Furthermore, it can be shown that changes in the local mean curvature in the EM2 membrane are proportional to inverse density changes in the effective outer leaflet of the membrane. This point is elaborated further in Appendix A. CC causes N-BAR density to accumulate in regions with a high negative lipid charge density, and is motivated by the concept of protein-induced electrostatic lipid sequestration (4,29–31). Combinations of IC and CC are also obviously possible. The type of coupling, either IC or CC, will determine the functional form used for HS,M; this is further discussed in Appendix B.
-
4.
The local spontaneous curvature is related to the bulk density of N-BARs through the spontaneous curvature magnitude, denoted C0. It has a maximum value of C0,α-BAR, α = N, F, which is the maximum possible membrane curvature for a specific (N or F) BAR/membrane system at the molecular scale. In the case where α = N, C0,N-BAR is found from MD simulations of single N-BAR remodeling (9,10). When α = F, C0,F-BAR is obtained in this article from experimental observations (5,7) but could also be obtained from MD simulations.
The general behavior of the present mesoscopic model can be demonstrated by examining the remodeling of a square patch of EM2 membrane. Fig. 1 a depicts a snapshot of an atomistically detailed, putative N-BAR oligomer structure that is similar to one proposed recently (18) but is of a larger lengthscale. The yellow arrow designates the direction of the anisotropic spontaneous curvature induced by the oligomerized N-BAR protein coat. Fig. 1 b demonstrates how the effect of the oligomerized protein is incorporated into the EM2 model. An initially flat square patch of EM2 membrane (with dimensions roughly 250 nm2) is prepared with a constant N-BAR density and membrane composition. A corresponding anisotropic spontaneous curvature field as in Fig. 1 a is superimposed and is also shown by the yellow arrows in Fig. 1 b-1. The lines on the membrane are the in-plane EM2 nT vectors that designate the local direction of the anisotropic spontaneous curvature (see Appendix A). If image in Fig. 1 a is overlaid onto Fig. 1 b-2, it can be seen that the EM2 nT vectors describe the average orientational arrangement of an array of well-aligned N-BARs on the membrane surface.
Figure 1.
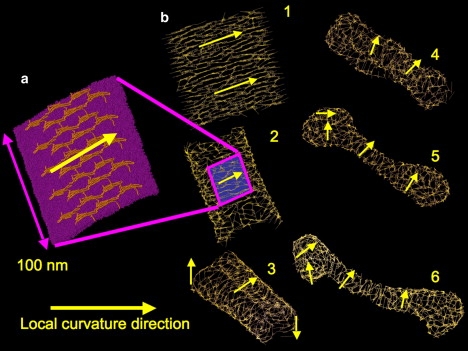
(a) Snapshot of a putative N-BAR oligomerization structure on an atomistic membrane. (b) Square slab of EM2 membrane, 250 nm2 in area, and is prepared with a constant N-BAR density and membrane composition. Panels b-1–6 follow the membrane through the remodeling process. The arrows designate the local spontaneous curvature directions; the intersecting lines show the local curvature directions on the EM2 membrane.
From the initial conditions Fig. 1 b-1, the membrane immediately begins to curl (Fig. 1 b-2) and rolls up (Fig. 1 b-3). In Fig. 1, b-4–b-6, the initially flat membrane remodels into a tubule, where the curvature fields wrap around the center of the tubule and are more isotropically arranged at the ends. The closed tubule ends are generated by an isotropic spontaneous curvature, which the EM2 model can generate via an isotropic arrangement of EM2 nT curvature field vectors.
Electron microscopy
Electron microscopy (EM) is an important experimental technique that can image remodeling membrane structures in vitro (1–8,16). The early reticulation stage of remodeling, where the liposome is initially perforated and tubulated, is examined and the resulting EM images are then compared with the outcomes of the mesoscopic simulation. It should be noted that at least in terms of the early reticulated structures, as long as the membrane composition was kept constant, very similar results were obtained whether endophilin or amphiphysin N-BARs were used. As such, results from both systems will be compared with the mesoscopic simulation results. Some experimental details are given below.
Protein purification
cDNA fragments encoding rat endophilin A1 (1-247) and rat amphiphysin (1-247) were subcloned into pGEX6P-1 (Amersham Biosciences, Piscataway, NJ) via polymerase chain reaction. Fusion proteins were bacterially expressed and purified first on a GST-glutathione affinity column. The GST tag was cleaved, followed by gel filtration chromatography in buffer. Aliquots of 5 mg/mL (endophilin NBAR) protein and 2 mg/mL (amphiphysin 1 N-BAR) were stored at −80°C.
Liposome preparation and tubulation in vitro
For all experiments, synthetic lipids were used (Avanti, Alabaster, AL). For the tubulation experiments, two lipid mixtures (w/w) were prepared: 80% DOPS, 20% DOPC (endophilin N-BAR) and 75% DOPS, 25% DOPE, 5% Cholesterol (amphiphysin N-BAR). These mixtures were dried under a stream of argon with gentle vortexing in glass vials, redissolved in absolute hexane, dried with argon again, and desiccated under high-vacuum for 1 h. Lipids were then hydrated with buffer (50 mM K-glutamate,10 mM Tris/HCl 1 mM EGTA, pH 7.5) and sonicated and used immediately or stored in aliquots at −80°C. Liposomes (0.1–0.25 mg/mL) were equilibrated at room temperature before adding the protein at a lipid/protein ratio (w/w) of 1.4:1 (endophilin N-BAR) or 1:1 (amphiphysin N-BAR).
Electron microscopy imaging
The tubulation reaction was screened using 1% uranyl acetate-stained samples and a Tecnai 12 microscope (Philips, FEI, Eindhoven, The Netherlands) operating at 120 kV.
Results and Discussion
Tubulation and vesiculation in N-BAR mediated membrane remodeling
Experimentally it is observed that N-BARs can tubulate liposomes at low/moderate N-BAR concentration, whereas vesiculation is observed at high concentration (1). A series of 200 ns in duration mesoscopic simulations were performed at 308 K on a 250-nm-diameter EM2 liposome to examine this behavior (keeping in mind that the coarse-grained simulation timescales reported here correlate with much larger physical timescales). A snapshot of the initial liposome is given in Fig. S1 in the Supporting Material. The observed behavior over a range of spontaneous curvature magnitudes, C0, as well as IC and CC coupling strengths was examined.
Fig. 2 a shows liposome tubulation and vesiculation with IC. Recall that IC states that BAR domains bind onto regions of the membrane with a specifically lowered effective outer membrane leaflet density. Images 1–4 show that the tubulation behavior in the IC model transitions over to vesiculated structures at the highest value of C0. The average tubule diameters from the simulation in images 2 and 3 are at ∼25–33 nm, which agrees well with experimental findings (1,6).
Figure 2.
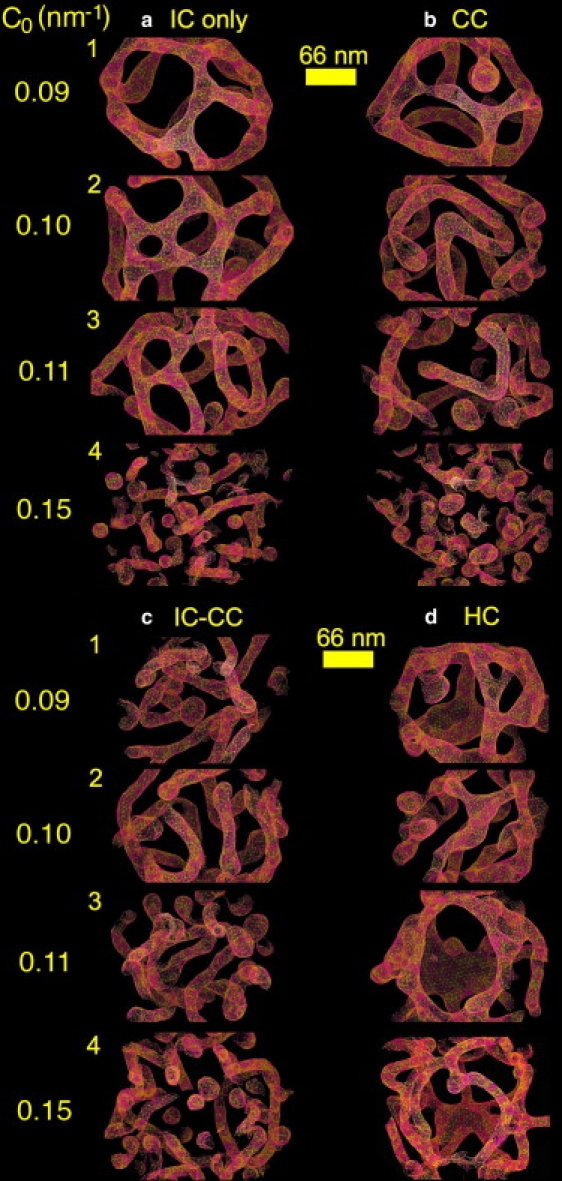
Tubulation and vesiculation of an EM2 liposome. The N-BAR spontaneous curvature magnitude is given in the far left column, starting from C0 = 0.09 nm−1, then C0 = 0.10 nm−1, C0 = 0.11 nm−1, and C0 = 0.15 nm−1. Panel a employs IC, panel b employs CC, panel c uses a combined 50:50 superposition of IC and CC, and panel d is for HC.
Fig. 2 b shows the final structures obtained from pure CC whereas Fig. 2 c gives results for a combined IC-CC, which was obtained by summing and averaging Eqs. 6 and 8. Recall that CC is electrostatically motivated, i.e., N-BARs bind onto regions of the membrane with enhanced negative charge.
A standard mean curvature coupling model (denoted HC) (25,26) was also explored and the results are shown in Fig. 2 d. With HC, N-BAR density was drawn to regions of the membrane with higher mean curvatures, regardless of the ideal intrinsic curvature for a particular N-BAR system.
Pure CC resulted in tubulation over a range of coupling strengths (i.e., as shown by images 1–3 in Fig. 2 b). When IC and CC were combined (Fig. 2 c), the resulting structures exhibited both interconnected motifs, single tubules, and some vesiculated structures. The tubulated structures under HC are shown in Fig. 2 d, and tend to exhibit octopus-like structures, with tentacles emanating from bodies that correspond to regions of low curvature acting as connecting or bridging regions of high curvature. By comparing with experimental EM images as is done in the next section, it becomes possible to better determine which of these membrane-remodeling mechanisms is likely to be most important.
N-BAR tubulation: mesoscopic simulation and electron microscopy
A comparison between remodeled structures obtained from mesoscopic simulations of an initial 500-nm-diameter liposome (under IC and with C0 = 0.08 nm−1) with electron micrographs was carried out. In addition to IC, the effect of the explicit oligomerization energy, HO, with an interaction strength, ΛO, was explored. Again, the explicit oligomerization energy models the direct oligomerization of N-BARs via their N-terminal helices, and is motivated by the observation of distinct striations on tubule structures (6,8).
In Fig. 3, the blue and white images are depicted at the same length scale as the electron micrographs, whereas the smaller pink/amber images are shown at a smaller length scale to save space. Fig. 3 a shows a weak-reticular remodeled liposome that was obtained with ΛO = 0. Strongly tubulated regions exhibit a distinct striation pattern from the EM2 curvature fields, suggesting a highly ordered and dense region of N-BARs. When correlated with the low effective outer leaflet membrane density as shown in the corresponding pink region of the smaller liposome image on the left, the overall picture is one where highly ordered, high density NBAR striations are coupled with low density regions of the outer membrane leaflet. The electron micrograph in Fig. 3 a shows a similar structure, where the striated tubules are bridged by less ordered regions.
Figure 3.
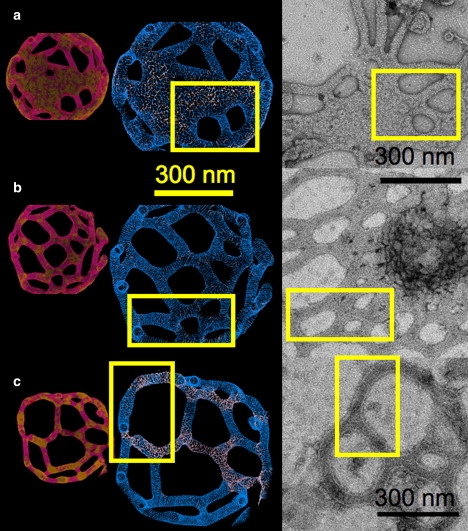
A comparison of structures obtained from simulation (left panel) and experimental electron micrographs (right panel). The boxes select out similar structural motifs found in both the simulations and experiment. Density variations in the effective outer leaflet of the EM2 membrane are shown in the smaller images (pink/amber online); where the pink regions have a lower outer bilayer leaflet lipid density. The N-BAR oligomerization fields as given by the EM2 nT vectors are shown in the larger images (blue-white online); darker regions have a relatively larger N-BAR density. In panels a–c, IC was used and the oligomerization strength, ΛO, was varied as in Eq. 11. Image c was obtained by removing the mesoscopic solvent after 200 ns of mesoscopic simulation and continuing the simulation in a solvent-free mode. The electron micrographs in panels a and b correspond to endophilin whereas panel c is amphiphysin N-BARs. Virtually indistinguishable tubule diameters were found for both systems.
When the oligomerization energy was increased to ΛO = 5 amu (nm/ps)2 (∼2 kBT), a more ordered and tubulated structure was obtained in Fig. 3 b. The reticular structures shown in the yellow box in the simulation result and in the electron micrograph are surprisingly similar in terms of both tubule diameter and the structure of the holes. The simulation results suggest that the N-BAR oligomerization is also highly correlated with the N-BAR and membrane outer leaflet density.
The final image in Fig. 3 c shows results for a solvent-free tubulation simulation with ΛO = 10 amu (nm/ps)2 that was simulated for >2000 ns. The solvent-free simulation used the adsorbed N-BAR density found from a fully solvated 200-ns simulation to save computer time. The membrane composition, however, continued to evolve on the membrane surface in this simulation. The slow annealing of the reticular structures, seen in the images in Fig. 3, a and b, indicates that with even longer simulations this system could tubulate into distinct strands. Both low and high N-BAR density regimes are still observed, and the oligomerization pattern is highly correlated with the membrane outer leaflet density. The low-density N-BAR regions seem to exist where the tubules unfold into a more open structure. A strikingly similar behavior is observed in the experimental EM images.
The overall combination of the mesoscopic simulation and experimental EM images suggests that the degree of N-BAR oligomerization, as well as the annealing of the tubulation process, can result in a wide array of remodeled structures. It should be noted that the electron micrograph in Fig. 3 c was obtained with amphiphysin N-BAR domains, whereas the others were obtained with endophilin N-BAR domains. The reticulated and webbed EM results exhibit morphologies that are typical of those observed under various experimental conditions and are representative of liposomes at different stages of remodeling. They also clearly mirror the simulation results under similar conditions. Experimentally, conditions that result in the reticulated structures for both systems are quite similar (e.g., the lipid/protein ratio (w/w) is 1.4:1 for the endophilin N-BAR vs. 1:1 for the amphiphysin N-BAR). The present EM2 model with a spatially varying N-BAR composition cannot, however, readily detect the small differences in amphiphysin and endophilin remodeling, so a more refined approach that can incorporate finer oligomerization features and BAR binding details will be a target of future research.
Mesoscopic simulation of F-BARS
F-BARs can remodel membranes into large tubules with diameters in the range of 57–85 nm in vitro, almost three times that of N-BARs (5,6). In contrast to N-BARs, distinct membrane binding and remodeling stages are observed, where F-BARs oligomerize into a highly ordered protein coat around the membrane (6). This result suggests that an additional underlying coupling may be present.
As before, the key parameter in the mesoscopic model is the spontaneous curvature magnitude, C0, based here on experimental observations of the curvature of a single F-BAR (5,7) along with the tightly packed F-BAR oligomer coats recently observed (6). Values in the range of C0 ≈ 0.034 nm−1 were used, corresponding to the spontaneous curvature magnitude generated by a tightly packed coat of F-BARs on the liposome surface.
Several values of the parameters C0 and ΛO were tested under various IC and CC coupling strengths. Strong liposome tubulation was not observed until the oligomerization strength was sufficient. Fig. 4 shows the end result of a final solvent-free simulation of an F-BAR coated liposome with an initial diameter of 500 nm (following the same protocol that was previously used). The average diameter of the tubulated structure was at ∼69 nm, in agreement with the range of experimentally measured tubule diameters (6).
Figure 4.
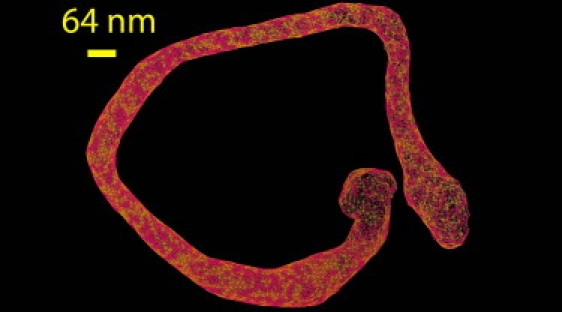
Final F-BAR tubulation structure from the EM2 model based on Eqs. 1 and 11, with parameters chosen for F-BARs. An initial 500-nm-diameter liposome was used.
It should be noted that in the absence of the oligomerization energy in Eq. 11, the tubulation process was drastically inhibited. N-BARs generate a strong anisotropic spontaneous local curvature that can, by itself, indirectly facilitate the recruitment of additional N-BAR density to generate tubulation. However, the F-BARs, due to their larger size and much smaller intrinsic curvature, require an additional energetic contribution in the form of an oligomerization energy in order for tubulation to proceed, in agreement with experimental observations (6).
Summary and Conclusions
Membrane remodeling is driven by the coupling between the N-BAR density, oligomerization, and membrane curvature (density). When all the components can interact, both tubulation and vesiculation can be observed. At a moderate N-BAR density, organized domains of highly ordered N-BARs can develop on the liposome surface and then tubulate in a coordinated fashion, where regions with low N-BAR density can act as remodeling buffer zones. At high N-BAR densities, the domains remodel before they can organize; the liposome is vesiculated, and the resulting structures stabilize as best they can.
A comparison with experimental EM images indicates that certain forms of the EM2 model can reasonably describe at least the early stages of remodeling (i.e., reticular structures). The inclusion of an explicit oligomerization energy, motivated by the observation of higher order organization visualized by distinct striations on real tubules, further captures some of the observed structural motifs found in the electron micrographs.
This mesoscopic model was also extended to examine membrane remodeling by other BARs, namely F-BARs. It was found that an additional oligomerization energy was required to enable remodeling in this case, supporting the idea that with F-BARs, distinct binding and remodeling mechanisms exist.
Acknowledgments
We thank Prof. Will Noid of Penn State for valuable discussions and assistance.
Computational resources were provided by the National Science Foundation through TeraGrid computing resources, specifically the Texas Advanced Computing Center and the National Institute for Computational Sciences. This research was supported in part by the National Institutes of Health (grant No. R01-GM063796 to G.A.V. and grant No. R21-DA024101 to V.M.U.). C.M. was supported by the Deutsche Forschungsgemeinschaft (postdoctoral grant No. MI 1339/1-1).
Appendix A: Discrete EM2 Model Membrane
A more complete description of the EM2 model can be found elsewhere (11,24); here some important points are highlighted. The EM2 membrane consists of pairwise interacting EM2 quasiparticles separated by a distance rij = |rij| = |ri-rj| as shown graphically in Fig. S2, a and b. Each quasiparticle has two unit vectors—a membrane normal vector, Ωα, and an orthogonal in-plane vector, , α = i, j. The small angle between the two normal vectors is Ωi • Ωj = cos(δθij). The energy of the EM2 membrane composed of N quasiparticles relative to a flat reference state is given by
| (2) |
where the pair interaction between quasiparticles, Δuij, is given by
| (3) |
The forms of Eqs. 2 and 3 are the same as was previously used (11) except that here the bending modulus kc of the membrane, as well as the anisotropic spontaneous curvature between i and j, C0,ij, is dependent on the local N-BAR density for the pair of quasiparticles, ϕB,i, ϕB,j (see Appendix B). In Eq. 3, ρA is the initial area density of the membrane and in practice, Nc,i, is the average number of j quasiparticles found about an i quasiparticle within the cutoff radius, rc. Referring to Fig. S2 a, , is the local curvature between the pair and δρij−1 is the local pair density change of the effective outer leaflet of the EM2 membrane. The spontaneous curvature between the pair of EM2 quasiparticles, C0,ij, depends not only on the local N-BAR density, but also on the local in-plane vectors . The functional form for this interaction was previously given in Ayton et al. (11) and is also given in Eq. 4 in the next Appendix.
Appendix B: Coupling Bar Density with Membrane Composition
The behavior of the composition variables is the following: The BAR density field variable ϕB has a value ϕB ≈ −1 in regions with the highest BAR density relative to the bulk density and ϕB ≈ 1 at the lowest. The BAR density is explicitly included in both the discrete solvent as well as on the EM2 membrane surface. Likewise, the membrane composition has ϕM ≈ −1 in regions with an enhanced negative lipid charge density relative to the average charge density over the membrane surface. Several important features of the model are as follows:
Increased N-BAR density on the liposome surface may enhance the rigidity of the membrane
This effect is included by modulating the bending modulus, kc, of the membrane with the BAR density. The following model is proposed: with ϕB = 1/2(ϕB,i+ϕB,j), and ϕB,i, ϕB,j defined in Appendix A, the bending modulus is kc(ϕB) = kc,0 - ηkc,0 ϕB, where kc,0 is the bending modulus of a pure membrane (10 kBT was used and is reasonable for most DOPS/DOPC lipid-containing membranes) and η was given a value of 0.5–2 for ϕB < 0 and was zero otherwise. Note that since ϕB < 0 corresponds to an increase in N-BAR density, the bending modulus increases as more N-BAR density is accumulated, as would be expected. The assumption that the overall bending modulus is larger originates from the intrinsic stiffness of the BAR protein and the fact that the structure of the membrane is not compromised upon binding; however, there could be scenarios for other proteins where the bending modulus could become less (e.g., protein-induced membrane lysis). The bending modulus was assumed to not be altered by variations in the lipid composition ϕM, although in principle it could be. The underlying lipid mixture here is thought to mirror that typically used in experiment (1,4,6,31,42), and in that case, it is not clear how relatively small local variations in the negative lipid density would alter the bending modulus.
Increased local N-BAR density may increase the local spontaneous curvature
The spontaneous curvature will locally increase if the local density of N-BARs is enhanced. The spontaneous curvature between a pair of EM2 quasiparticles i and j is thus expressed as
| (4) |
where accounts for local increases in N-BAR density due to N-BAR binding on the liposome and is chosen to be
| (5) |
It was found that systems with strongly bound BAR densities had ϕB ∼ −1 with little or no density for ϕB > 0 and thus the behavior of for ϕB > 0 was not overly important. This particular model biases the strength of the spontaneous curvature to regions with relatively high BAR density; other similar forms (e.g., ) were explored but had no observable effect on the membrane remodeling. The final term in Eq. 4 was that used in Ayton et al. (11).
N-BAR binding on the membrane can occur via two different mechanisms and accounts for the HS,M contribution to the free energy in Eq. 1
The IC model is given by
| (6) |
where the average square of the curvature difference about a single EM2 quasiparticle is and is expressed as
| (7) |
In Eq. 6, is a positive coupling constant that attracts N-BAR density uniformly over the membrane (values in the range of 0.05–0.1 kBT were used). It is electrostatic in origin, as the liposome surface has a net negative charge density, whereas the underside of the arch of the BAR is positive. The next coupling term, , is related to the BAR composition dependence of the bending modulus, i.e., (values at ∼2.5–5 amu nm4 ps−2 were used). The important point is that the relative strength of over will determine whether or not N-BAR density will locally accumulate in some region on the liposome surface. The values used in the simulations were such that N-BAR density would accumulate in some regions of the membrane surface, but not others when combined with the other interactions in Eq. 1. This particular coupling will be the strongest when , that is, when the local membrane curvature matches that of the anisotropic spontaneous curvature generated by the BAR domain density. It can also be interpreted as being the strongest when the effective outer membrane leaflet density has decreased to match that desired by the BAR density, e.g., via N-terminal amphipathic helix insertion.
The physical motivation behind the mathematical form for IC in Eq. 6 can be understood as follows: The term (which is a free energy) will be minimized when 1), a high N-BAR density is present (ϕB ∼ −1); and 2), is as small as possible, which occurs when the membrane curvature matches the local anisotropic spontaneous curvature.
The CC model is given by
| (8) |
where
| (9) |
and ζ0 is a constant and values of ΛM in the range of 0.05–0.10 amu (nm/ps)2 were sufficient to induce N-BAR density accumulation on the liposome surface. The physical motivation for Eq. 8 is that the N-BAR density couples to the bilayer composition such that regions with an enhanced N-BAR density (i.e., with ϕB ≈ −1 and therefore a correspondingly large positive charge density) are drawn to regions with an enhanced negative charge density (i.e., with ϕM ≈ −1), regardless of the local curvature.
Appendix C: Spatially Varying Bar Density and Membrane Composition
The discrete forms of HS and HM in Eq. 1 are given by
| (10) |
The corresponding continuum expressions can be easily found using standard techniques (24,26). The free energies associated with the spatially varying BAR density and membrane composition, ϕB and ϕM, are described by Landau models (25–28,39,43–45) (i.e., a phenomenological free energy model of the system containing an effective energy functional that is expressed in terms of an order parameter, ϕ, where local fluctuations in ϕ are allowed according to their statistical weight. Physically, this type of approach can describe local mesoscopic length scale variations in both the N-BAR and lipid composition). In the case of the BAR density, an adsorption model mirroring that proposed by Widom as given in Peliti and Leibler (28) was used (although other models could be incorporated). The membrane composition model was that previously used in Ayton et al. (26) and follows from previous work (25,43), with the exception that here a single well potential is used; with m = 10 and aM = aB = 0.001 amu (nm/ps)2 (other values of aM and aB were also tested). The motivation for this form draws from the highly miscible lipid mixtures used in experiment (1,6); other powers, e.g., with m = 6–12, were also tested. The exact power and value of aM are not overly important at this stage, as it models the distribution of negatively charged species in a highly miscible mixture; a similar situation applies for aB. The membrane composition component is only resolved on the surface of the membrane, as was done in our previous work (25,26). As such, the membrane is modeled as an undulating thin surface immersed in a solvent. It should be noted that a chemical potential model could also capture the N-BAR density adsorption, and the solvent-free approach used in some of the simulations here follows from this idea. Our choice to include an explicit surrounding mesoscopic solvent allows for future studies of the behavior of the N-BAR density in close proximity to the liposome surface.
The SPAM (32–35) discretized version of Landau-Ginzburg dynamics (37–39) was that previously developed in our group (25,26). Analytic solutions for Landau-Ginzburg dynamical models have a long history (see, e.g., (45–47) for some notable examples). However, the aim of this work is not to seek an analytic solution for the model, but rather to employ a discrete approach that can readily be applied to give an efficient and flexible numerical solution over a broad range of conditions that can also be compared to experimental EM results. It should be noted that the time evolution of the mesoscopic system is highly accelerated and can possibly even explore different pathways, etc., compared to atomistic systems.
Appendix D: Oligomerization Energy
The oligomerization energy, HO in Eq. 1 models scenarios where the BAR domains oligomerize on the liposome surface. The following minimalist model is thus proposed:
| (11) |
Here ΛO is the coupling coefficient, with values of zero (i.e., no oligomerization energy) to 5–15 amu (nm/ps)2. The function fO (ϕB,i, ϕB,j) models the BAR density composition dependence. Taking clues from the experiments in Frost et al. (6), the following functional form is proposed:
| (12) |
The oligomerization energy component is also assumed to only be active above a critical BAR density on the liposome. The next term, , models the oligomerization process, where ν is an integer (ν = 2 was used here and reflects the symmetry of a single BAR). Physically, the mathematical form of Eq. 11 models the oligomerization process in that HO is minimized when fO = −1 and when is large. This situation occurs when there is a locally high density of BARs on the liposome surface and when, on average, the BARs are highly aligned.
Supporting Material
References
- 1.Peter B.J., Kent H.M., Mills I.G., Vallis Y., Butler P.J.G. BAR domains as sensors of membrane curvature: the amphiphysin BAR structure. Science. 2004;303:495–499. doi: 10.1126/science.1092586. [DOI] [PubMed] [Google Scholar]
- 2.Masuda M., Takeda S., Sone M., Ohki T., Mori H. Endophilin BAR domain drives membrane curvature by two newly identified structure-based mechanisms. EMBO J. 2006;25:2889–2897. doi: 10.1038/sj.emboj.7601176. [DOI] [PMC free article] [PubMed] [Google Scholar]
- 3.Gallop J.L., McMahon H.T. BAR domains and membrane curvature: bringing your curves to the BAR. Biochem. Soc. Symp. 2005;72:223–231. doi: 10.1042/bss0720223. [DOI] [PubMed] [Google Scholar]
- 4.Zimmerberg J., McLaughlin S. Membrane curvature: how BAR domains bend bilayers. Curr. Biol. 2004;14:R250–R252. doi: 10.1016/j.cub.2004.02.060. [DOI] [PubMed] [Google Scholar]
- 5.Futterer K., Machesky L.M. “Wunder” F-BAR domains: going from pits to vesicles. Cell. 2007;129:655–657. doi: 10.1016/j.cell.2007.05.006. [DOI] [PubMed] [Google Scholar]
- 6.Frost A., Perera R., Roux A., Spasov K., Destaing O. Structural basis of membrane invagination by F-BAR domains. Cell. 2008;132:807–817. doi: 10.1016/j.cell.2007.12.041. [DOI] [PMC free article] [PubMed] [Google Scholar]
- 7.Shimada A., Niwa H., Tsujita K., Suetsugu S., Nitta K. Curved EFC/F-BAR-domain dimers are joined end to end into a filament for membrane invagination in endocytosis. Cell. 2007;129:761–772. doi: 10.1016/j.cell.2007.03.040. [DOI] [PubMed] [Google Scholar]
- 8.Takei K., Slepnev V.I., Haucke V., De Camilli P. Functional partnership between amphiphysin and dynamin in clathrin-mediated endocytosis. Nat. Cell Biol. 1999;1:33–39. doi: 10.1038/9004. [DOI] [PubMed] [Google Scholar]
- 9.Blood P.D., Voth G.A. Direct observation of Bin/amphiphysin/Rvs (BAR) domain-induced membrane curvature by means of molecular dynamics simulations. Proc. Natl. Acad. Sci. USA. 2006;103:15068–15072. doi: 10.1073/pnas.0603917103. [DOI] [PMC free article] [PubMed] [Google Scholar]
- 10.Blood P.D., Swenson R.D., Voth G.A. Factors influencing local membrane curvature induction by N-BAR domains as revealed by molecular dynamics simulations. Biophys. J. 2008;95:1866–1876. doi: 10.1529/biophysj.107.121160. [DOI] [PMC free article] [PubMed] [Google Scholar]
- 11.Ayton G.S., Blood P.D., Voth G.A. Membrane remodeling from N-BAR domain interactions: insights from multiscale simulation. Biophys. J. 2007;92:3595–3602. doi: 10.1529/biophysj.106.101709. [DOI] [PMC free article] [PubMed] [Google Scholar]
- 12.Campelo F., McMahon H.T., Kozlov M.M. The hydrophobic insertion mechanism of membrane curvature generation by proteins. Biophys. J. 2008;95:2325–2339. doi: 10.1529/biophysj.108.133173. [DOI] [PMC free article] [PubMed] [Google Scholar]
- 13.Fernandes F., Loura L.M.S., Chichon F.J., Carrascosa J.L., Fedorov A. Role of helix 0 of the N-BAR domain in membrane curvature generation. Biophys. J. 2008;94:3065–3073. doi: 10.1529/biophysj.107.113118. [DOI] [PMC free article] [PubMed] [Google Scholar]
- 14.Ayton G.A., Lyman E., Voth G.A. Hierarchical coarse-graining strategy for protein-membrane systems to access mesoscopic scales. Faraday Trans. 2009 doi: 10.1039/b901996k. In press. [DOI] [PMC free article] [PubMed] [Google Scholar]
- 15.Reynwar B.J., Illya G., Harmandaris V.A., Muller M.M., Kremer K. Aggregation and vesiculation of membrane proteins by curvature-mediated interactions. Nature. 2007;447:461–464. doi: 10.1038/nature05840. [DOI] [PubMed] [Google Scholar]
- 16.Martens S., Kozlov M.M., McMahon H.T. How synaptotagmin promotes membrane fusion. Science. 2007;316:1205–1208. doi: 10.1126/science.1142614. [DOI] [PubMed] [Google Scholar]
- 17.Mears J.A., Ray P., Hinshaw J.E. A corkscrew model for dynamin constriction. Structure. 2007;15:1190–1202. doi: 10.1016/j.str.2007.08.012. [DOI] [PMC free article] [PubMed] [Google Scholar]
- 18.Arkhipov A., Yin Y., Schulten K. Four-scale description of membrane sculpting by BAR domains. Biophys. J. 2008;95:2806–2821. doi: 10.1529/biophysj.108.132563. [DOI] [PMC free article] [PubMed] [Google Scholar]
- 19.Fischer T.M. Bending stiffness of lipid bilayers. III. Gaussian curvature. J. Phys. II (Fr.) 1992;2:337–343. [Google Scholar]
- 20.Kralj-Iglic V., Iglic A., Hagerstrand H., Peterlin P. Stable tubular microexovesicles of the erythrocyte membrane induced by dimeric amphiphiles. Phys. Rev. E Stat. Phys. Plasmas Fluids Relat. Interdiscip. Topics. 2000;61:4230–4234. doi: 10.1103/physreve.61.4230. [DOI] [PubMed] [Google Scholar]
- 21.Iglic A., Babnik B., Bohinc K., Fosnaric M., Hagerstrand H. On the role of anisotropy of membrane constituents in formation of a membrane neck during budding of a multicomponent membrane. J. Biomech. 2007;40:579–585. doi: 10.1016/j.jbiomech.2006.02.006. [DOI] [PubMed] [Google Scholar]
- 22.Fournier J.B. Nontopological saddle-splay a curvature instabilities from anisotropic membrane inclusions. Phys. Rev. Lett. 1996;76:4436–4439. doi: 10.1103/PhysRevLett.76.4436. [DOI] [PubMed] [Google Scholar]
- 23.Helfrich W. Elastic properties of lipid bilayers: theory and possible experiments. Z. Naturforsch. 1973;28(c):693–703. doi: 10.1515/znc-1973-11-1209. [DOI] [PubMed] [Google Scholar]
- 24.Ayton G.S., McWhirter J.L., Voth G.A. A second generation mesoscopic lipid bilayer model: connections to field-theory descriptions of membranes and nonlocal hydrodynamics. J. Chem. Phys. 2006;124:064906. doi: 10.1063/1.2165194. [DOI] [PubMed] [Google Scholar]
- 25.McWhirter J.L., Ayton G.S., Voth G.A. Coupling field theory with mesoscopic dynamical simulations of multi-component lipid bilayers. Biophys. J. 2004;87:3242–3263. doi: 10.1529/biophysj.104.045716. [DOI] [PMC free article] [PubMed] [Google Scholar]
- 26.Ayton G.S., McWhirter J.L., McMurtry P., Voth G.A. Coupling field theory with continuum mechanics: a simulation of domain formation in giant unilamellar vesicles. Biophys. J. 2005;88:3855–3869. doi: 10.1529/biophysj.105.059436. [DOI] [PMC free article] [PubMed] [Google Scholar]
- 27.Laradji M. Polymer adsorption on fluctuating surfaces. Europhys. Lett. 1999;47:694–700. [Google Scholar]
- 28.Peliti L., Leibler S. Strong adsorption in critical binary mixtures. J. Phys. Chem. 1983;16:2635–2640. [Google Scholar]
- 29.McLaughlin S., Murray D. Plasma membrane phosphoinositide organization by protein electrostatics. Nature. 2005;438:605–611. doi: 10.1038/nature04398. [DOI] [PubMed] [Google Scholar]
- 30.Gamper N., Shapiro M.S. Target-specific PIP2 signaling: how might it work? J. Physiol. 2007;582:967–975. doi: 10.1113/jphysiol.2007.132787. [DOI] [PMC free article] [PubMed] [Google Scholar]
- 31.McLaughlin S., Wang J., Gambhir A., Murray D. PIP2 and proteins: interactions, organization, and information flow. Annu. Rev. Biophys. Biomol. Struct. 2002;31:151–175. doi: 10.1146/annurev.biophys.31.082901.134259. [DOI] [PubMed] [Google Scholar]
- 32.Hoover W.G., Hoover C.G. Links between microscopic and macroscopic fluid mechanics. Mol. Phys. 2003;101:1559–1573. [Google Scholar]
- 33.Hoover W.G., Hoover C.G., Kum O., Castillo V.M., Posch H.A. Smooth particle applied mechanics. Comp. Methods Sci. Tech. 1996;2:65–72. [Google Scholar]
- 34.Lucy L.B. A numerical approach to the testing of the fission hypothesis. Astrophys. J. 1977;82:1013–1024. [Google Scholar]
- 35.Monaghan J.J. Smoothed particle hydrodynamics. Annu. Rev. Astron. Astrophys. 1992;30:543–574. [Google Scholar]
- 36.Gebremichael Y., Ayton G.S., Voth G.A. Mesoscopic modeling of bacterial flagellar microhydrodynamics. Biophys. J. 2006;91:3640–3652. doi: 10.1529/biophysj.106.091314. [DOI] [PMC free article] [PubMed] [Google Scholar]
- 37.Metiu H., Kitahara K., Ross J. A derivation and comparison of two equations (Landau-Ginzburg and Cahn) for the kinetics of phase transitions. J. Chem. Phys. 1976;65:393–396. [Google Scholar]
- 38.Cahn J.W., Hilliard J.E. Free energy of a nonuniform system. I. Interfacial free energy. J. Chem. Phys. 1958;28:258–267. [Google Scholar]
- 39.Chaikin P.M., Lubensky T.C. University Press; Cambridge, UK: 1995. Principles of Condensed Matter Physics. [Google Scholar]
- 40.Sackmann E. Membrane bending energy concept of vesicle- and cell-shapes and shape-transitions. FEBS Lett. 1994;346:3–16. doi: 10.1016/0014-5793(94)00484-6. [DOI] [PubMed] [Google Scholar]
- 41.Ayton G., Voth G.A. Bridging microscopic and mesoscopic simulations of lipid bilayers. Biophys. J. 2002;83:3357–3370. doi: 10.1016/S0006-3495(02)75336-8. [DOI] [PMC free article] [PubMed] [Google Scholar]
- 42.Yoshida Y., Kinuta M., Abe T., Liang S., Araki K. The stimulatory action of amphiphysin on dynamin function is dependent on lipid bilayer curvature. EMBO J. 2004;23:3483–3491. doi: 10.1038/sj.emboj.7600355. [DOI] [PMC free article] [PubMed] [Google Scholar]
- 43.Jiang Y., Lookman T., Saxena A. Phase separation and shape deformation of two-phase membranes. Phys. Rev. E Stat. Phys. Plasmas Fluids Relat. Interdiscip. Topics. 2000;61:R57–R60. doi: 10.1103/physreve.61.r57. [DOI] [PubMed] [Google Scholar]
- 44.Taniguchi T. Shape deformation and phase separation dynamics of two-component vesicles. Phys. Rev. Lett. 1996;76:4444–4447. doi: 10.1103/PhysRevLett.76.4444. [DOI] [PubMed] [Google Scholar]
- 45.Bray A.J. Theory of phase ordering kinetics. Adv. Phys. 1994;43:357–459. [Google Scholar]
- 46.Infeld E., Rowlands G., Winternitz P. Stability analysis for the quartic Landau-Ginzburg model: II. J. Phys. Condens. Matter. 1991;3:4187–4193. [Google Scholar]
- 47.Winternitz P., Grundland A.M., Tuszynski J.A. Nonlinear magnetization processes in the Landau-Ginzburg model of magnetic inhomogeneities for uniaxial ferromagnets. Phys. Rev. B. 1991;44:10040–10049. doi: 10.1103/physrevb.44.10040. [DOI] [PubMed] [Google Scholar]
Associated Data
This section collects any data citations, data availability statements, or supplementary materials included in this article.