Abstract
Electron-spin relaxation is one of the determining factors in the efficacy of MRI contrast agents. Of all the parameters involved in determining relaxivity it remains the least well understood, particularly as it relates to the structure of the complex. One of the reasons for the poor understanding of electron-spin relaxation is that it is closely related to the ligand-field parameters of the Gd3+ ion that forms the basis of MRI contrast agents and these complexes generally exhibit a structural isomerism that inherently complicates the study of electron spin relaxation. We have recently shown that two DOTA-type ligands could be synthesised that, when coordinated to Gd3+, would adopt well defined coordination geometries and are not subject to the problems of intramolecular motion of other complexes. The EPR properties of these two chelates were studied and the results examined with theory to probe their electron-spin relaxation properties.
Keywords: coordination geometry, EPR spectroscopy, gadolinium, imaging agents, macrocyclic ligands
Introduction
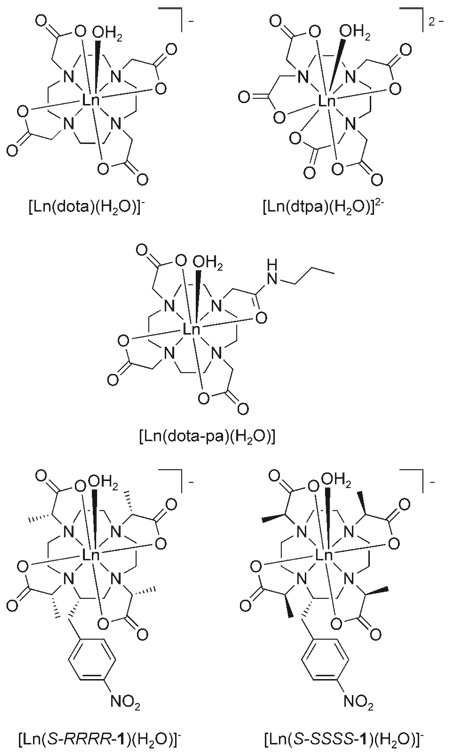
Since their introduction into clinical medicine in the early 1980s considerable effort has been devoted to the development of more effective MRI contrast agents. The efficacy of a contrast agent, typically a Gd3+ complex, is measured in terms of its relaxivity, defined as the increase in water proton relaxation rate per unit concentration of contrast agent. The theory of nuclear relaxation developed by Solomon, Bloembergen and Morgan[1–5] is commonly used to describe the parameters that influence relaxivity, three of which are commonly targeted for modification in contrast agent design in order to improve relaxivity. The hydration state of the gadolinium ion (q) is readily adjusted by altering the denticity of the ligand, however, for reasons of stability q=1 complexes are normally preferred.[6, 7] Lengthening the rotational correlation time of the complex (τR) improves the coupling of electron and nuclear spins in a magnetic field and thus increases relaxivity at magnetic fields typically used in MRI (0.5–3 T). Longer τR values are readily achieved by increasing the hydrodynamic volume of the contrast agent.[6] In order to maximize the effect of a long τR value the water residence lifetime of the coordinated water molecules (τM) must also be optimized. If water exchange is too slow then water needlessly occupies the coordination site on the metal ion, preventing relaxation of other water molecules. If water exchange is too fast, however, then the water protons are not effectively relaxed before the water molecule leaves. A number of design strategies have been reported to optimize the water exchange kinetics of gadolinium complexes.[8–10] Despite these advances in the design of gadolinium-based contrast media there remains one additional parameter in the equations of Solomon, Bloembergen and Morgan[1–5] that is critical to the optimization of relaxivity; the electronic relaxation time of the gadolinium ion (τS). Although one of the primary reasons for the success of Gd3+ as the basis of MRI contrast agents is its relatively long electronic relaxation time, the structural factors that govern this parameter are, as yet, not fully understood. Early work by Koenig on the gadolinium complexes of [Gd-(dtpa)(H2O)]2−, [Gd(dota)(H2O)]− and [Gd(dota-pa)(H2O)], the mono-propylamide of DOTA, led to the suggestion that electron spin relaxation was primarily influenced by the symmetry and rigidity of the complex.[11, 12] However, examination of the properties of some of the many complexes studied since then shows that the factors that govern electronic relaxation must be far more complex than can be accounted for in simple terms of rigidity and symmetry.
Although it is accepted that the effect of altering electronic relaxation in low molecular weight chelates is likely to be negligible at the relatively high fields at which clinic imaging is performed today, there remain several reasons to understand the factors that govern the electronic relaxation of a Gd3+ complex. Not least of these is that at the current imaging fields, τS has a limiting effect on relaxivity once τM and τR have been optimized. The primary cause of electron spin relaxation in solutions of Gd3+ complexes is modulation of the zero-field splitting (ZFS) through perturbation of the ligand field by rotation, vibration and other motions. ZFS is a consequence of inter-electronic repulsion, spin-orbit coupling and the action of the ligand field on the unpaired electrons of the Gd3+ ion. Thus, if we hope to be able to completely understand ZFS, and ultimately electron spin relaxation, a detailed appreciation of how molecular structure and dynamics affect the ZFS of Gd3+ complexes will be necessary. A recurrent problem in the study of electron-spin relaxation is the structural isomerism of Gd3+ chelates. This means that not only is there more than one species, and therefore more than one set of ligand-field parameters being studied at once, but internal molecular motion is modulating these ligand-field parameters during the experiment. Take for example [Gd(dota)(H2O)]− which exists as a mixture of two coordination geometries: a monocapped square antiprism (SAP) and a monocapped twisted square antiprism (TSAP) in solution. These two coordination isomers interconvert at a rate on the order of 10 s−1 at room temperature.[13, 14] Since [Gd(dota)(H2O)]− constitutes approximately 17% TSAP and 83% SAP in solution[15] the electron-spin relaxation parameters measured for this complex are a weighted average of the actual parameters of each coordination isomer.
As part of an investigation into controlling the rate of water exchange in lanthanide complexes[8, 14, 16] we devised a method by which the two coordination isomers of lanthanide DOTA complexes could be selectively synthesised.[8] The reason for doing this is that it was well known that the TSAP isomer exhibited much more rapid water exchange kinetics than the SAP isomer.[8, 14, 17, 18] The S-SSSS isomer of [Gd(1)(H2O)]−, which adopts a TSAP geometry, was found to have a τM value (15 ns) one order of magnitude shorter than that found for the S-RRRR isomer (120 ns), which adopts a SAP geometry.[8] In addition to providing a system with optimal water exchange kinetics for high relaxivities, the isolation of the two coordination geometries of [Ln-(dota)]− complexes also afforded a unique opportunity to study the electronic relaxation properties of each of these structurally distinct complexes, SAP and TSAP, not only in isolation but also in the absence of the processes by which the two isomers interconvert. The method of choice for investigating electron spin relaxation is electron-paramagnetic resonance (EPR) spectroscopy. Given the number of variable temperature and/or frequency studies performed over the last decade[19–22] the amount of experimental data available to researchers has recently increased significantly and this has led to more refined theoretical models for the treatment of this type of data. The EPR properties of the two complexes [Gd(S-SSSS-1)(H2O)]− (TSAP) and [Gd(S-RRRR-1)(H2O)]− (SAP) were assessed to investigate whether these systems might begin to provide useful information relating the structural parameters of Gd3+ complexes to their electron-spin relaxation properties.
Results and Discussion
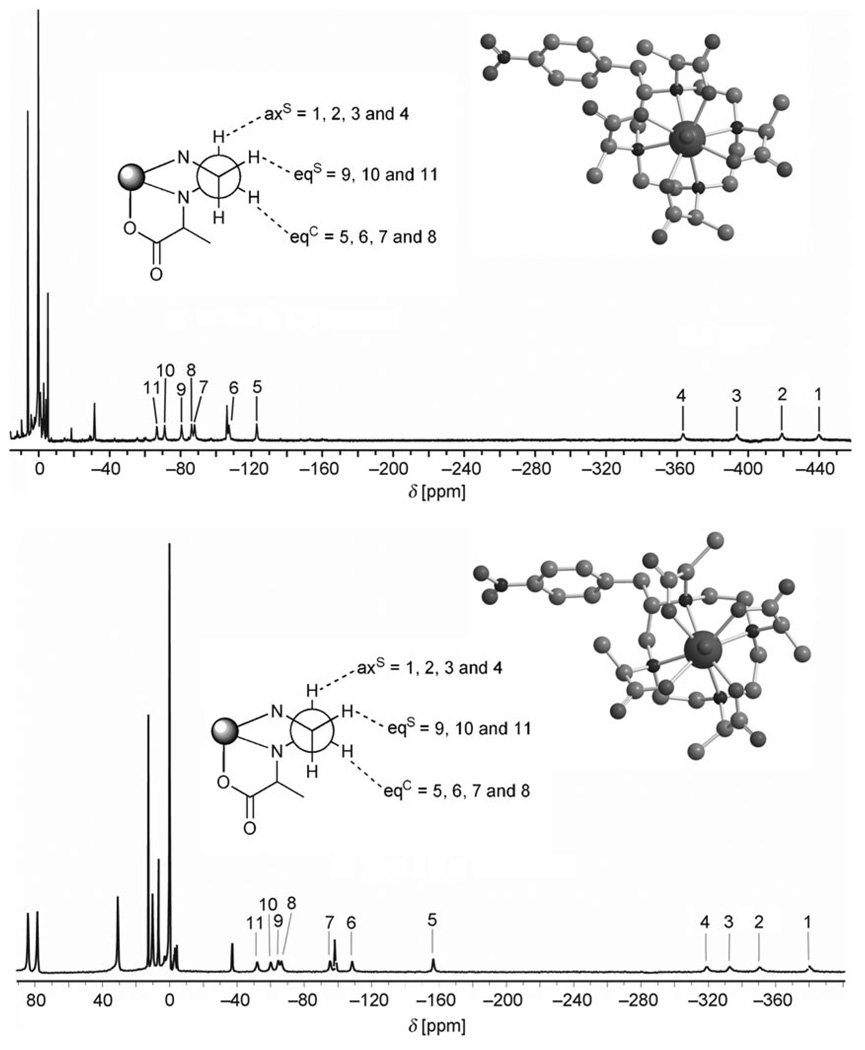
The typical EPR spectrum of a Gd3+ complex is a single broad line, the shape of which can be analyzed to extract such parameters as: the magnitude of the static ZFS; the amplitude of the modulation around this average value, the so-called transient ZFS; and the correlation times for Brownian rotation and for the transient ZFS modulation. In order to reduce the number of parameters involved in analyzing the EPR spectra and improve the reliability of the values obtained the rotational correlation times of the complexes were measured independently. The method chosen for measuring the rotational correlation times was analysis of the Curie relaxation of the ligand protons of the corresponding terbium complexes as described by Aime et al.[23] and Dunand et al.[24] In the case of the complexes [Tb(S-SSSS-1)(D2O)]− and [Tb(S-RRRR-1)(D2O)]− this analysis is complicated by the loss of symmetry induced by the nitro-benzyl substituent. In the previously reported studies on the C4 symmetric complexes of [Tb(dota)(H2O)]− and [Tb-(dotam)(H2O)]3+ the ligand proton resonances are well resolved and readily assigned.[23, 24] The 1H NMR spectra of Tb(S-SSSS-1)(D2O)]− and [Tb(S-RRRR-1)(D2O)]− (Figure 1) show overlapping resonances in some regions but a total of 11 of the 15 macrocyclic ring protons, four axial and all seven equatorial protons, can be identified.
Figure 1.
The up-field region of the 1H NMR spectra of [Tb(S-SSSS-1)(D2O)]− recorded at 295.2 K in D2O 200 MHz (bottom) and of [Tb(S-RRRR-1)(D2O)]− recorded 332.7 K in D2O at 200 MHz (top). The down-field regions of the spectra are not displayed owing to the limited bandwidth of the excitation pulse. The assignments of the protons of the macrocyclic ring are shown in which axS refers to the axial proton of the carbons located on the side of the ring and eqS, the equatorial proton of the same carbon. eqC refers to the equatorial proton located on the carbon located on the corner of the ring.[25] Molecular models of the complexes are also shown, illustrating the difference in coordination geometry between two stereoisomers.[26]
Despite the presence of overlapping peaks that made measurement of peak integral difficult, good inversion recovery profiles of these 11 resonances were obtained at 200, 400 and 500 MHz and 295 and 333 K. Longitudinal proton relaxation times in the millisecond range were determined from these data. A clear acceleration in the relaxation rate was observed with increasing magnetic field. In the absence of crystallographic data on the complexes of [Tb(1)(H2O)]− the same Tb–H distances reported for [Tb(dota)(H2O)]− by Aime et al.[23] were used to perform a Curie relaxation analysis. The nitrobenzyl substituent is thought to induce slight distortions into the conformation of the ethylene bridge on which it is located[27] which may have a small effect on those Tb–H distances. It was not anticipated that the structure of the other ethylene bridges of the macrocyclic ring would be altered in any way by the presence of the nitrobenzyl substituent. On this basis one can assume that the Tb–H distances in [Tb(1)(D2O)]− and [Tb(dota)(H2O)]− should be very close. For both complexes, the rotational correlation time at 298 K was determined for each recorded temperature. The values determined were very similar and afforded an average correlation time (Supporting Information). Use of this average value did not, on average, increase the mean error in the predicted relaxation rates, <Δ(1/T1)>, by more than 30 s−1, compared to the total experimental relaxation rates of 300–3000 s−1 (see Supporting Information), indicating that this average value could reasonably be used in further calculations.
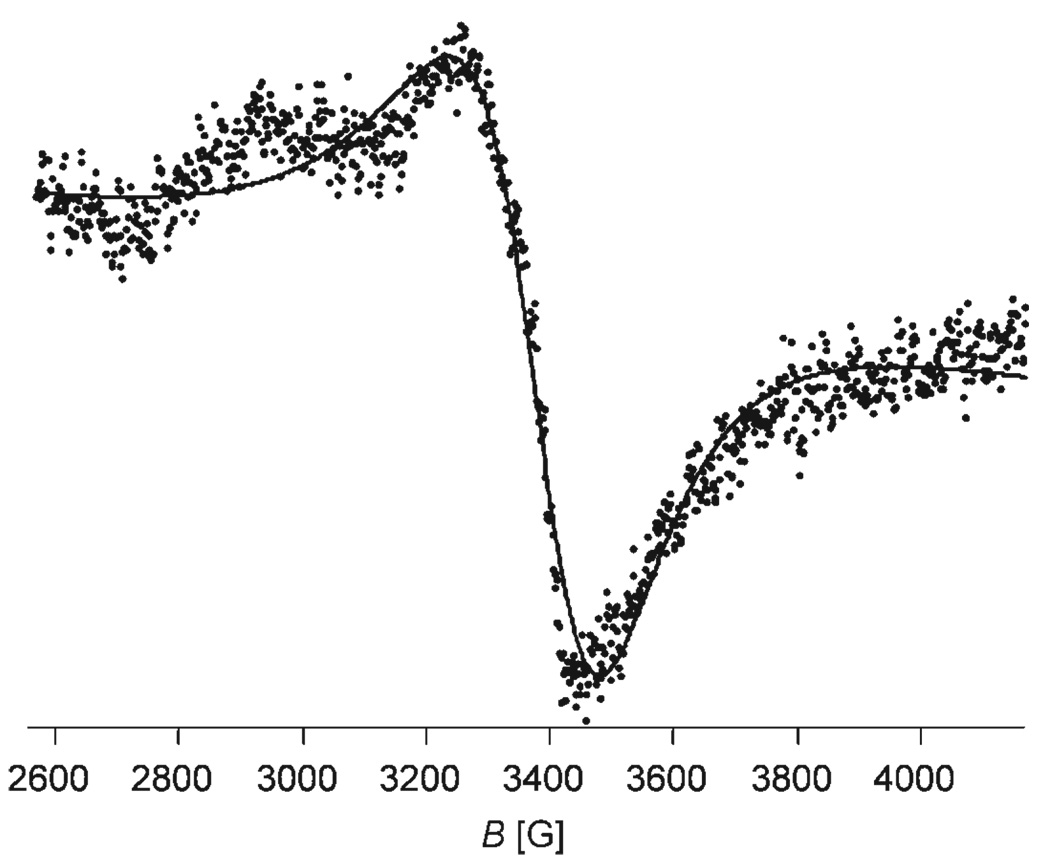
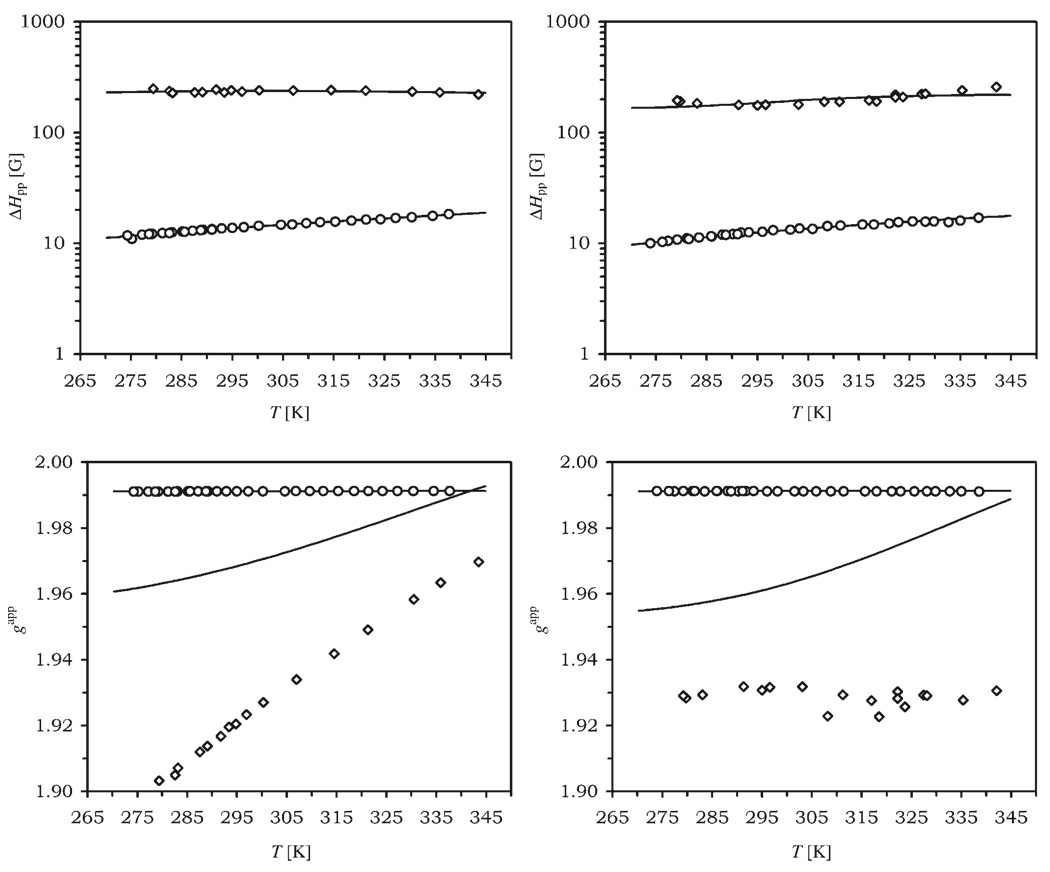
Continuous wave EPR spectra of [Gd(S-SSSS-1)(H2O)]− and [Gd(S-RRRR-1)(H2O)]− were recorded at X-band (9.08 GHz) and W-band (94.2 GHz) at temperatures between 0 and 70°C. The W-band spectra were approximately Lorentzian in shape. The peak-to-peak widths, ΔHpp, central fields, B0, and hyperfine coupling constants, A, were extracted by fitting a superposition of Lorentzians to each experimental spectrum with automatic phase and baseline adjustment. Because the W-band spectra were relatively sharp the data treatment required that the minor gadolinium isotopes, 155Gd (14.8%, , γ=−0.8273 × 10⁷ s−1T−1) and 157Gd (15.65%, , γ=−1.0792 × 10⁷ s−1T−1), be taken into account. Previous studies have shown that hyperfine coupling constants of A155Gd=5.67 G and A157Gd=4.34 G can be reasonably be assumed for these isotopes.[22] When these A values were used to extract real ΔHpp values from the W-band spectra, values that were 1.0–1.5 G lower than the apparent line width of 10–20 G were obtained. The X-band spectra deviated significantly from an ideal Lorentzian line-shape, especially in the low-field region of the spectrum, where the spectra frequently display a “hump” ≈300 G below the central field, an example of which is shown (Figure 2). Reproduction of the X-band line-shapes was improved by applying a phase-correction; this allowed the lines to be reasonably reproduced with a Lorentzian fit (±10%). A similar absolute accuracy (20–30 G) can be estimated for the central field. ΔHpp values between 200–300 G at X-band (cf. ≈100 G for [Gd(dota)(H2O)]− and 400–600 G for [Gd(dtpa)(H2O)]2− and [Gd(dtpa-bma)-(H2O)])[28] indicate that electron-spin relaxation is relatively slow in both [Gd(1)(H2O)]− complexes.
Figure 2.
A representative X-band EPR spectrum of [Gd(S-RRRR-1)(H2O)]−.
The W- and X-band EPR data were then analyzed within the framework of the Rast model of 2nd order static and transient ZFS relaxation[19, 29, 30] using only the reduced ΔHpp and B0 values rather than the full line shape, width and shifts. The model assumes that the electron spin relaxation is determined by the, so-called, static or average ZFS, which is rapidly modulated by molecular tumbling, and by the transient ZFS, which is modulated by random distortions within the complex. The static and transient ZFS were limited to 2nd order terms, although 4th and 6th order terms are also possible for spin systems, such as Gd3+. The value of used in the analysis was fixed to the value determined in D2O from the Curie relaxation study divided by the ratio of the viscosities of D2O and H2O; η298(D2O)/η298-(H2O)=1.22. The activation energy for rotation was fixed to ER=18 kJmol−1 for both complexes (consistent with the temperature dependence of H2O viscosity). The final value obtained, , is at the high end of acceptable values for DOTA-type complexes ,[19] however, this result is expected when one considers the increase hydrodynamic volume that must occur upon introduction of the nitrobenzyl substituent. The absence of very high frequency EPR data meant that the natural g factor could not be accurately determined; nonetheless, using a value of 1.9917 afforded good agreement between the theoretical central fields and the experimental W-band values. The EPR data were fitted to the Rast model using a least squares procedure (Figure 3, the central field is shown as the apparent g factor, gapp=hν/(μBB0)). The parameters obtained from this fitting procedure: the static ZFS magnitude parameter (a2), the rotational correlation time at room temperature and its activation energy (ER), the transient ZFS magnitude (a2T), its associated correlation time and activation energy Ev; are collected in Table 1. The fitted and experimental peak-to-peak widths at both fields are in good agreement and, although the apparent g factors also fit well at W-band, the agreement is less good at X-band. The estimated error in the central field measurement—about 20 G and equivalent to Δg ≈0.013—can only partially explain this discrepancy in the apparent g factor at X-band. The theoretical approach taken in this study is based on Redfield’s theory[31] which assumes that the spin Hamiltonian is modulated by perturbation that are small, and/or have short correlation times (in general, |H1|τ ⪡ 1, where H1 is a time-dependent perturbing Hamiltonian, in our case the ZFS, and τ the correlation time for its modulation).[32] The non-Lorentzian line-shape of the spectra recorded at X-band suggests that this system may not completely conform to Redfield’s theory at these EPR frequencies. Rigorous Monte-Carlo simulations[33] of [Gd(dota)(H2O)]− have shown that, even at low temperature, the X-band line width could adequately be predicted by Red-field Qs approximations. However, the dynamic frequency shifts[34] responsible for the temperature and EPR frequency dependence of the apparent g factor have not been studied using that general method. Another exact approach, perhaps more suitable for the simulation of continuous-wave spectra but involving time-consuming simulations that make it unpractical for experimental data fitting, uses the stochastic Liouville equation.[35, 36] Using such a method, it may prove to be the case that these shifts are more sensitive to violations of Redfield’s approximations than the peak-to-peak widths. Furthermore, as our approach assumes isotropic rotation the presence of the nitrobenzyl substituent in the [Gd(1)(H2O)]− complexes may well induce anisotropic rotation in these complexes which could be the cause of the non-Lorentzian EPR lines and the deviation of the apparent g factors from the theoretical predictions. Isotropic rotation is not a requirement of Redfield’s approximation and a computationally inexpensive theoretical treatment of anisotropic motion in S > ½ systems could be performed by adding a second rotation correlation time and an angle between the rotation and ZFS axes as new parameters. Such a model, combined with an extensive experimental EPR study of a system with known anisotropy, would be a valuable addition to the researchers’ toolset and would allow an unambiguous answer to that particular question.
Figure 3.
Experimental and theoretical EPR peak-to-peak widths (ΔHpp) and apparent g factors (gapp), shown as a function of temperature, at W-band (○) and X-band (◊) for [Gd(S-RRRR-1)(H2O)]− (left) and [Gd(S-SSSS-1)(H2O)]− (right).
Table 1.
Electron spin relaxation parameters obtained from fitting the EPR spectra of [Gd(S-SSSS-1)(H2O)]− and [Gd(S-RRRR-1)(H2O)]−.
| [Gd(dtpa)(H2O)]−[a] | [Gd(dota)(H2O)]−[b] | [Gd(S-SSSS-1)(H2O)]− | [Gd(S-RRRR-1)(H2O)]− | |
|---|---|---|---|---|
| a2 [1010 s−1] | 0.60 | 0.35 | 0.48 | 0.46 |
| [ps][c] | 110 | 81.7 | 98.4[d] | 98.4[d] |
| ER [kJmol−1] | 17 | 16.4 | 18[e] | 18[e] |
| a2T [1010 s−1) | 0.43 | 0.43 | 0.35 | 0.41 |
| [ps] | 0.1 | 0.5 | 2.7 | 3.4 |
| Ev [kJmol−1] | 2.6 | 6.0 | 8.1 | 5.9 |
| g | 1.9930 | 1.9925 | 1.9917[e] | 1.9917[e] |
Since the EPR line-widths measured for [Gd(S-RRRR-1)(H2O)]− and [Gd(S-SSSS-1)(H2O)]− are comparable it is not altogether surprising that the magnitude of the static ZFS(a2), the magnitude of the transient ZFS(a2T) and the correlation time of each complex are similar. Furthermore, the zero-field splitting parameters obtained for both [Gd(1)(H2O)]− complexes closely resemble those obtained from extensive EPR studies of [Gd(dota)(H2O)]−.[19] The similarity of the ZFS parameters in these three complexes suggests that the ZFS is not significantly affected by the changes in ligand field induced by changing a SAP isomer into a TSAP isomer, consistent with the almost identical electron spin relaxation parameters derived for the two isomers from fitting of NMRD data.[16] The differences between the SAP and TSAP coordination geometries are relatively small: there is a change in the twist angle between the N4 and O4 coordination planes from about 45 to about 29°, and there is also a slight increase in the Ln–OH2 bond length. Nonetheless, these differences are large enough that they can induce significant differences in some properties that are related to ligand field. For example, a significant difference is observed between the hyperfine shifts of the ligand protons in the SAP isomer (S-RRRR) and the TSAP isomer (S-SSSS) (Figure 1).[8, 14, 16, 38] This is the result of differences in the pseudo-contact shift contribution to the overall shift, differences that are related directly to changes in ligand field.[26] The differences in ligand field between the two coordination isomers have also been found to have a significant effect on the Cotton bands in ytterbium complexes.[26] Thus the SAP and TSAP coordination geometries induce different ligand fields into the Ln3+ ion, which may be expected to produce different ZFSs in the Gd3+ complexes; however, EPR measurements show that the magnitude of the parameter a2 is essentially the same for both isomers. In C4-symmetric complexes the axial component of the ZFS spherical tensor must lie along the main rotation axis and so both complexes would be expected to have the same ZFS orientation. However, slight distortions in the coordination geometry that lower the symmetry of the metal ion may give rise to a rhombic term that may not have the same orientation in each complex. It may be that the ligand fields of the SAP and TSAP isomers result in differences in the orientation of this perpendicular component but do not affect the magnitude of the ZFS.
Luminescence studies
Ligand-field effects are normally studied through photophysical measurements of the metal ion, either absorption or emission. For lanthanide ions the amount of information that can be obtained from these studies is limited by shielding of the 4f orbitals by the 5d orbitals. As a result of this shielding the effect of the ligand field is small relative to the spin-orbital coupling (≈100 cm−1 versus ≈2000 cm−1). In consequence, the emission spectra of lanthanide ions are characterized by sharp emission bands that correspond to the Russell-Saunders (spin-orbit coupling) states of the ground state. Information about the ligand field is contained within these sharp emission bands and can therefore only be clearly discerned at higher spectral resolutions. Under Laporte selection rules f–f transitions are forbidden: nevertheless, some transitions are permitted under electric or magnetic dipole selection rules through the mixing of 5d and 4f orbitals that arises from distortions of the coordination sphere by vibrational motion. In consequence the intensities of f–f transitions remain low. The Eu3+ ion is an attractive candidate for studying transitions of the 4f electrons because the emissive 5D0 state, being non-degenerate, is not split by the ligand field. This means that transitions from 5D0 to the 7FJ manifold exhibit ligand-field patterns arising solely from the degeneracy of the J state of the 7F ground state.
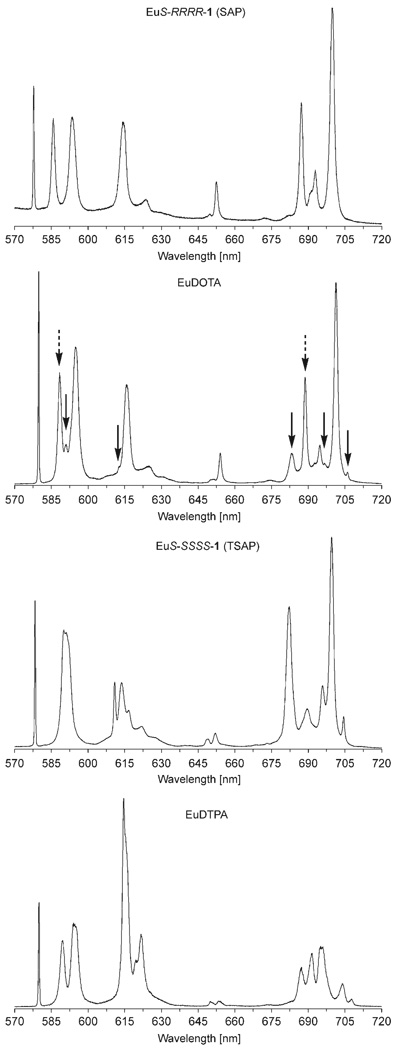
Emission spectra of the Eu3+ complexes of S-RRRR-1, S-SSSS-1, DOTA and DTPA were recorded in aqueous solution at 298 K and 0.05 nm resolution (Figure 4). The most noticeable aspect of these spectra is the strong similarities between the spectra of the three macrocyclic complexes. The relative intensity of each band is similar for each complex, which suggests comparable 5d/4f orbital mixing in each case. There are, however, some noticeable differences in the ligand fields of the SAP and TSAP coordination geometries. The 7F0 state of Eu3+ is also non-degenerate and so a single line is observed for the 5D0 → 7F0 band at about 578 nm. The symmetry of the inner coordination sphere of the Eu3+ ion in DOTA-type complexes is C4 and so two 5D0 → 7F1 transitions centred around 591 nm are possible. The ligand field induced by the SAP coordination geometry induces a large separation between these two transitions (219 cm−1) whereas the separation in the TSAP isomer is very small (58 cm−1). The difference in ligand-field splitting between the two isomers is large enough that both isomers may be identified in the ΔJ=1 band of the [Eu(dota)(H2O)]− spectrum. Complexes with C4 symmetry may have 4 transitions in the 5D0 → 7F2 band (615 nm), with one apparent exception these transitions lie at approximately the same energy levels in the SAP isomer. In contrast the ligand field of the TSAP isomer causes these transitions to appear at different energies and four distinct transitions can be observed. Significantly the ΔJ=2 band is “hypersensitive” a phenomenon, the origins of which are not clearly understood, that leads to significant fluctuations in the intensity of this band. The intensities of this band in all three macrocyclic complexes are largely unchanged by the changes in ligand field induced by isomerization. The 5D0 → 7F3 band (650 nm) is weak but may be split into five transitions in C4 symmetric complexes. Owing to the weakness of this band it is difficult to identify these transitions and the only noticeable difference between the two coordination geometries is an increase in the intensity of the transition at lowest energy, an observation also reflected in the spectrum of [Eu(dota)(H2O)]−. The 5D0 → 7F4 band (centred at 694 nm) also exhibits significant differences depending upon the coordination geometry. C4 symmetry results in seven possible transitions of which two are observed to be more intense than the others in both SAP and TSAP isomers. These transitions are well separated in the spectrum of the TSAP isomer, with five clearly identifiable peaks and a further two small peaks hidden by the more intense peaks. In the case of the SAP isomer only four peaks may be clearly discerned since the peaks are less well separated and greater peak overlap is observed. Comparison of the emission spectra of the SAP and TSAP isomers with that of DOTA reveal that peaks arising from the SAP and TSAP isomeric forms of DOTA can also be identified in the ΔJ=4 band.
Figure 4.
Emission spectra of [Eu(S-RRRR-1)(H2O)]− (top), [Eu(dota)(H2O)]− (above, middle), [Eu(S-SSSS-1)(H2O)]− (below, middle) and [Eu(dtpa)(H2O)]2− (bottom). Peaks characteristic of one coordination isomer in the spectrum of [Eu(dota)(H2O)]− are indicated with arrows; dashed arrows indicate the SAP isomer, whereas solid arrows indicate the TSAP isomer.
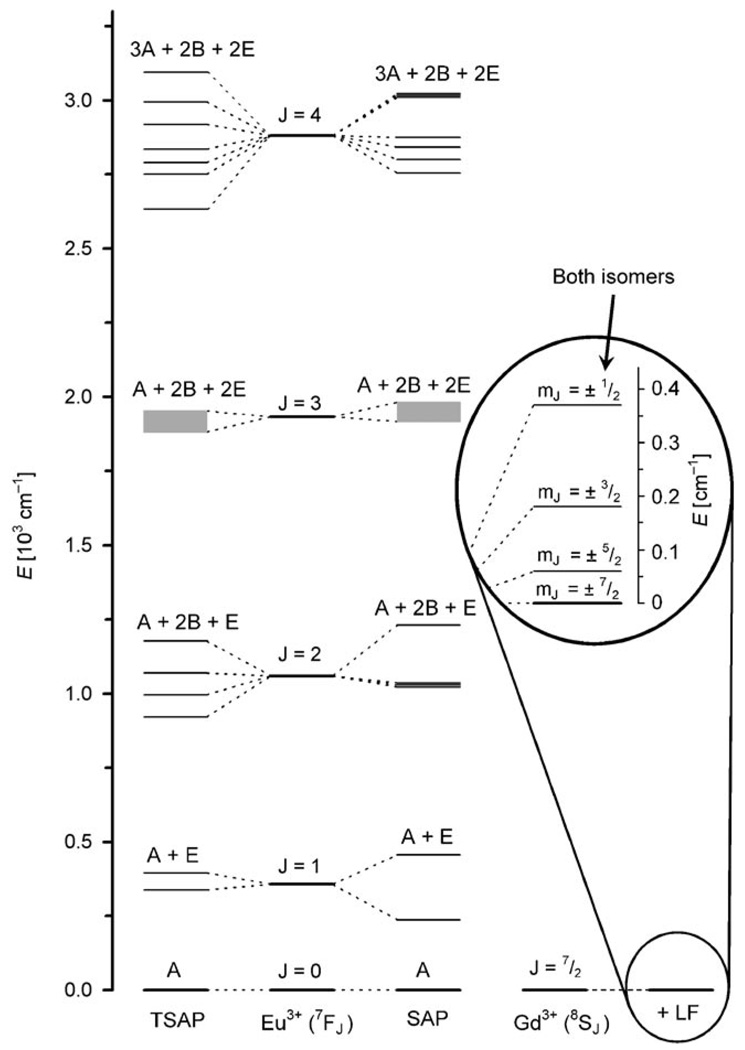
The emission spectra of [Eu(S-RRRR-1)(H2O)]− and [Eu(S-SSSS-1)(H2O)]− were fitted to Gaussian–Lorentzian lines using commercially available peak fitting software (PeakFit v4.12, Systat Software, 2007) to afford the relative energies of the each transition in the spectrum, except those of the ΔJ=3 band which was too weak to allow suitable fitting. The resulting energy level diagram, including ligand-field splitting, is shown in Figure 5. In principle the information contained in this diagram, along with the relative intensities of each peak, can be used to calculate the ligand-field parameters: A0 0, A2 0, etc. of the Eu3+ ion in each coordination geometry. However, although a number of approaches are available for this type of calculation[39, 40] they are extremely complex, having to account for all inter-electronic interactions and relativistic effects. Despite some sophisticated models, it remains difficult to be certain that calculations performed on a single system have yielded reliable ligand-field parameters. Furthermore, the ligand-field parameters obtained for Eu3+ cannot be directly applied to Gd3+, nor used to predict the Gd3+ values, to afford a model of the ZFS. So while we await advances in the quantum mechanical treatment of lanthanide ligand-field theory, a qualitative assessment of the effects of the ligand field upon the ZFS is the best that can currently be put forward. Differences between the ligand fields of the SAP and TSAP isomers are evident from their emission spectra. Furthermore, it has been shown that differences in the separation of the two transitions of the ΔJ=1 band arise from a change in the axial ligand-field parameter A2 0.[41] Despite this, and possibly other, changes in the ligand field only small variations in the ZFS of gadolinium are observed for the SAP and TSAP isomers of DOTA-type complexes.
Figure 5.
The energy levels of the 7FJ states of Eu3+ in the SAP and TSAP coordination geometries (left). The J states of the Eu3+ ion are shown in the centre for comparison. The energy levels of the 7F3 states could not be determined, the range over which those states lie is shown by a shaded region. The mJ states of Gd3+ in the presence of a DOTA-type ligand field (LF) are also shown (right). Only one splitting is shown as both the SAP and TSAP isomers appear to have similar ground state splitting as observed in the a2T parameter of the EPR fitting.
The electron-spin relaxation parameters of [Gd(dtpa)(H2O)]2− are very different from those of [Gd(dota)(H2O)]− and the DOTA-type complexes studied here (Table 1). However, the magnitude of the transient ZFS (a2T) of [Gd(dtpa)(H2O)]2− is very similar to that found for the DOTA-type complexes so it would appear that the magnitude of the static ZFS is the primary source of the difference in electron-spin relaxation. The electron spin relaxation time of [Gd(dtpa)(H2O)]2− is much shorter because the static ZFS is almost twice the magnitude of that of [Gd(dota)(H2O)]− suggesting that a very different ligand field is present. It is hardly surprising therefore that overall form of the emission spectrum of [Eu(dtpa)(H2O)]2− is substantially different from any of those recorded for the DOTA-type complexes. Most notably the 5D0 → 7F2 band is considerably more intense whereas the 5D0 → 7F4 band is less intense. The latter effect is most probably the result of variations in the extent of 5d/4f orbital mixing, notably both d/f orbital mixing and modulation of the ZFS are the result of distortions of the ligand field through vibrational motion. The change in intensity of the ΔJ=2 band is most probably a hyper-sensitivity effect and so the origins of this change are, as yet, unknown. It is impossible to tell if, or how, the phenomenon of hypersensitivity is related to the magnitude, or modulation, of the ZFS. However, the results presented herein indicate that a relationship between the two cannot, at present, be ruled out. The symmetry of the inner coordination sphere of Eu3+ in DTPA is CS, lower than that of DOTA-type complexes, and this leads to an increase in the number of non-degnerate energy levels, 25 versus 19 in C4 symmetric complexes. The number of levels in the 8S state of Gd3+ is unaffected by this change in symmetry and so in the absence of an external magnetic field four Kramers doublets will be present for the manifold (ground state) for all the complexes discussed herein. The change in symmetry could affect the orientation of the ZFS tensor, which is close to axial in the DOTA-type complexes but could lie in any direction in DTPA and may cause a larger ZFS and faster electron spin relaxation of [Gd(dtpa)(H2O)]2−. In DOTA-type complexes, more subtle effects appear to be at play. As shown by luminescence, the ligand field is clearly affected be coordination geometry (SAP vs TSAP), however, according to our EPR and NMR results, the ZFS magnitude is not. Whether the ZFS tensor orientation in both isomers is different remains to be seen. The amount of information available here is limited and while it allows for the exclusion of some relationships between ligand-field effects and electron-spin relaxation it can only hint at the defining relationship.
Conclusion
Clearly more work will be required if the complete relationship between electronic relaxation and coordination environment is to be elucidated. Nonetheless, the work presented herein suggests that relatively small changes in the ligand field have only marginal effects upon the magnitude of the ZFS despite significant changes in the ligand field. The result is that the electron-spin relaxation parameters for the SAP and TSAP coordination geometries are very similar. This similarity suggests that is will not be possible to distinguish the two coordination geometries by EPR at any field strength. Furthermore, the similarity between the electron spin relaxation parameters of each isomer and those obtained for [Gd(dota)(H2O)− suggests that modulation of the ZFS is not affected by interchange of the coordination geometry, which occurs at a much slower rate than electron spin relaxation. The transient ZFS must be modulated by much faster processes, such as vibration and rotation. The limited amount of information available in this study is unable to point us in the direction of a direct relationship between ligand field (and thus ligand structure) and electron spin relaxation. Further studies examining the effects of ligand charge and different donor atoms may provide more insight into this apparently complex relationship.
Experimental Section
NMR Studies
Samples of H[Tb(S-RRRR-1)(HSO)], H[Tb(S-SSSS-1)(H2O)], H[Gd(S-RRRR-1)(H2O)], H[Gd(S-SSSS-1)(H2O)], H[Eu(S-RRRR-1)(H2O)] and H[Eu(S-SSSS-1)(H2O)] were prepared as previously described.[16] 1H NMR experiments on the two terbium(III) complexes were performed on Bruker AVANCE-500, DPX-400 and AVANCE-200 spectrometers operating at 500, 400 and 200 MHz, respectively. The sample temperature during these experiments was controlled using a Bruker BVT-3000 temperature control unit and accurately measured using the standard substitution technique.[42] Each experiment was performed at both 295.2 and 332.7 K. Samples were prepared by dissolving each terbium(iii) complex in D2O to afford a solution of [Tb(S-SSSS-1)(D2O)]− at 9 mmolkg−1 and of [Tb(S-RRRR-1)(D2O)]− at 13 mmolkg−1. The protons of the macrocycle in each complex were assigned according to the assessment of chemical shifts by EXSY and COSY experiments on the corresponding ytterbium complexes.[26] The longitudinal relaxation times (T1) of these protons were determined using the inversion recovery pulse sequence[43] and the data fitted using the XWINNMR programme for Bruker spectrometers. A simultaneous analysis of all longitudinal relaxation rates obtained for a single complex at a given temperature was performed with the VISUALISEUR/OPTIMISEUR[44] programme according to the procedure described by Dunand et al.[24] For the purposes of data treatment it was assumed the system obeyed Arrhenius Law and a value of ER=16.5 kJmol−1 was used, consistent with the temperature dependence of D2O viscosity.[45, 46] This treatment afforded the rotational correlation time in D2O at 298 K as well as the non-Curie (i.e., essentially field-independent) relaxation rate for each proton.
EPR Studies
Continuous wave EPR spectra were recorded on 1 mm solutions of [Gd(S-RRRR-1)(H2O)]− and [Gd(S-SSSS-1)(H2O)]− at around 9.08 GHz (X-band) and about 94.2 GHz (W-band) at temperatures between 273 and 343 K. The spectrometer used for X-band measurements was a Varian E-112 and the magnetic field calibration was performed using a Varian E-500 Gauss-meter. The spectrometer used for W-band measurements was a custom-built instrument and the signal of Mn2+ in a plasticine sample[47] was used as a reference for the field calibration. The frequency was measured by a digital divider/counter. The temperature was adjusted using standard VT controllers and accurately measured with a copper-constantan thermocouple. Spectra were analyzed using the NMRICMA programme.[48]
Luminescence studies
Emission spectra were acquired in on Edinburgh Instruments FL900 fluorimeter exciting to the 5L6 state at 396 nm. The spectra of [Eu(dtpa)(H2O)]2− and [Eu(dota)(H2O)]− were acquired under steady state conditions. The spectra of [Eu(1)(H2O)]− were acquired with a time gate of 200 ms and a time delay of 20 µs.
Acknowledgements
The authors thank Dr. Mark J. Nilges (Urbana) and Martial Rey (Lausanne) for their assistance with the EPR and 500 MHz 1H NMR measurements, respectively. Financial assistance from the Swiss National Science Foundation (A.B.); the EU COST Action D18 “Lanthanide Chemistry for Diagnosis and Therapy” (L.M.); the Hughes Undergraduate Research Fellows Program (J.F.B.); the National Institutes of Health (CA-91597 and RR-01811, R.B.C.), (EB-04285, M.W.), (CA-115531 and RR-02584, A.D.S.); the Petroleum Research Fund of the American Chemical Society; and the Robert A. Welch Foundation (AT-584) is gratefully acknowledged.
Footnotes
Supporting information for this article is available on the WWW under http://www.chemeurj.org/ or from the author.
Contributor Information
Dr. Alain Borel, Email: alain.borel@epfl.ch.
Dr. Mark Woods, Email: mark.woods@utdallas.edu.
References
- 1.Bloembergen N. J. Chem. Phys. 1957;27:572. [Google Scholar]
- 2.Bloembergen N, Morgan LO. J. Chem. Phys. 1961;34:842. [Google Scholar]
- 3.Bloembergen N, Purcell EM, Pound RV. Phys. Rev. 1948;73:679. [Google Scholar]
- 4.Solomon I. Phys. Rev. 1955;99:559. [Google Scholar]
- 5.Solomon I, Bloembergen N. J. Chem. Phys. 1956;25:261. [Google Scholar]
- 6.Caravan P, Ellison JJ, McMurry TJ, Lauffer RB. Chem. Rev. 1999;99:2293. doi: 10.1021/cr980440x. [DOI] [PubMed] [Google Scholar]
- 7.Brucher E, Sherry AD. In: Chemistry of Contrast Agents in Medical Magnetic Resonance Imaging. Toth E, Merbach AE, editors. New York: Wiley; 2001. p. 243. [Google Scholar]
- 8.Woods M, Kovacs Z, Zhang S, Sherry AD. Angew. Chem. 2003;115:6069. doi: 10.1002/anie.200352234. Angew. Chem. Int. Ed.2003, 42, 5889. [DOI] [PubMed] [Google Scholar]
- 9.Woods M, Sherry AD. Proc. 26th Ann. Intl. Conf. IEEE EMBS; 2004. p. 5254. [DOI] [PubMed] [Google Scholar]
- 10.Laus S, Ruloff R, Toth E, Merbach AE. Chem. Eur. J. 2003;9:3555. doi: 10.1002/chem.200204612. [DOI] [PubMed] [Google Scholar]
- 11.Geraldes CFGC, Brown RD, III, Cacheris WP, Koenig SH, Sherry AD, Spiller M. Magn. Reson. Med. 1989;9:94. doi: 10.1002/mrm.1910090111. [DOI] [PubMed] [Google Scholar]
- 12.Sherry AD, Brown RD, III, Geraldes CFGC, Koenig SH, Kuan KT, Spiller M. Inorg. Chem. 1989;28:620. [Google Scholar]
- 13.Hoeft S, Roth K. Chem. Ber. 1993;126:869. [Google Scholar]
- 14.Woods M, Aime S, Botta M, Howard JAK, Moloney JM, Navet M, Parker D, Port M, Rousseaux O. J. Am. Chem. Soc. 2000;122:9781. [Google Scholar]
- 15.Aime S, Botta M, Fasano M, Marques MPM, Geraldes CFGC, Pubanz D, Merbach AE. Inorg. Chem. 1997;36:2059. doi: 10.1021/ic961364o. [DOI] [PubMed] [Google Scholar]
- 16.Woods M, Botta M, Avedano S, Wang J, Sherry AD. Dalton Trans. 2005:3829. doi: 10.1039/b510778d. [DOI] [PMC free article] [PubMed] [Google Scholar]
- 17.Dunand FA, Aime S, Merbach AE. J. Am. Chem. Soc. 2000;122:1506. [Google Scholar]
- 18.Aime S, Barge A, Bruce JI, Botta M, Howard JAK, Moloney JM, Parker D, de Sousa AS, Woods M. J. Am. Chem. Soc. 1999;121:5762. [Google Scholar]
- 19.Rast S, Borel A, Helm L, Belorizky E, Fries PH, Merbach AE. J. Am. Chem. Soc. 2001;123:2637. doi: 10.1021/ja003707u. [DOI] [PubMed] [Google Scholar]
- 20.Benmelouka M, Borel A, Moriggi L, Helm L, Merbach AE. J. Phys. Chem. B. 2007;111:832. doi: 10.1021/jp0633289. [DOI] [PubMed] [Google Scholar]
- 21.Clarkson RB, Smirnov AI, Smirnova TI, Kang H, Belford RL, Earle K, Freed JH. Mol. Phys. 1998;95:1325. [Google Scholar]
- 22.Borel A, Kang H, Gateau C, Mazzanti M, Clarkson RB, Belford RL. J. Phys. Chem. A. 2006;110:12434. doi: 10.1021/jp065445+. [DOI] [PubMed] [Google Scholar]
- 23.Aime S, Barbero L, Botta M, Ermondi G. J. Chem. Soc. Dalton Trans. 1992:225. [Google Scholar]
- 24.Dunand FA, Borel A, Merbach AE. J. Am. Chem. Soc. 2002;124:710. doi: 10.1021/ja016873q. [DOI] [PubMed] [Google Scholar]
- 25.Vipond J, Woods M, Zhao P, Tircso G, Ren JM, Bott SG, Ogrin D, Kiefer GE, Kovacs Z, Sherry AD. Inorg. Chem. 2007;46:2584. doi: 10.1021/ic062184+. [DOI] [PMC free article] [PubMed] [Google Scholar]
- 26.Di Bari L, Pescitelli G, Sherry AD, Woods M. Inorg. Chem. 2005;44:8391. doi: 10.1021/ic0511118. [DOI] [PMC free article] [PubMed] [Google Scholar]
- 27.Woods M, Kovacs Z, Kiraly R, Brucher E, Zhang S, Sherry AD. Inorg. Chem. 2004;43:2845. doi: 10.1021/ic0353007. [DOI] [PubMed] [Google Scholar]
- 28.Powell DH, Ni Dhubhghaill OM, Pubanz D, Helm L, Lebedev YS, Schlaepfer W, Merbach AE. J. Am. Chem. Soc. 1996;118:9333. [Google Scholar]
- 29.Rast S, Fries PH, Belorizky E. J. Chim. Phys. 1999;96:1543. [Google Scholar]
- 30.Rast S, Fries PH, Belorizky E. J. Chem. Phys. 2000;113:8724. [Google Scholar]
- 31.Redfield AG. Adv. Magn. Reson. 1965;1:1. [Google Scholar]
- 32.Fries PH, Belorizky E. J. Chem. Phys. 2007;126:204503/1. doi: 10.1063/1.2730831. [DOI] [PubMed] [Google Scholar]
- 33.Rast S, Fries PH, Belorizky E, Borel A, Helm L, Merbach AE. J. Chem. Phys. 2001;115:7554. doi: 10.1021/ja003707u. [DOI] [PubMed] [Google Scholar]
- 34.Poupko R, Baram A, Luz Z. Mol. Phys. 1974;27:1345. [Google Scholar]
- 35.Aman K, Westlund PO. Phys. Chem. Chem. Phys. 2007;9:691. doi: 10.1039/b614821b. [DOI] [PubMed] [Google Scholar]
- 36.Borel A, Clarkson RB, Belford RL. J. Chem. Phys. 2007;126:054510/1. doi: 10.1063/1.2433947. [DOI] [PubMed] [Google Scholar]
- 37.Dunand FA, Borel A, Helm L. Inorg. Chem. Commun. 2002;5:811. [Google Scholar]
- 38.Howard JAK, Kenwright AM, Moloney JM, Parker D, Woods M, Port M, Navet M, Rousseau O. Chem. Commun. 1998:1381. [Google Scholar]
- 39.Sastri VS, Bunzli JC, Perumareddi JR, Rao VR, Rayudu GVS. Modern Aspects of Rare Earths and Their Complexes. Amsterdam: Elsevier; 2003. [Google Scholar]
- 40.Newman DJ, Ng B. Crystal Field Handbook. Cambridge: Cambridge University Press; 2000. [Google Scholar]
- 41.Dickins RS, Parker D, Bruce JI, Tozer DJ. Dalton Trans. 2003:1264. [Google Scholar]
- 42.Ammann C, Meier P, Merbach AE. J. Magn. Reson. 1982;46:319. [Google Scholar]
- 43.Vold RL, Waugh JS, Klein MP, Phelps DE. J. Chem. Phys. 1968;48:3831. [Google Scholar]
- 44.Yerly F, Dunand FA, Toth E, Figueirinha A, Kovacs Z, Sherry AD, Geraldes CFGC, Merbach AE. Eur. J. Inorg. Chem. 2000:1001. [Google Scholar]
- 45.Kestin J, Imaishi N, Nott SH, Nieuwoudt JC, Sengers JV. Physica A. 1985;134:38. [Google Scholar]
- 46.Harris KR, Woolf LA. J. Chem. Eng. Data. 2004;49:1064–1069. [Google Scholar]
- 47.Rahimi-Moghaddam P, Upadrashta Y, Nilges MA, Weil JA. Appl. Magn. Reson. 2003;24:113. [Google Scholar]
- 48.Helm L, Borel A. ICMA, Lausanne. (2.7 ed.) 2000 [Google Scholar]


