

Abstract
The nicotinic acetylcholine receptor (AChR) is the prototype of ligand-gated ion channels. Here, we calculate the dynamics of the muscle AChR using normal modes. The calculations reveal a twist-like gating motion responsible for channel opening. The ion channel diameter is shown to increase with this twist motion. Strikingly, the twist motion and the increase in channel diameter are not observed for the AChR in complex with two α-bungarotoxin (αBTX) molecules. The toxins seems to lock together neighboring receptor subunits, thereby inhibiting channel opening. Interestingly, one αBTX molecule suffices to prevent the twist motion. These results shed light on the gating mechanism of the AChR and present a complementary inhibition mechanism by snake-venom-derived α-neurotoxins.
Predicting protein dynamics is essential for a better understanding of many biological processes. One of the standard techniques for studying protein dynamics and, in particular, low-frequency domain motions is normal-mode analysis. In contrast to molecular dynamics, normal-mode analysis provides a very detailed description of the dynamics around a local energy minimum. Even with its limitations, such as the neglect of the solvent effect, the use of harmonic approximation of the potential energy function, and the lack of information about energy barriers and crossing events, normal modes have provided much useful insight into protein dynamics. Over the past years, several techniques have been described to calculate large-scale motions using simplified normal-mode analysis (1–3). The Internet also contains a number of interactive programs to calculate normal modes, such as the elastic network model (4), ElNemo (5), and GROMACS (6).
The nicotinic acetylcholine receptor (AChR)1 is a ligand-gated ion channel that is opened by the neurotransmitter acetylcholine (ACh). Channel opening is associated with an ion flux, leading to neuromuscular transmission. The AChR consists of five subunits in the stoichiometry, α2δβγ, arranged in a clockwise order around the ion channel (7). The receptor has two ACh-binding sites, a higher affinity site at the interface of α and δ subunits, and a lower affinity site at the interface of α and γ subunits (8). Binding in these sites is cooperative, and channel opening occurs only when both sites are occupied (8). The ACh-binding sites are also the target of a variety of agonists, such as nicotine and epibatidine, and antagonist, such as tubocurarine and α-bungarotoxin (αBTX). The α subunit of the AChR (αAChR) also contains the major immunogenic region (MIR), which is the main target of autoimmune antibodies in myasthenia gravis (9–11).
α-Bungarotoxin (αBTX) is a 74 amino acid α-neurotoxin derived from snake venom of Bungarus multicinctus. It binds to the muscle AChR competitively, inhibiting ACh binding, thereby preventing channel opening and blocking neuromuscular transmission. The binding mode of α-neurotoxins to the AChR has been studied extensively (12–15). In these structures, the AChR peptide segment α 1W184–α1D2002 forms multiple interactions with finger I (BT6–BS12) and II (BM27–BL42) as well as the C terminus (BH68–BR72) of αBTX. Several groups have attempted to construct a model of α-neurotoxins interacting with the extracellular domain of AChR (12, 13, 15–18) based on the X-ray structure of AChBP (25) and the cryo-EM structure of AChR (19). Our approach, was to use the structure of an AChR peptide in complex with αBTX and the structure of AChBP to construct a model of the AChR in complex with αBTX (15). In this model, αBTX protrudes deeply at the interface of α and δ subunits as well as α and γ subunits, where it forms multiple interactions. Upon binding, approximately 35% of the toxin surface become buried, thus accounting for the extremely high affinity between these molecule species. In this study, we use the coordinates of this complex to calculate normal modes.
Several studies have attempted to predict the gating motion of the AChR using molecular dynamics (MD). Earlier MD studies of the α7 AChR consisting of five identical subunits have shown a gating motion described as “iris-like”, “pore-breathing motion” (20, 21), and “twisting” (18); however, no MD simulation was performed on the asymmetric heteropentameric α1 AChR. Concurrent with these studies, several other laboratories have calculated normal modes with a similar motion for the potassium channel (22), the bacterial mechanosensitive channel (23), and the glycine α1 receptor (24). However, none of the aforementioned studies described the effect of toxin binding on receptor motion. Here, we calculate the normal modes of the AChR and its complex with αBTX using several techniques. The analysis reveals the molecular motion involved in channel opening of the receptor and sheds light on the inhibition mechanism of snake neurotoxins.
EXPERIMENTAL PROCEDURES
Construction of the AChR Model in Complex with αRBTX
Previously, we constructed a nuclear magnetic resonance (NMR)-based model of the extracellular domain of AChR in complex with two αBTX molecules [Protein Data Bank (PDB) ID 1LK1]. The model was based on the homologous structure of AChBP (25) and the NMR structure of αBTX in complex with a peptide corresponding to residues α1R182–α1T202 of the αAChR (see ref 15 for more details). An additional model of the entire AChR in complex with one and two αBTX was prepared using the Swiss PDB program. To construct this model, the AChR structure determined by Unwin was used (19), and αBTX molecules were inserted at the interface of α and δ subunits and α and γ subunits similar to the method described in ref 15.
The models of the AChR in complex with one toxin molecule were prepared by editing out the coordinates of the second toxin. The AChR model was prepared by editing out both toxins. The model of the AChR in complex with a small fragment of αBTX was prepared by editing out the coordinates of most of the toxin, keeping only αBTX residues BW28–BE41 at the tip of the second finger, directly linking the α and γ subunits as well as α and δ subunits. All PDB coordinates used herein were further minimized using 20 steps of steepest descent followed by 20 steps of conjugate gradient in Swiss PDB (26).
To prepare the “decoy” complexes of αBTX docked onto the surface of the receptor in different locations, the ZDOCK server (http://zdock.bu.edu) was used (27). To calculate the percentage of buried surface of the toxin in these decoy complexes, MolSofts ICM program was used.
Normal-Mode Calculation
Normal-mode calculations of the extracellular and entire AChR and their complexes with one and two snake toxins were carried out separately using several normal-mode web servers. First, the calculation were performed using the online version of ElNemo (5) at http://igs-server.cnrs-mrs.fr/elnemo/index.html. Defaults values of DQMIN, DQMAX, and DQSTEP were used to calculate the 25 lowest frequency normal modes. To check for consistency, the normal-mode calculations were repeated using another web server, NOMAD-Ref (28), located at http://lorentz.immstr.pasteur.fr/nma/. The sparse metric solver method was used to calculate the lowest 25 modes using default distance weight values, cutoff values for modes calculation, and average root-mean-square deviation (rmsd) for output trajectories. Calculations were also carried out for αBTX in complex with a peptide corresponding to α1R182–α1T202 (PDB ID 1L4W and 1LJZ) on both servers. Normal modes were also calculated for the AChBP in complex with five α-cobratoxins (PDB ID 1YI5) (29) and for the AChR in complex with a small αBTX fragment corresponding to residues BW28–BE41. Last, normal modes of the 24 AChR decoys with αBTX docked in various locations were calculated. In all cases, the lowest 25 modes were calculated. The first six trivial normal modes are discarded because they represent only translation and rotation.
RESULTS AND DISCUSSION
Normal-Mode Calculations
The normal modes of the AChR were calculated using the ElNemo server and the Nomad-REF server. Figure 1 shows the 〈R2〉 values plotted against the residues of the AChR. Low 〈R2〉 values, indicative of small amplitude motion, are correlated with the presence of secondary structure, whereas large 〈R2〉 values point to the absence of such elements. An example of this effect is the relatively low 〈R2〉 values exhibited by β residues α130–α160 of αAChR and the relatively large 〈R2〉 values displayed by loop residues α167–α172 of αAChR. The latter loop region that coincides with the MIR was found to adopt a random-coil conformation (30).
Figure 1.

Normal-mode-derived 〈R2〉 values of AChR residues. In red are the values calculated using ElNemo, and in blue are the values calculated using Nomad-ref. The secondary structure is indicated above the residue axis.
AChR Dynamics
Most often, the first one or two normal modes are enough to describe molecular motions (31). Also here, the lowest normal mode of the unbound AChR revealed a concerted and symmetric motion around the ion pore. The twist motion resembles that of wringing a washcloth from both ends and has often been described as an “iris”-like motion (Figures 2 and 3). This motion is responsible for the axially symmetric opening and closing motions of the ion channel (Figure 4). In the extracellular domains, the Cys-loop hairpin of the α subunits and their corresponding segment in the non-α subunits move concertedly toward their neighboring subunit. As the Cys-loop hairpins sway, a tightening of the ligand-binding pockets at the interface of α and δ subunits is detected. The secondary structure of the Cys loops consisting of long β hairpins remains unchanged during the motion.
Figure 2.

Normal-mode twist motion of the AChR. Shown is the top and side views of the entire AChR. The receptor twists, as the top and bottom rotate in opposite directions.
Figure 3.
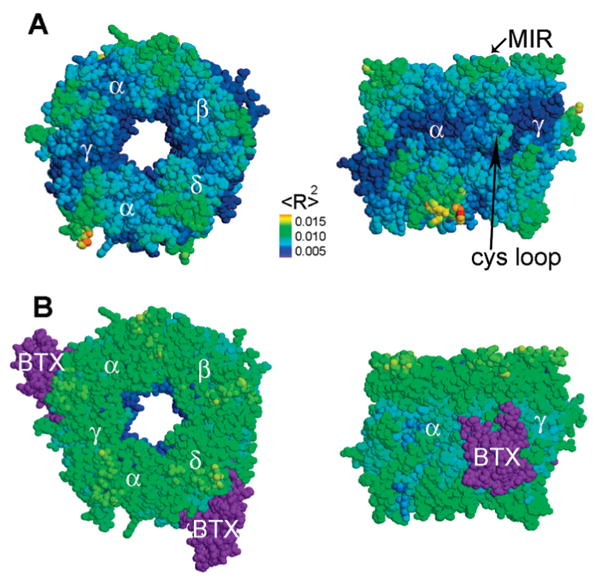
Motion of the extracellular domain of the AChR and its complex with αBTX. (A) Bottom and side views of the extracellular domain of AChR. The receptor twists, as the top and bottom rotate in opposite directions. (B) Bottom and side views of the extracellular domain of AChR in complex with αBTX. The receptor vibrates as a single unit and does not twist. The motion amplitude is presented through color coding. Blue, green, and orange are indicative of little, medium, and large motions respectively. For clarity, the αBTX molecules are colored purple. Indicated are α, δ, β, and γ subunits of the receptor, αBTX (BTX), the Cys loop, and the MIRs.
Figure 4.
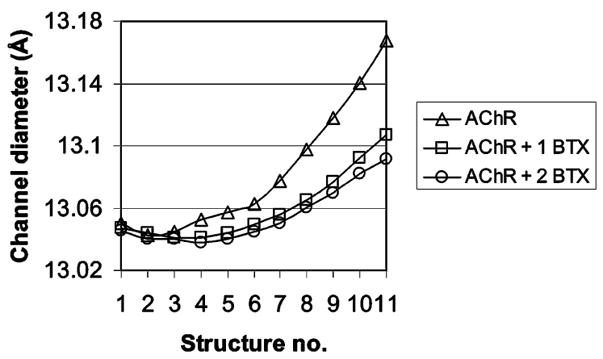
Ion-channel diameter of the AChR and its complexes with one and two αBTX. Plotted are the average diameter of the ion channel against the structures calculated using ElNemo NMA. Shown are the diameters for AChR (△) and its complex with one (□) and two (○) αBTX molecules.
In previous normal-mode studies of the α7AChR, which contained five identical α7 subunits arranged in a 5-fold symmetry around the ion channel, a 5-fold averaging was applied (32). We did not perform such 5-fold averaging mainly because the α1AChR contains four non-identical subunits but also because we did not want to eliminate the effect of asymmetry on the calculation. Interestingly, the twist motion is observed with and without symmetry averaging.
The twist mode associated with channel opening is generally the lowest mode of ligand-gated ion channels. The normal modes calculated for other receptors (18, 20, 24, 32) or using other molecular dynamic tools (21) have in common that the first mode is a twist mode. Higher modes fail to exhibit the twist modes. The fact that the twist mode is observed using different techniques supports the strength of the results.
Time Scale of Motion
Ligand-gated ion-channel opening seems to occur on the millisecond time scale. In fact, the duration of the open state of the AChR was measured to 3 ms (33). Normal-mode vibrations though, occur on the nanosecond time scale. This time-scale inconsistency is consistent with other normal-mode studies (24) and simply implies that the ion channel is constantly vibrating in a manner similar to that associated with channel opening. Clearly, the vibration-associated duration of the open state is too short to allow for ion flux, and it would not be until ligand binding that channel opening would occur.
Main Immunogenic Region Is Flexible
Myasthenia gravis is a non-inherited autoimmune disease usually characterized by the presence of circulating autoantibodies that bind to and destroy muscle AChRs (34). Upon antibody binding, this region is immobilized, which leads to lowered levels of AChR and subsequently less neuromuscular transmission. The antibodies bind to the MIR corresponding to residues α167–α176 of the αAChR (9). In our calculation, this region exhibits great flexibility and high 〈R2〉 factors (see Figure 1). Interestingly, flexibility has been proposed as a characteristic of high antigenicity (35). The MIR flexibility seems to play an important role in antibody binding, as was suggested by Tzartos et al. (35).
αBTX Inhibits Normal-Mode-Derived Channel Opening of AChR
One of the striking features of this study is that αBTX inhibits normal-mode-calculated channel opening. The diameter variance of the ion channel, which is a good indicator for channel opening, was measured for the receptor and compared to its complexes with αBTX. Because the ion-channel diameter varies significantly along its length, arbitrary distances between residues lining the ion channel and displaying large motion were measured. Such distances include α V261(Cγ)–δF256(Cδ), δA383(Cβ)–αI376(Cδ), and βL265(Cδ)–αV259(Cγ), which were measured and averaged to obtain average channel diameters for all structures calculated in the ElNemo analysis. These residues are located at different heights of the ion channel. Figure 4 shows the averaged variance of the ion-channel diameter in the NMA-calculated structures of the AChR and its complexes with one and two αBTX. Clearly, the ion channel of the toxin-bound receptor opens to a smaller extent than that of the free receptor. Moreover, one toxin is sufficient to inhibit normal-mode-derived channel opening in agreement with experimental data (8). Now, the change in channel diameter between the open and closed states of the receptor is relatively small (~0.15 Å), as indicated in earlier studies (32). Therefore, it is not be surprising that minor deviations of channel diameter are observed upon binding the toxins. The motion size should be ignored, and the deviation should be regarded more as a qualitative tendency.
Motion of the AChR in Complex with αBTX
Normal modes were also calculated for the extracellular domain of AChR and its complexes with αBTX molecules. In the free receptor, the twist motion is exhibited in the lowest frequency mode. In the toxin-bound receptor, however, this motion was not observed in the 25 lowest frequency modes. The toxin seems to bond together adjacent α and δ, as well as α and γ subunits, preventing the concerted twist motion associated with channel opening (Figure 3).
Normal modes were also calculated for the receptor in complex with only one toxin molecule inserted at either the αδ or αγ interface (not shown). In both cases, the twist-like motion was not observed in the 25 lowest frequency modes, suggesting that binding of one αBTX molecule is sufficient to inhibit channel opening. This observation is consistent with the fact that binding of two ACh molecules is required for channel opening, whereas only one αBTX molecule suffices to lock the receptor (8).
The idea that computer-predicted dynamics are susceptible to interaction in the binding site is not new. Recently, it was reported by Ming and Wall that interactions in native binding sites lead to large changes in protein dynamics (36). The authors used a computational method named dynamics perturbation analysis to identify sites at which interactions have a large influence on protein conformation distribution. Our findings that interactions of αBTX limit AChR dynamics strengthens this idea, and it is perhaps not by chance that natural selection favored a toxin capable of regulating the dynamics of the AChR through molecular interactions.
It may be argued that the asymmetry of the AChR in complex with two toxins is responsible for the deficiency of twist modes. To test this argument, normal modes were calculated for the AChBP (an AChR homologue) in complex with five α-cobratoxins. The AChBP is a soluble protein derived from snail synapses that shares sequence and structure homology with the extracellular domain of AChR. It is a homopentamer consisting of five identical α-like subunits arranged in a 5-fold symmetry around the central pore. α-Cobratoxin is a long α-neurotoxin containing a three-finger motif similar to αBTX. The 25 lowest frequency normal modes of this complex were calculated and analyzed for twist motion. Remarkably, none of the modes displayed this type of motion, thus rejecting the argument that asymmetry is responsible for the lack of twist motion. An additional test was performed to rule out the responsibility of geometric artifacts for the restrained twist motion. An AChR/αBTX complex was prepared in which most of the toxin was edited out, keeping only the few residues BW28–BE41 at the tip of the second finger directly linking the α/γ and α/δ subunits. The resulting complex is fairly symmetrical and does not contain large masses protruding from the sides of the receptor. Inspection of the 25 lowest frequency modes calculated for this complex showed no evidence for the twist motion suggesting that only a fraction of the toxin is sufficient to link together adjacent subunits. These experiments reveal the role played by the toxin in linking together adjacent subunits and dismiss geometry as a reason for the limited twist motion.
It may also be argued that adding two important masses to some places on the surface of the receptor, actually anywhere on the surface, will produce the same effect, namely, prevent the twist motion. To test this argument, two dozens “decoys” with α-bungarotoxin docked onto the surface of the receptor in different locations were generated using ZDOCK (27). In these decoys, the repertoire of toxin positions varies from the interior pore to the exterior surface of the AChR. Normal-mode calculations of these decoys were carried out, and their twist motion was analyzed. In most cases, the decoys displayed a twist motion similar to that of the unbound receptor. In few cases, however, particularly in decoys in which the toxin occupied a position at the interface of subunits and exhibited a buried surface larger than 20%, a slight reduction in twist motion was observed. Congruently, these decoys displayed less channel diameter opening in a similar fashion as the toxin in its native binding site. These data indicate that the reduction of normal-mode twist motion and channel opening is not completely unique to toxin binding in the native binding site. The effect was also noticed to a smaller extent in decoys with toxins located elsewhere (data not shown). It must be noticed however that the reduction effect observed in the decoys is smaller in comparison to that of the native binding site. The reduction of twist motion seems to be correlated with the amount of toxin surface buried and the capacity of linking together adjacent subunits. αBTX in its native binding site at the interface of α and δ as well as α and γ subunits displays a buried surface of approximately 35%, more than in any of the decoys, and the largest reduction of twist motion is noticed with αBTX in this site.
There are two main limitations to this paper. First, even if we show how the binding of αBTX to the receptor inhibits the twist motion associated with channel opening, there are other more important reasons contributing to the inhibition of AChR. Such reasons include steric occlusion of the receptor–ligand binding site by BR36 of αBTX (15), which prevents binding of acetylcholine. This arginine residue, which forms cation–π interactions with aromatic residues in the binding site, is conserved in all snake α-neurotoxins. The second limitation to this paper is the fact that to really explain inhibition would require a calculation showing the twist motion to be completely impossible even as a combination of modes in the bound structures.
Correlation of Predicted B Factors and NMR-Derived rmsd
The structure of αBTX in complex with an αAChR peptide corresponding to residues α1182–α1202 was solved using NMR, and the ensemble coordinates were deposited under the PDB ID 1LJZ (15). Normal-mode analysis of this complex was performed, and the 25 lowest frequency modes were calculated. Backbone rmsd values for individual residues of the 74 αBTX were calculated using the MOL-MOL software package (37). A plot of the predicted B factor against the rmsd value of each residue is plotted in Figure 5. rmsd values obtained from NMR ensemble structures are a good indicator of molecular motion in solution. The correlation coefficient is 0.765 and indicates a good fit between the observed and predicted dynamics.
Figure 5.
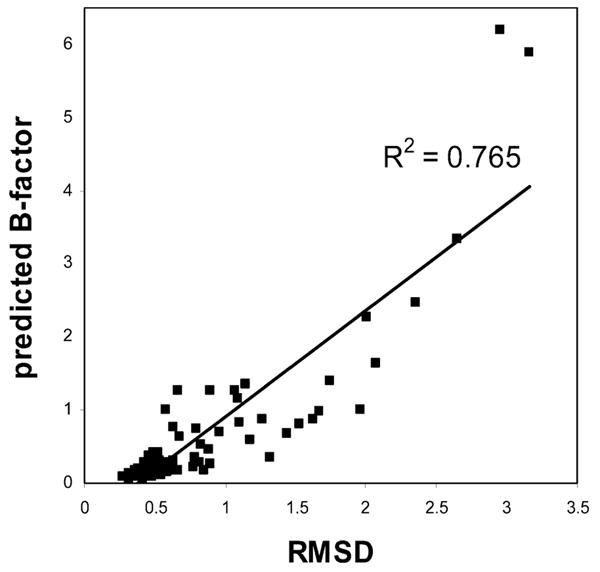
Correlation between rmsd and the predicted B factor. rmsd values are plotted against the predicted B factor for each of the 74 residues of αBTX (PDB ID 1LJZ).
CONCLUSION
In this study, we were able to calculate the normal-mode vibrations of the AChR and its complex with α-neurotoxins. The unbound receptor revealed a twist-like motion common to many other ligand-gated ion channels. We also show that AChR inhibition may be explained through the immobilization of the twist motion and its associated channel opening. These results account for a great deal of information known of the AChR. The twist-like motion is in agreement with time-resolved electron microscopic analysis that shows a rotation movement of the two α subunits upon channel opening (38). Also, the fact that only one toxin suffices to inhibit motion-associated motion is in agreement with experimental data. Such calculations shed light on the motion involved in signal transmission. In the future, normal-mode analysis of the receptor in complex with conotoxins, which bind in different binding sites, could be envisaged.
Supplementary Material
Acknowledgments
We thank Mrs. Dahlia Weiss for careful reading of the manuscript, help, and comments.
Footnotes
This research was supported by National Institutes of Health (NIH) Roadmap 2PN2-EY016525, NIH Grant GM41455, and NSF award CNS-0619926 for computer resources.
Abbreviations: MD, molecular-dynamics; NMA, normal-mode analysis; NMR, nuclear magnetic resonance; α BTX, α-bungarotoxin; AChBP, acetylcholine-binding protein; AChR, nicotinic acetylcholine receptor; αAChR, α subunit of AChR; MIR, main immunogenic region; PDB, protein data bank.
αBTX and AChR residues are designated by a superscript B and α1 (i.e., BX, α1X), respectively, before the one letter amino acid code, indicating the subunit type and the position in sequence.
SUPPORTING INFORMATION AVAILABLE
Movies of the normal-mode vibration of the AChR and it’s complex with αBTX. This material is available free of charge via the Internet at http://pubs.acs.org.
References
- 1.Brooks B, Karplus M. Harmonic dynamics of proteins: normal modes and fluctuations in bovine pancreatic trypsin inhibitor. Proc Natl Acad Sci USA. 1983;80:6571–6575. doi: 10.1073/pnas.80.21.6571. [DOI] [PMC free article] [PubMed] [Google Scholar]
- 2.Go N, Noguti T, Nishikawa T. Dynamics of a small globular protein in terms of low-frequency vibrational modes. Proc Natl Acad Sci USA. 1983;80:3696–3700. doi: 10.1073/pnas.80.12.3696. [DOI] [PMC free article] [PubMed] [Google Scholar]
- 3.Levitt M, Sander C, Stern PS. Protein normal-mode dynamics: Trypsin inhibitor, crambin, ribonuclease and lysozyme. J Mol Biol. 1985;181:423–447. doi: 10.1016/0022-2836(85)90230-x. [DOI] [PubMed] [Google Scholar]
- 4.Delarue M, Sanejouand YH. Simplified normal mode analysis of conformational transitions in DNA-dependent polymerases: The elastic network model. J Mol Biol. 2002;320:1011–1024. doi: 10.1016/s0022-2836(02)00562-4. [DOI] [PubMed] [Google Scholar]
- 5.Suhre K, Sanejouand YH. ElNemo: A normal mode web server for protein movement analysis and the generation of templates for molecular replacement. Nucleic Acids Res. 2004;32:W610–W614. doi: 10.1093/nar/gkh368. [DOI] [PMC free article] [PubMed] [Google Scholar]
- 6.van der Spoel D, Lindahl E, Hess B, Groenhof G, Mark AE, Berendsen HJ. GROMACS: Fast, flexible, and free. J Comput Chem. 2005;26:1701–1718. doi: 10.1002/jcc.20291. [DOI] [PubMed] [Google Scholar]
- 7.Changeux JP. Chemical signaling in the brain. Sci Am. 1993;269:58–62. doi: 10.1038/scientificamerican1193-58. [DOI] [PubMed] [Google Scholar]
- 8.Blount P, Merlie JP. Molecular basis of the two nonequivalent ligand binding sites of the muscle nicotinic acetylcholine receptor. Neuron. 1989;3:349–357. doi: 10.1016/0896-6273(89)90259-6. [DOI] [PubMed] [Google Scholar]
- 9.Tzartos SJ, Kokla A, Walgrave SL, Conti-Tronconi BM. Localization of the main immunogenic region of human muscle acetylcholine receptor to residues 67–76 of the α subunit. Proc Natl Acad Sci USA. 1988;85:2899–2903. doi: 10.1073/pnas.85.9.2899. [DOI] [PMC free article] [PubMed] [Google Scholar]
- 10.Tzartos SJ, Rand DE, Einarson BL, Lindstrom JM. Mapping of surface structures of electrophorus acetylcholine receptor using monoclonal antibodies. J Biol Chem. 1981;256:8635–8645. [PubMed] [Google Scholar]
- 11.Barkas T, Gabriel JM, Mauron A, Hughes GJ, Roth B, Alliod C, Tzartos SJ, Ballivet M. Monoclonal antibodies to the main immunogenic region of the nicotinic acetylcholine receptor bind to residues 61–76 of the α subunit. J Biol Chem. 1988;263:5916–5920. [PubMed] [Google Scholar]
- 12.Moise L, Piserchio A, Basus VJ, Hawrot E, Zeng H, Grant MA, Levandoski MM, Lin Y, McLaughlin JT, Cooper E. NMR structural analysis of α-bungarotoxin and its complex with the principal α-neurotoxin-binding sequence on the α7 subunit of a neuronal nicotinic acetylcholine receptor. J Biol Chem. 2002;277:12406–12417. doi: 10.1074/jbc.M110320200. [DOI] [PubMed] [Google Scholar]
- 13.Zeng H, Moise L, Grant MA, Hawrot E. The solution structure of the complex formed between α-bungarotoxin and an 18mer cognate peptide derived from the α1 subunit of the nicotinic acetylcholine receptor from Torpedo californica. J Biol Chem. 2001;276:22930–22940. doi: 10.1074/jbc.M102300200. [DOI] [PubMed] [Google Scholar]
- 14.Basus VJ, Song G, Hawrot E. NMR solution structure of an α-bungarotoxin/nicotinic receptor peptide complex. Biochemistry. 1993;32:12290–12298. doi: 10.1021/bi00097a004. [DOI] [PubMed] [Google Scholar]
- 15.Samson A, Scherf T, Eisenstein M, Chill J, Anglister J. The mechanism for acetylcholine receptor inhibition by α-neurotoxins and species-specific resistance to α-bungarotoxin revealed by NMR. Neuron. 2002;35:319–332. doi: 10.1016/s0896-6273(02)00773-0. [DOI] [PubMed] [Google Scholar]
- 16.Fruchart-Gaillard C, Gilquin B, Antil-Delbeke S, le Novere N, Tamiya T, Corringer PJ, Changeux JP, Menez A, Servent D. Experimentally based model of a complex between a snake toxin and the α7 nicotinic receptor. Proc Natl Acad Sci USA. 2002;99:3216–3221. doi: 10.1073/pnas.042699899. [DOI] [PMC free article] [PubMed] [Google Scholar]
- 17.Mordvintsev DY, Polyak YL, Kuzmine DA, Levtsova OV, Tourleigh YV, Kasheverov IE. A model for short α-neurotoxin bound to nicotinic acetylcholine receptor from Torpedo californica. J Mol Neurosci. 2006;30:71–72. doi: 10.1385/JMN:30:1:71. [DOI] [PubMed] [Google Scholar]
- 18.Taly A, Delarue M, Grutter T, Nilges M, le Novere N, Corringer PJ, Changeux JP. Normal mode analysis suggests a quaternary twist model for the nicotinic receptor gating mechanism. Biophys J. 2005;88:3954–3965. doi: 10.1529/biophysj.104.050229. [DOI] [PMC free article] [PubMed] [Google Scholar]
- 19.Unwin N. Refined structure of the nicotinic acetylcholine receptor at 4 Å resolution. J Mol Biol. 2005;346:967–989. doi: 10.1016/j.jmb.2004.12.031. [DOI] [PubMed] [Google Scholar]
- 20.Cheng X, Lu B, Grant B, Law RJ, McCammon JA. Channel opening motion of α7 nicotinic acetylcholine receptor as suggested by normal mode analysis. J Mol Biol. 2006;355:310–324. doi: 10.1016/j.jmb.2005.10.039. [DOI] [PubMed] [Google Scholar]
- 21.Cheng X, Ivanov I, Wang H, Sine SM, McCammon JA. Nanosecond time scale conformational dynamics of the human α7 nicotinic acetylcholine receptor. Biophys J. 2007;93:2622–2634. doi: 10.1529/biophysj.107.109843. [DOI] [PMC free article] [PubMed] [Google Scholar]
- 22.Shen Y, Kong Y, Ma J. Intrinsic flexibility and gating mechanism of the potassium channel KcsA. Proc Natl Acad Sci USA. 2002;99:1949–1953. doi: 10.1073/pnas.042650399. [DOI] [PMC free article] [PubMed] [Google Scholar]
- 23.Valadie H, Lacapcre JJ, Sanejouand YH, Etchebest C. Dynamical properties of the MscL of Escherichia coli: A normal mode analysis. J Mol Biol. 2003;332:657–674. doi: 10.1016/s0022-2836(03)00851-9. [DOI] [PubMed] [Google Scholar]
- 24.Bertaccini EJ, Trudell JR, Lindahl E. Normal-mode analysis of the glycine α1 receptor by three separate methods. J Chem Inf Model. 2007;47:1572–1579. doi: 10.1021/ci600566j. [DOI] [PMC free article] [PubMed] [Google Scholar]
- 25.Brejc K, van Dijk WJ, Klaassen RV, Schuurmans M, van der Oost J, Smit AB, Sixma TK. Crystal structure of an ACh-binding protein reveals the ligand-binding domain of nicotinic receptors. Nature. 2001;411:269–276. doi: 10.1038/35077011. [DOI] [PubMed] [Google Scholar]
- 26.Kaplan W, Littlejohn TG. Swiss-PDB viewer (deep view) Brief Bioinform. 2001;2:195–197. doi: 10.1093/bib/2.2.195. [DOI] [PubMed] [Google Scholar]
- 27.Chen R, Li L, Weng Z. ZDOCK: An initial-stage protein-docking algorithm. Proteins. 2003;52:80–87. doi: 10.1002/prot.10389. [DOI] [PubMed] [Google Scholar]
- 28.Lindahl E, Azuara C, Koehl P, Delarue M. NOMAD-Ref: Visualization, deformation and refinement of macromolecular structures based on all-atom normal mode analysis. Nucleic Acids Res. 2006;34:W52–W56. doi: 10.1093/nar/gkl082. [DOI] [PMC free article] [PubMed] [Google Scholar]
- 29.Bourne Y, Talley TT, Hansen SB, Taylor P, Marchot P. Crystal structure of a Cbtx–AChBP complex reveals essential interactions between snake α-neurotoxins and nicotinic receptors. EMBO J. 2005;24:1512–1522. doi: 10.1038/sj.emboj.7600620. [DOI] [PMC free article] [PubMed] [Google Scholar]
- 30.Dellisanti CD, Yao Y, Stroud JC, Wang ZZ, Chen L. Crystal structure of the extracellular domain of nAChR α1 bound to α-bungarotoxin at 1.94 Å resolution. Nat Neurosci. 2007;10:953–962. doi: 10.1038/nn1942. [DOI] [PubMed] [Google Scholar]
- 31.Krebs WG, Alexandrov V, Wilson CA, Echols N, Yu H, Gerstein M. Normal mode analysis of macromolecular motions in a database framework: Developing mode concentration as a useful classifying statistic. Proteins. 2002;48:682–695. doi: 10.1002/prot.10168. [DOI] [PubMed] [Google Scholar]
- 32.Taly A, Corringer PJ, Grutter T, Prado de Carvalho L, Karplus M, Changeux JP. Implications of the quaternary twist allosteric model for the physiology and pathology of nicotinic acetylcholine receptors. Proc Natl Acad Sci USA. 2006;103:16965–16970. doi: 10.1073/pnas.0607477103. [DOI] [PMC free article] [PubMed] [Google Scholar]
- 33.Gibb AJ. Textbook of Receptor Pharmacology. 2. CRC Press; London, U.K: 2003. [Google Scholar]
- 34.Fambrough DM, Drachman DB, Satyamurti S. Neuromuscular junction in myasthenia gravis: Decreased acetylcholine receptors. Science. 1973;182:293–295. doi: 10.1126/science.182.4109.293. [DOI] [PubMed] [Google Scholar]
- 35.Tzartos SJ, Remoundos MS. Precise epitope mapping of monoclonal antibodies to the cytoplasmic side of the acetylcholine receptor α subunit. Dissecting a potentially myasthenogenic epitope. Eur J Biochem. 1992;207:915–922. doi: 10.1111/j.1432-1033.1992.tb17124.x. [DOI] [PubMed] [Google Scholar]
- 36.Ming D, Wall ME. Interactions in native binding sites cause a large change in protein dynamics. J Mol Biol. 2006;358:213–223. doi: 10.1016/j.jmb.2006.01.097. [DOI] [PubMed] [Google Scholar]
- 37.Koradi R, Billeter M, Wuthrich K. MOLMOL: A program for display and analysis of macromolecular structures. J Mol Graph. 1996;14:51–55. doi: 10.1016/0263-7855(96)00009-4. [DOI] [PubMed] [Google Scholar]
- 38.Unwin N, Miyazawa A, Li J, Fujiyoshi Y. Activation of the nicotinic acetylcholine receptor involves a switch in conformation of the α subunits. J Mol Biol. 2002;319:1165–1176. doi: 10.1016/S0022-2836(02)00381-9. [DOI] [PubMed] [Google Scholar]
Associated Data
This section collects any data citations, data availability statements, or supplementary materials included in this article.