Abstract
Photodissociation with 157 nm light was implemented in an ABI model 4700 matrix-assisted laser desorption ionization (MALDI) tandem time-of-flight (TOF) mass spectrometer for peptide analysis. With a homemade computer program to control the light timing based on the m/z of each precursor ion, the photodissociation setup was seamlessly automated with the mass spectrometer. Peptide photodissociation in this apparatus yielded fragments similar to those observed in previous experiments with a homebuilt tandem-TOF mass spectrometer. Peptides having arginine at their C-termini yielded high-energy x-, v- and w- type fragments while peptides with N-terminal arginine produced many a- and d- type ions. Abundant immonium ions were also generated. High-quality photodissociation spectra were obtained with as little as 5 fmol of peptides. In the analysis of various tryptic peptides, photodissociation provided much more sequence information than the conventional TOF-TOF CID. Because of the high fragmentation efficiency, sensitivity was not sacrificed to achieve this.
Keywords: 157 nm photodissociation, peptide fragmentation, MALDI TOF-TOF
Introduction
Mass spectrometry (MS) has been widely used to investigate biological systems due to recent advances in both instrumentation and bioinformatics1. A number of MS-based techniques have been developed to characterize protein constituents in biological samples1-3. The most commonly used method involves tandem mass spectrometry (MS/MS) in which peptides enzymatically generated from proteins are fragmented and both the peptide and fragment masses are measured. Proteins are then identified by comparing the mass spectrometric data with predicted peptide and fragment masses derived from a protein sequence database4, 5.
A variety of ion activation techniques have been employed to fragment peptides6. Basically, they can be grouped into three categories: low-energy vibrational excitation using multiple collisions with neutral gas (CID)4, 7-9 or a single collision with a surface (SID)10, high-energy CID in a sector or tandem-TOF instrument11, 12, and radical induced dissociation by electron capture dissociation (ECD)13 or electron transfer dissociation (ETD)14. Low-energy vibrational activation preferentially cleaves the most labile peptide bonds, leading to b- and y- type ions. This process has been well described by a “mobile proton” model, in which an ionizing proton is mobilized upon activation and it moves to the backbone amide bonds to facilitate cleavage9. It has been further demonstrated that fragmentation is strongly affected by the sequence, charge state, and secondary structure of the precursor ion15-17. Since low-energy vibrational activation tends to cleave the weakest bonds, it cannot preserve information about labile phosphorylation sites and non-covalent bonding. High-energy CID involves precursor ions with substantial translational energy (keV range) colliding with neutral gas, leading to cleavage of less labile bonds via charge-remote processes11, 12, 18. However, low-energy b- and y- type fragments are also evident19. In addition, abundant internal fragments are observed in the low-mass region resulting from sequential fragmentation of primary fragments. Although high-energy CID generates rich sequence information, the spectra are often complex and difficult to interpret20. ECD and ETD involve a recombination of multiply-protonated species with an electron or an anion. Charge-reduced radical ions subsequently undergo radical-driven fragmentation, leading to abundant c- and z•-ions following cleavage of backbone N-Cα bonds14, 21. Since it is a nonergodic process, all N-Cα bonds except at proline can be homogeneously cleaved and weak bonding can also be preserved22, 23. Although these methods have usually been employed for “top-down” protein analyses, they can also be used to facilitate peptide sequencing because they generate fragments complementary to those of low-energy CID24. This is extremely beneficial for characterizing large highly-protonated peptide ions since low-energy CID of these ions generates very limited sequence information25. However, because ECD and ETD require multiply-charged precursor ions, they are not suitable for MALDI-generated ions.
Ultraviolet (UV) photodissociation of peptide ions is advantageous for its well defined energy deposition and compatibility with all mass analyzers26-35. We have recently demonstrated that photodissociation with 157 nm vacuum ultraviolet (VUV) light induces unusual high-energy fragments for a number of different biomolecules26, 27, 36-40. Photodissociation of singly-charged peptide ions leads to homolytic cleavage of backbone Cα-C(O) bonds, yielding a set of fragments that depend on the charge location. When the charge is at peptide C-termini, x-, y-, v- and w- type fragments are abundantly generated. When the charge is at peptide N-termini, a- and d- type ions are formed27. The distribution of photofragments yields high peptide sequence coverage. Photodissociation of singly-charged N-linked glycans produces not only low-energy glycosidic fragments but also cross-ring fragments that enable differentiation of isomeric glycans36, 37. 157 nm photodissociation has also been applied to characterize tryptic glycopeptides39. It has been demonstrated that the peptide and glycan fragment independently. Peptide fragments include x-, y-, v- and w- type ions that are similar to those obtained from unmodified peptides. In addition, both glycosidic and cross-ring glycan fragments are also observed. These fragments reveal information about the peptide sequence, glycosylation site and glycan structure. However, these unusual fragments were not observed for multiply-charged precursor ions. The latter yield thermal fragments similar to those commonly observed in low-energy CID experiments. To take advantage of the unique high-energy fragmentation induced by 157 nm photodissociation, mass spectrometers with a MALDI ion source are therefore highly preferred.
MALDI tandem-TOF mass spectrometry has been widely used for protein identification as an alternative to electrospray ionization (ESI) MS/MS because of its speed and high mass accuracy12, 41. Post-source decay (PSD) has been most commonly used for peptide fragmentation since MALDI-generated hot precursor ions tend to undergo metastable ion decay after ion acceleration42, 43. Similar to low-energy vibrational activation methods, PSD cleaves weak bonds, leading to primarily y- and b- type fragments along with some a-type ions. In order to increase sequence coverage, Keough and coworkers modified peptide N-termini with a sulfonic acid group that provides a highly mobile proton44, 45. Although the sulfonated peptides yield a complete series of y-type fragments upon activation, they lead to low precursor intensities in the positive MALDI ion mode because of their low ionization efficiency and high fragmentation tendency44. While high-energy CID is also available in TOF-TOF mass spectrometers, it has been pointed out that because of the low probability of collisions, most dissociation is induced by PSD instead of CID12, 20. As a result, TOF-TOF CID spectra look similar to PSD data. In light of these limitations, new activation methods for MALDI tandem-TOF mass spectrometers that generate highly informative and easily interpretable fragmentation spectra are desirable.
Although 157 nm peptide photodissociation in our homemade tandem-TOF mass spectrometer generates highly informative and predictable fragments26, 27, the instrument has relatively low sensitivity and throughput. It not only requires picomoles of peptides, but also takes considerable time to record and label spectra. Analysis of complex peptide mixtures requires a faster mass spectrometer with higher sensitivity. In this work, we implemented photodissociation in a commercial ABI 4700 MALDI TOF-TOF mass spectrometer. The instrument modification is straightforward and it primarily involves introduction of the photodissociation light into the collision cell after removal of the collision gas. A computer program was developed to control the photodissociation timing. Compatibility of the mass spectrometer with photodissociation was explored. For comparison with the homebuilt instrument, arginine-containing peptides were photodissociated and results were compared. The detection limit of the photodissociation mass spectrometer was evaluated by analyzing different quantities of standard peptides. In addition, to demonstrate the applicability of this technique for proteomic analysis, tryptic digests of a variety of model proteins were characterized without further separation.
Experimental
Material
Human hemoglobin, horse myoglobin, horse cytochrome C and bovine ubiquitin were purchased from Sigma (St. Louis, MO). Acetonitrile (ACN) and trifluoroacetic acid (TFA) were obtained from EMD Chemicals, Inc. (Gibbstown, NJ). α-cyano-4-hydroxycinnamic acid (CHCA) were bought from Sigma (St. Louis, MO). O-methylisourea was purchased from Acros Organics (NJ). Trypsin was obtained from Sigma (St. Louis, MO). Ammonium bicarbonate (ABC) was purchased from Sigma (St. Louis, MO).
Tryptic Digestion and Peptide Guanidination
Tryptic peptides from human hemoglobin, horse myoglobin, horse cytochrome C and bovine ubiquitin were generated using bovine trypsin. Stock solutions of proteins (100 uM) were prepared in 25 mM ABC. Tryptic digestion was performed by mixing 100 uL of protein solution with 5 ug of lyophilized trypsin. Each digestion was allowed to incubate at 37 °C overnight and the products were stored at -20 °C.
Peptides were guanidinated using O-methylisourea46. Guanidination reagent solution was made by dissolving 0.05g O-methylisourea in 51uL water. For each derivatization, 5 uL of peptide solution was mixed with 5.5uL ammonium hydroxide (7N) and 1.5 uL guanidination reagent. The pH of peptide solutions was about 10.6. The reaction was incubated at 65 °C for 5-10 minutes before being terminated by adding 15 uL 10% TFA (V/V). Reaction mixtures were dried by a speed vac before being stored at -20 °C.
Sample Preparation for MALDI Analysis
Both unmodified tryptic peptides and guanidinated peptides were analyzed. Unmodified peptide solutions were diluted into a concentration of 20 uM with water. 10 g/L CHCA in 49.95% ACN and 49.95% H2O with 0.1% TFA was prepared as the matrix solution. Peptides were mixed with the matrix solution in a ratio of 1:9 (V/V). A 0.5 uL aliquot was deposited on each MALDI spot. Guanidianted peptides were resuspended in water to make 10 uM solutions and were desalted by homemade microextraction zip-tip columns packed with C18-derivatized silica gel (Grace Vydac, Hesperia, CA) before MALDI analysis. In a typical experiment, 1 uL aliquots of peptide solutions were loaded onto zip-tip columns. After being washed by 0.1% TFA in water, peptides were released into 2 uL matrix solution. MALDI spots were made by depositing 0.5 uL aliquots of the peptide-matrix mixture onto a plate. For each peptide, two MALDI spots were created.
Mass Spectrometry
Photodissociation and PSD were performed on an ABI 4700 TOF-TOF mass spectrometer (Applied Biosystems, Framingham, MA). Vacuum ultraviolet (VUV) light was provided by an F2 laser (CompexPro F2, Coherent Lambda Physik, Germany). The laser was attached to the collision cell through a feed-through in the TOF-TOF main chamber. A computer program was developed to automate the photodissociation laser with the mass spectrometer. In a typical experiment, peptides are first analyzed by the reflectron-TOF and their masses are measured and stored in an integrated Oracle database by the mass spectrometer console software (4000 Explorer, Applied Biosystems, Framingham, MA). The computer program reads precursor mass information from the database and determines arrival times of precursor ions at the photodissociation region. In the MSMS mode, peptide ions of interest are isolated by a timed ion gate. At a time appropriate for each ion packet, a programmable delay generator (BNC model 555, Berkeley Nucleonics Corporation, San Rafael, CA) triggers the laser. A 10 mJ pulse of light (height 19 mm by width 6 mm, pulse width 10 ns) is typically produced. In order to achieve maximum light irradiation of precursor ions, the laser timing should be accurate to within 100 nanoseconds. Both precursor ions and PSD fragments are photo-excited. The resulting photofragments along with the remaining precursor ions and PSD fragments are then reaccelerated into the reflectron-TOF for mass measurement. Peptide PSD spectra are obtained with the photodissociation laser switched off. Currently this apparatus runs at 50 Hz because this is the maximum repetition rate of the F2 laser.
All tryptic peptide mixtures from model proteins were directly spotted onto a MALDI plate with CHCA as the matrix. Peptides were first analyzed in the MS mode to obtain mass information. The top ten strongest peaks from each mass spectrum were isolated for photodissociation. Each photodissociation spectrum was recorded by averaging 2000 MALDI shots which takes about 40 seconds. PSD spectra were recorded by averaging 2000 MALDI shots with the same MALDI laser intensity used in the photodissociation experiments. All spectra were processed in Data Explorer version 3.0 (Applied Biosystems, Framingham, MA) and then plotted by Origin version 7.0 (OriginLab, Northampton, MA). Peaks were found based on having a minimum signal-to-noise (S/N) ratio of 10. Peptide fragment masses were predicted using Protein Prospector (http://prospector.ucsf.edu).
Results
Photodissociation Timing
The timing of the photodissociation light is critical to photodissociation experiments in a TOF-TOF mass spectrometer since the ions are moving at high velocity orthogonal to the pulsed beam of laser light. Such timing control is not an issue in conventional CID experiments since the collision gas is always present in the collision cell during MS/MS experiments. In order to achieve maximum irradiation druing photodissociation experiments, the light should arrive when precursor ions are in the photodissociation region. The challenge is that ions of different mass fly at different velocities in TOF mass spectrometers. The arrival time (t) of an ion at the photodissociation region can be derived as follows. The velocity of an ion in a TOF mass spectrometer is approximately
where U, q and m represent the applied accelerating voltage, the charge and mass of the ion, respectively. Therefore, the arrival time at the photodissociation site is approximately
where L represents the distance between the MALDI source and the photodissociation region. It can be seen in Equation 2 that the arrival time of precursor ions is proportional to the square root of their mass to charge ratio. This simple relation can be used to set photodissociation timings for peptide ions. In order to draw a linear calibration curve, six standard peptides ranging from 800 to 3600 Da were photodissociated. Several photodissociation times were used for each peptide. The optimal one was chosen to be the time that led to maximum precursor depletion. A calibration curve relating to the photodissociation timing and the square root of the mass-to-charge ratio was found to be highly linear with an R-squared value of 0.9999. This calibration curve was used to set the photodissociation timing for peptides during all subsequent experiments.
C-Terminal Arginine-Containing Peptides
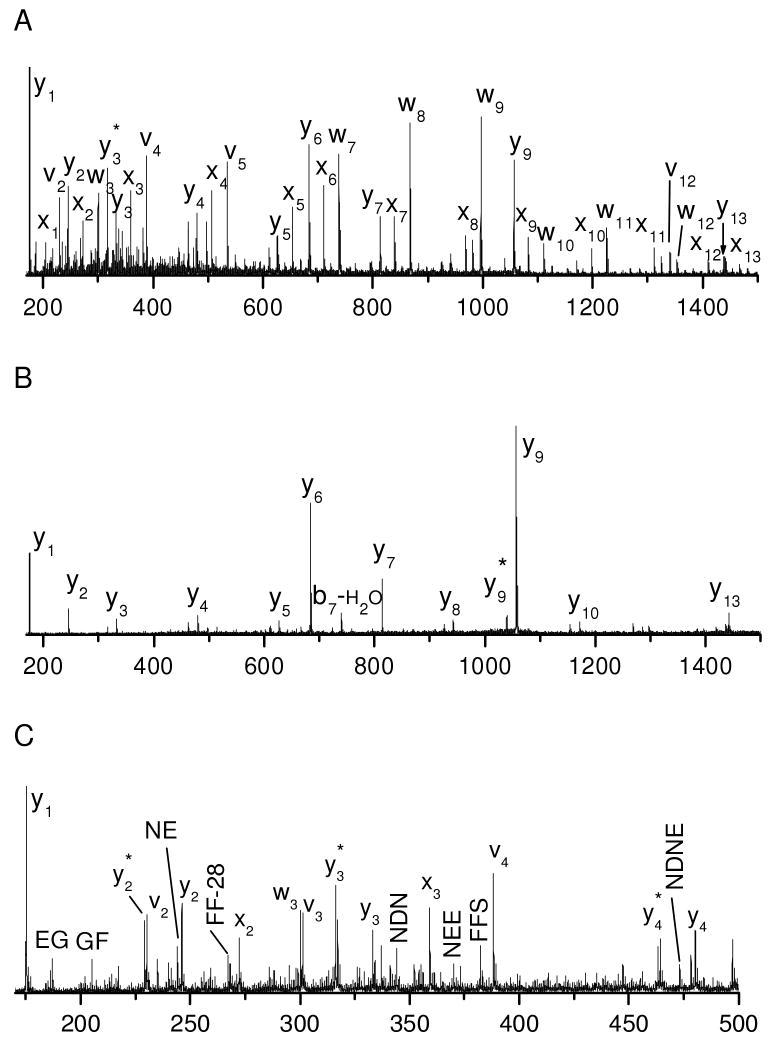
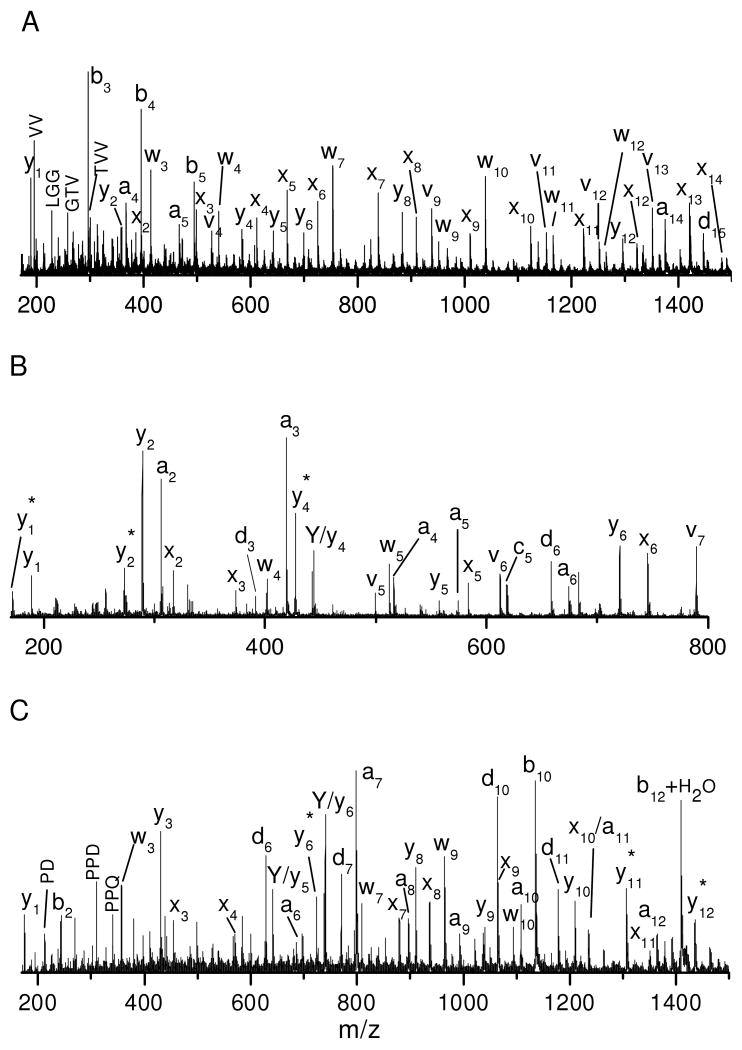
Hundreds of tryptic peptides have been analyzed by photodissociation in the modified 4700 TOF-TOF mass spectrometer with the automatic timing control described above. For comparison with previous results obtained with the homemade tandem-TOF mass spectrometer, peptide EGVNDNEEGFFSAR was chosen as a model peptide and its photodissociation spectrum is displayed in Figure 1A. Similar to previously reported results26, the spectrum is dominated by a series of x-type ions extending from x2 to x13 along with a few y-, v- and w- type ions. x-type ions correspond to cleavage of backbone Cα-C(O) bonds with the charge retained on the C-terminus. Since a complete series of x-type ions are observed, they can be used to derive the peptide sequence. v- and w- type ions are side-chain fragments. In addition to high-energy fragments, a series of y-type ions are also abundantly observed.
Figure 1.
(A) Photodissociation, (B) PSD and (C) the expanded view photodissociation spectra of peptide EGVNDNEEGFFSAR. (D) Photodissociation and (E) PSD spectra of tryptic peptide VNVDEVGGEALGR from human hemoglobin. Asterisk (*) denotes loss of ammonia in all figures.
The PSD fragmentation spectrum of this peptide is displayed in Figure 1B. It contains fewer fragments than the photodissociation spectrum. Several y-type ions are observed following cleavages of peptide backbone bonds. The high abundances of y6, y7, y9 and y13 ions are attributed to the enhanced backbone peptide bond cleavage C-terminal to acidic amino acids16, 47. The abundant production of y1 is facilitated by the proton sequestered on the C-terminal arginine. Although PSD is dominated by cleavage of the most labile bonds, several other y-type ions are also observed with low intensities.
Comparison of Figures 1A and 1B indicates that PSD fragments are also abundantly observed in the photodissociation spectrum. They are not removed by the timed ion gate in the mass spectrometer since they fly at the same velocities as precursor ions. However, since PSD fragments appear in spectra obtained with and without light excitation, they can easily be identified. It is noteworthy that PSD contributions were subtracted from photodissociation spectra in our previous work but not in this study. As a result, y-type ions rarely appeared in the previously reported photodissociation spectra while they are abundant in this work.
A series of low-abundance fragments appear in the Figure 1C photodissociation spectrum between 200 and 500 Da. These fragments do not result from photoionization of contaminants in the mass spectrometer since they are only observed when precursor ions are created by MALDI. They also do not appear in the PSD spectrum. A close examination shows that nearly all of these small fragments are internal peptide fragments and several are terminated with an acidic amino acid. Since formation of internal fragments requires cleavage of two peptide bonds, it is likely that they are secondary fragmentation products. Two types of secondary fragmentation processes can occur in a photodissociation experiment: thermal (i.e. ergodic) fragmentation of primary photofragments and photodissociation of PSD fragments. The latter results because PSD fragments are not separated from precursor ions as previously noted. The former process is expected since 157 nm light injects 7.9 eV of energy into precursor ions which is about twice the energy required to cleave a Cα-C(O) bond. The excess energy can lead to charge-driven fragmentations of labile peptide bonds that are facilitated by acidic amino acids16. Fortunately, these internal fragments are less abundant than primary photofragments.
Tryptic peptide VNVDEVGGEALGR from human hemoglobin was also photodissociated and the results are displayed in Figures 1D. Similar to Figure 1B, the photodissociation spectrum is dominated by a series of x- and y- type ions along with several v- and w- type ions. Eleven consecutive pairs of x- and y- type ions are observed. Observation of these ion pairs is very useful for confirming peak assignments. A few internal fragments and b-type ions also appear in the low mass region. For comparison, the PSD spectrum of this peptide is displayed in Figure 1E. It is dominated by several y-type ions along with a few b-type and internal fragment ions in the low mass region. Similar to Figure 1B, cleavage to form y-type ions tends to occur C-terminal to acidic amino acids. Two b-type ions, b2 and b4, are also evident. This is presumably because PSD processes involve a mobile proton that induces peptide backbone cleavage9. It is noteworthy that the internal fragments and the two b-type ions are more intense in the photodissociation spectrum than in the PSD spectrum. This indicates that some thermal fragmentation channels can be enhanced during photodissociation.
Although a few b-type and internal fragments are observed, photodissociation spectra of peptides with a C-terminal arginine are dominated by C-terminal photofragments. Arginine presumably sequesters the ionizing proton during photodissociation because of its high gas-phase basicity. Following peptide backbone Cα-C(O) bond cleavage, the C-terminal fragments bear the ionizing proton while the N-terminal fragments are neutral. As a result, C-terminal photofragments are primarily detected.
N-Terminal Arginine-Containing Peptides
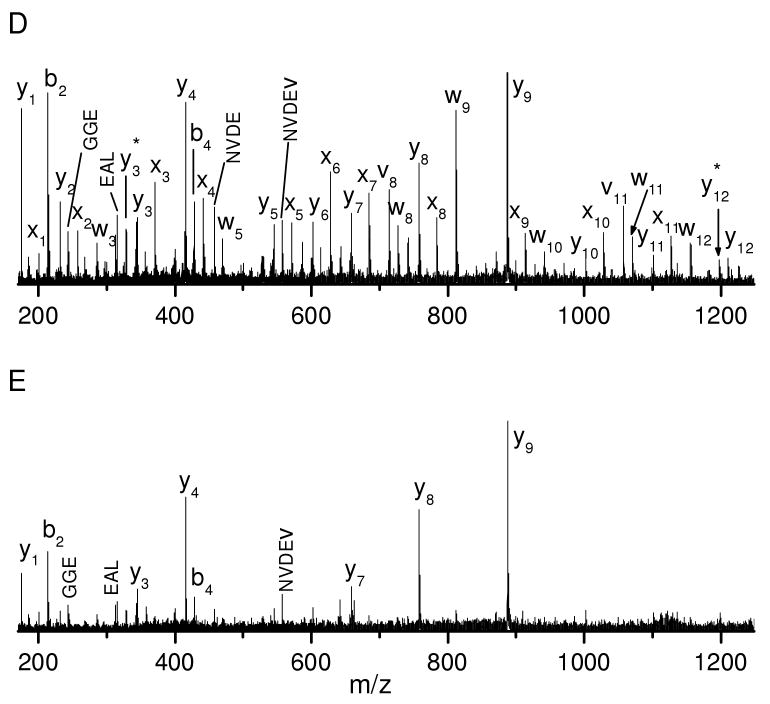
Peptides with an N-terminal arginine were also photodissociated. Figure 2A displays the photodissociation spectrum of peptide RPKPQQFFGLM. Similar to previously reported results27, 34, the spectrum is dominated by a series of a-type ions along with several d- type ions. a-type ions are formed via hydrogen elimination from a+1 radical ions that are directly generated by photodissociation. The a-type ion series extends from a2 to a10 except that a9, which is terminated by glycine, is missing. The a4 ion terminated by proline is low in abundance. These observations are consistent with our previous experiments in which proline and glycine do not favor a-type ion formation since a+1 radical ions terminated by these two residues each have only one type of hydrogen for β-elimination27, 48. It is noteworthy that the a2 ion is abundant although it is terminated by proline. This is likely because the a2 ion is also contributed by PSD. d-type ions are formed by releasing the β-substituent from the C-terminal amino acid side chain in a+1 radical ions and they are observed at non-aromatic residues except glycine, alanine and proline. This is also consistent with our previous results obtained in an ion trap mass spectrometer48. A small c2 ion is also observed and this is consistent with previous high-energy peptide CID results in which c-type ions were commonly formed N-terminal to lysine, serine and threonine49. Similar c-type ions were also observed following collisional dissociation of photolytically generated a+1 radical ions in an ion trap mass spectrometer and they appeared to be formed via a radical-driven dissociation pathway50. This suggests that c-type ions appearing in the photodissociation spectra are likely to be secondary fragmentation products of the primary a+1 radical ions. In addition, thermal b-type ions are observed following cleavage of peptide bonds. The peptide was also fragmented by PSD and the results are displayed in Figure 2B. The spectrum is dominated by b- and y- type ions. Although the ionizing proton is presumably initially located on the N-terminal arginine, two C-terminal y-type ions, y9 and y10, are formed. Apparently the proton is mobilized by the MALDI process, leading to N- or C-terminal fragments depending on the relocation of the charge. It is evident that photodissociation again yields many more fragments than PSD.
Figure 2.
(A) Photodissociation and (B) PSD spectra of peptide RPKPQQFFGLM. (C) Photodissociation and (D) PSD spectra of peptide RFSWGAEGQ.
The photodissociation spectrum of peptide RFSWGAEGQ is displayed in Figure 2C. Similar to Figure 2A, it is dominated by a series of a-type ions along with one b-type ion and a few d- type ions. The a-type ion series extends through the peptide sequence except for a5 and a8 that are terminated by glycine. Loss of ammonia from a-type ions is also occasionally observed. Once again, d- type ions are observed at all of the non-aromatic residues except alanine, glycine and the N-terminal arginine where the charge presumably resides. In addition, a small c2 ion is observed N-terminal to serine as discussed above. The b8+H2O ion corresponds to the thermal fragmentation of the peptide bond closest to the peptide C-terminus. It has previously been shown that this type of cleavage is facilitated by the C-terminal carboxylic group51. The PSD spectrum is displayed in Figure 2D. It is dominated by a series of b-type ions. The high abundance of the b7 ion is associated with the enhanced peptide bond dissociation at glutamic acid. Once again, the b8+H2O ion is observed.
It is evident that photodissociation and PSD yield completely different sets of fragments from peptides with an N-terminal arginine. Although some PSD fragments also appear in the photodissociation spectra, they are much less intense than the photofragments.
Lysine-Terminated Tryptic Peptides
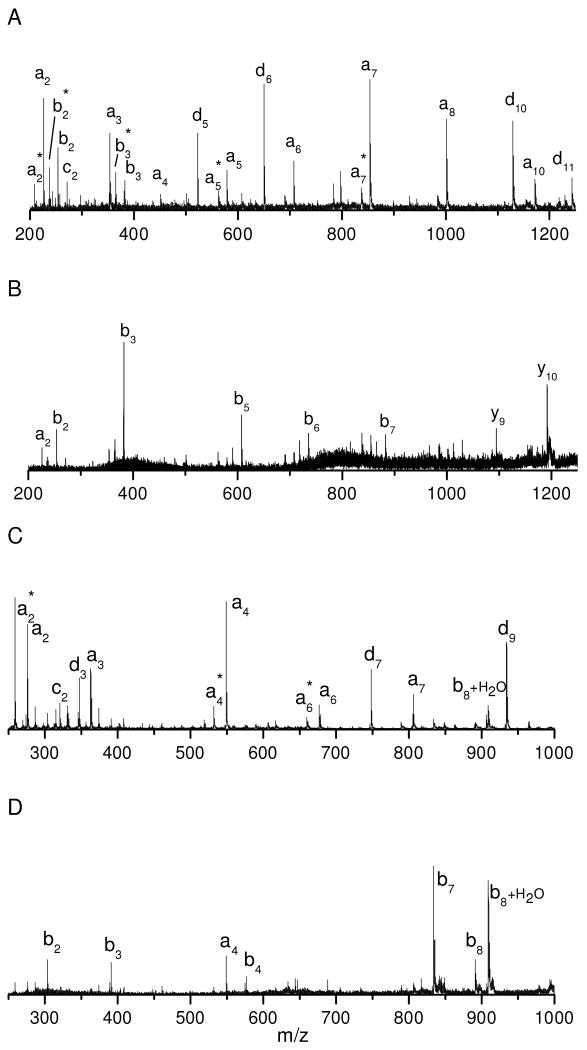
In order to demonstrate the capability of photodissociation to characterize tryptic peptides, lysine-terminated tryptic peptides were also investigated. In previous experiments, we showed that these lead to abundant thermal b- and y- type ions27. Figure 3A displays the photodissociation spectrum of tryptic peptide TGQAPGFTYTDANK from bovine cytochrome C. Similar to previous observations, the spectrum is dominated by thermal fragments including b- and y- type ions along with a few photofragments including three x-type ions (x8, x9 and x11) and two w-type ions (w7 and w12). This is strikingly different from the data on arginine-terminated peptides shown in Figures 1A and 1D. Formation of b- and y- type ions is primarily via charge-directed fragmentation pathways, indicating that the ionizing proton is not sequestered during photodissociation. This is reasonable since lysine is much less basic than arginine in the gas phase and it thus cannot sequester the ionizing proton during photoexcitation. To increase the gas-phase basicity, lysine was converted into homoarginine by guanidination46. The guanidinated peptide was then photodissociated and the results are displayed in Figure 3B. Similar to arginine-containing peptides in Figure 1, the spectrum is dominated by a series of x- and y- type ions along with several v- and w- type ions. Both x- and y- type ions provide high sequence coverage. Similar results were obtained with guanidinated peptides in a homebuilt tandem-TOF mass spectrometer27, 31, 34.
Figure 3.
Photodissociation spectra of (A) unmodified (B) guanidinated tryptic peptide TGQAPGFTYTDANK from bovine cytochrome C.
It is noteworthy that three x-type ions: x1, x10 and x13 are missing. x1 and x13 are terminal x-type ions that are found to be less abundant than other x-type ions. This is consistent with photodissociation spectra of peptides with C-terminal arginine (Figures 1A and 1D) in which most terminal x-type ions are also less intense than x-type ions appearing in the middle mass region. This is reasonable since the ABI 4700 TOF-TOF mass spectrometer appears to have best sensitivity in the mass range between 400 and 1200 Da during MS/MS experiments. In contrast, our homebuilt instrument generated intense x1 ion signals26, 27.
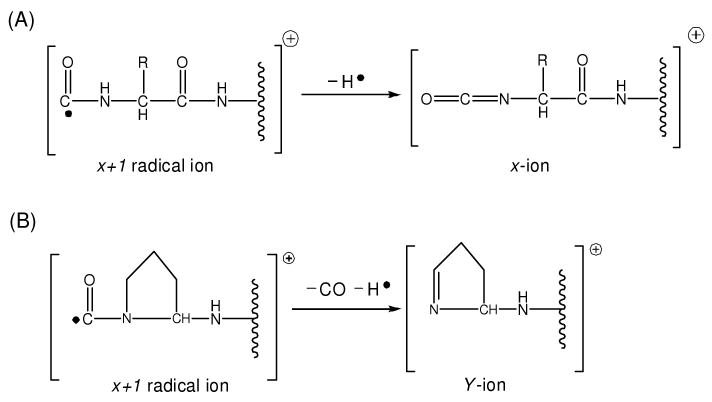
Instead of the x10 ion, a unique Y10 ion that is 2 Da lighter than the regular y-type ion is abundantly observed N-terminal to proline. In fact, Y-type ion formation N-terminal to proline has consistently been observed for all of peptides that we have analyzed26, 27. Its appearance can be explained by the radical chemistry involving x-type ions. It has been demonstrated that x-type ions in 157 nm photodissociation are generated from x+1 radical ions after a hydrogen is eliminated from the adjacent backbone amide nitrogen (Scheme 1A) 27. This formation pathway is apparently blocked at proline that has no such hydrogen. However, the x+1 radical ion can release a backbone CO and side chain β-hydrogen from proline to form a Y-type ion as depicted in Scheme 1B52. Since the resulting Y-type ion is 2 Da lighter than the y-type ion generated by PSD, observation of this pair of ions points to the presence of proline.
Scheme 1.
Tryptic Peptides with a Missed Cleavage
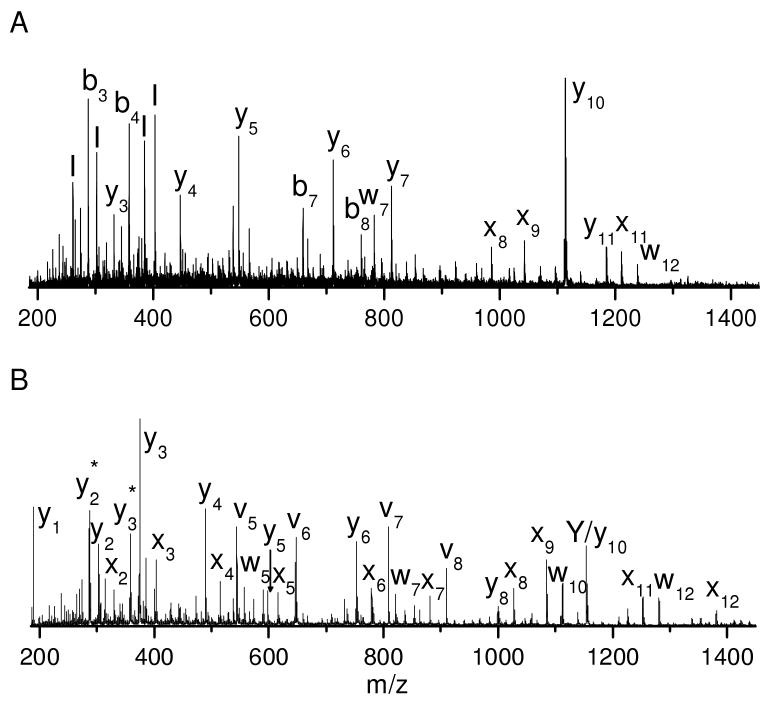
Missed cleavages often occur during tryptic digestion, leading to peptides with more than one lysine or arginine. Exploiting the high sensitivity of the commercial instrument, we photodissociated three tryptic peptides containing one missed cleavage. Figure 4A displays the photodissociation spectrum of tryptic peptide HGTVVLTALGGILKK from horse myoglobin after guanidination. Similar to peptides with C-terminal arginine or guanidinated lysine, the spectrum is dominated by a series of x- and y- type ions along with a few v- and w- type ions. The x-type ion series extends from x2 to x14. The x1 ion is missing apparently due to the lack of sensitivity in the low mass region. Several a- and b- type ions in the low mass region are mainly produced by postsource decay since they also appear in the PSD spectrum. In addition, two photofragments, a14 and d15 ions are evident in the high mass region, indicating that at least for a portion of the precursor ions, the ionizing proton resides on the penultimate guanidinated lysine. This is reasonable since the two guanidinated lysine residues should have similar gas-phase basicity.
Figure 4.
Photodissociation spectra of guanidinated tryptic peptides (A) HGTVVLTALGGILKK from horse myoglobin (B) KYIPGTK horse from cytochrome C and (C) IQDKEGIPPDQQR from bovine ubiquitin.
Figure 4B displays the photodissociation spectrum of peptide KYIPGTK from horse cytochrome C after guanidination. As one might expect, it contains both C- and N- terminal fragments. The x-type ion series extends from x2 to x6 except that x4 (at proline) is missing. Instead, a Y4 ion is again observed, consistent with previous observations. N-terminal fragments include a series of a-type ions extending from a2 to a6 along with two d-type ions: d3 and d6. The a5 ion appears in low abundance since it is terminated by glycine. Once again, a c5 ion is formed N-terminal to threonine as discussed previously. The appearance of all of these fragments indicates that the ionizing proton can be sequestered on either end of the peptide.
Figure 4C displays the photodissociation spectrum of peptide IQDKEGIPPDQQR from bovine ubiquitin after guanidination. Similar to Figure 4B, the spectrum contains both C-terminal and N-terminal fragments. The x-type ion series extends from x3 to x11 except for x5 and x6 at proline. Instead, Y5 and Y6 ions are again observed terminated by proline. N-terminal fragments include a-type ions extending from a6 to a12 along with several d-type ions. It is not clear why the a4 and a5 ions are missing. b10 and b12+H2O are also abundant and they are PSD fragments. The abundant production of b10 is due to the “aspartic acid effect” while the b12+H2O ion is enhanced by the C-terminal carboxylic group16, 51. In addition, several internal fragments are also observed in the low mass region.
In summary, when peptides contain more than one arginine or homoarginine, the ionizing proton can be sequestered on either residue. When two basic residues are adjacent, the products are similar to those from peptides with one basic residue. When the two basic residues are separate, both C- and N- terminal high-energy fragments are observed. Since the resulting a- and x- type ion series are complementary, observation of both can actually facilitate sequence interpretation. On the other hand, formation of too many products reduces sensitivity and complicates spectra. Complete tryptic digestion, without missed cleavages, is normally preferred for 157 nm photodissociation.
Sensitivity of Photodissociation
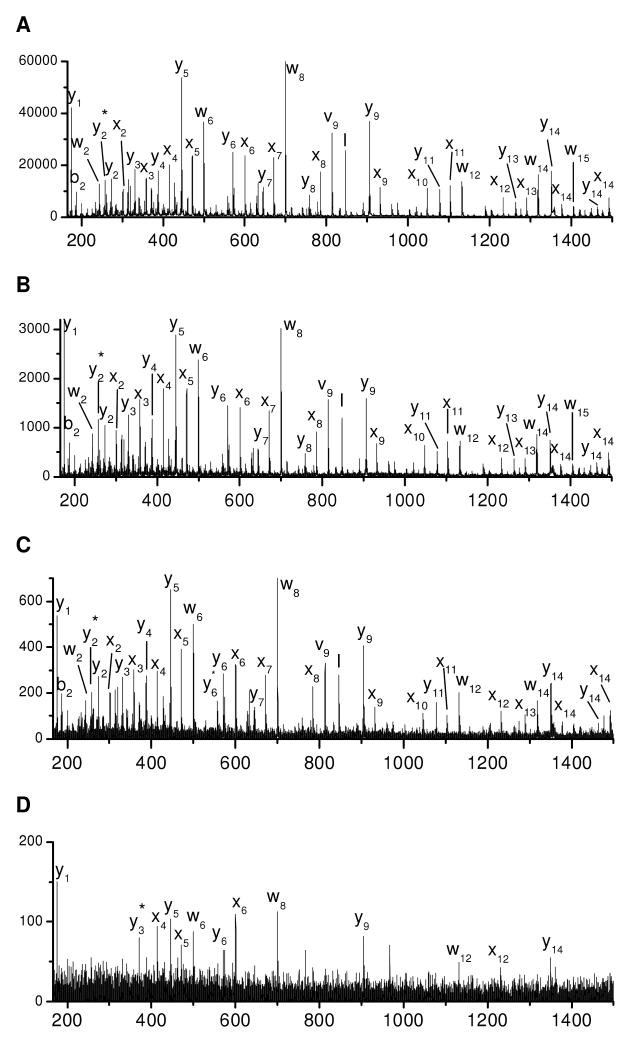
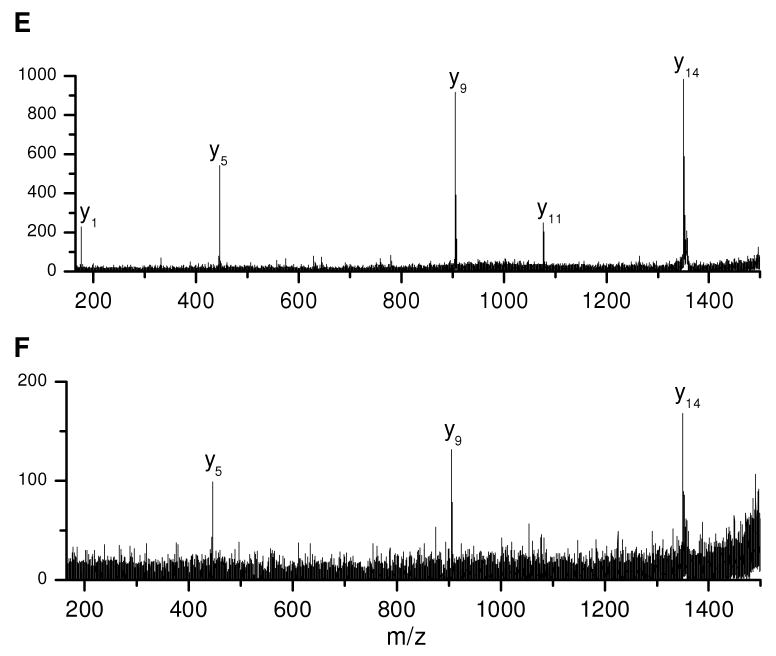
To investigate the detection limits of photodissociation mass spectrometry on this instrument, 500, 50, 5 and 0.5 fmol of peptide ADSGEGDFLAEGGGVR were deposited onto the sample probe and MALDI TOF-TOF mass spectra were recorded. The photodissociation spectra are displayed in Figures 5A-D. It is evident that the fragment intensities decrease with the quantity of the peptide. When the peptide quantity is 5 fmol or more, abundant fragments are observed including a series of x- and y- type ions along with several v- and w- type ions. However, only a few fragments are detected with 0.5 fmol of peptide. For at least this sample, at least 5 fmol of material are needed to generate spectra that provide complete sequence coverage. Although the PSD spectra of the same peptide show slightly better S/N ratios (Figures 5E and F), they contain fewer fragments than photodissociation. Two other peptides, EGVNDNEEGFFSAR and RFSWGAEGQ were also analyzed and they generated comparable photodissociation results. This indicates that photodissociation yields much more sequence information than PSD without sacrificing its sensitivity.
Figure 5.
Photodissociation spectra of (A) 500, (B) 50, (C) 5 and (D) 0.5 fmol fibrino-peptide ADSGEGDFLAEGGGVR. PSD spectra of (E) 5 and (F) 0.5 fmol of the same peptide.
Photodissociation efficiency was further measured by the depletion of precursor ions. In order to measure precursor ion intensities, the precursor ion suppression function offered by the commercial instrument was turned off and the digitizer scale adjusted to ensure that the precursor ion peak (which is the highest peak in PSD spectra after switching off the precursor ion suppression function) is fully digitized. FSWGAEGQR was used as a model peptide. Precursor ion intensities were measured before and after photodissociation and six replicate experiments were performed. To minimize shot-shot variations induced by MALDI, the highest and lowest of the six measured intensities were discarded. The depletion ratios of precursor ions were then derived using average precursor ion intensities. For this peptide, 45±7% precursor ion depletion was achieved. The depletion ratios of two other peptides were also within this range.
Differentiation of Leucine and Isoleucine
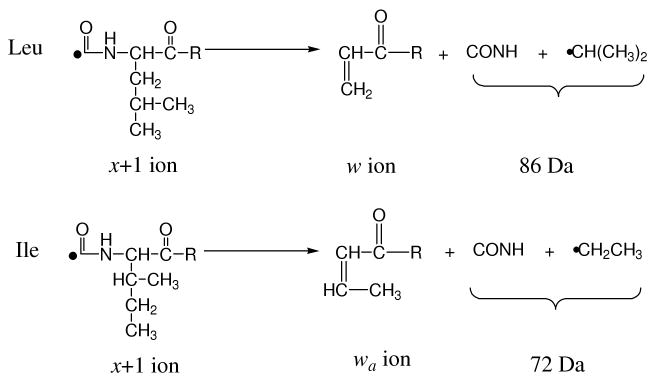
Leucine (Leu) and Isoleucine (Ile) are the only pair of isomers among the twenty naturally occurring amino acids. Remarkably, 16.7% of amino acids in nature are one of these two residues53 and they cannot be distinguished by low-energy peptide fragmentation. However, in high-energy tandem mass spectrometry, the isomeric side chains of leucine and isoleucine fragment differently as shown in Scheme 354.
Scheme 3.
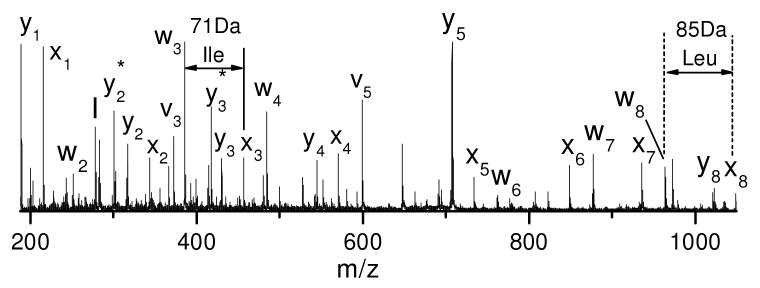
157 nm photodissociation can distinguish leucine and isoleucine since it yields abundant side-chain fragments including d- and w- type ions26, 27, 34. A good example is the photodissociation spectrum of VNVDEVGGEALGR (Figure 1D). Observation of x3 and y3 ions identifies the third residue from the C-terminus as leucine or isoleucine and the detection of the w3 ion clearly specifies the former. Another example of this is guanidinated TLSDYNIQK whose photodissociation spectrum is displayed in Figure 6. Similar to previous examples, the spectrum is dominated by a series of x- and y- type ions along with several w-, v- type ions. Observation of the w3 and w8 ions unambiguously distinguishes leucine and isoleucine at these two positions. The isoleucine is further confirmed by the observation of the v3 ion.
Figure 6.
Photodissociation spectra of guanidinated tryptic peptide TLSDYNIQK from bovine ubiquitin.
Immonium and Related Characteristic Ions
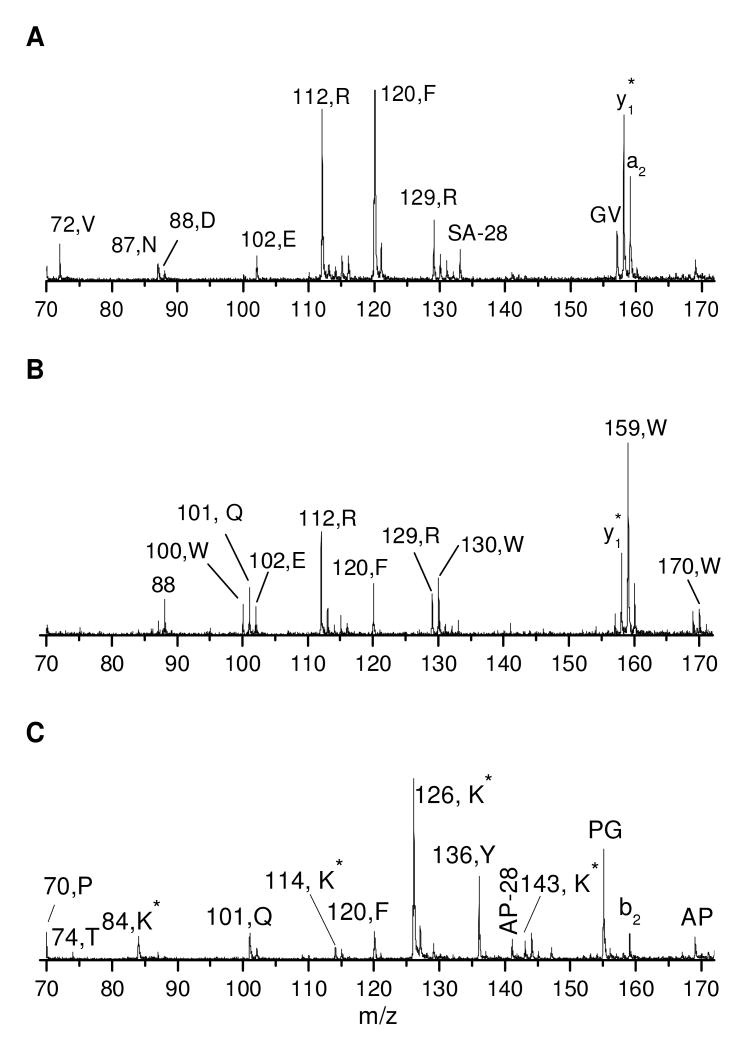
In previous experiments involving peptide photodissociation, we observed abundant immonium ions in the low mass region31. For comparison, the low mass regions of photodissociation spectra obtained with the commercial instrument were also plotted. Figure 7A displays the result for peptide EGVNDNEEGFFSAR. It is dominated by two peaks of 112 Da and 120 Da. The former corresponds to a characteristic ion of arginine while the latter is the immonium ion of phenylalanine. The occurrence of these ions is consistent with previous high-energy CID experiments55. In fact, all of amino acids in this sequence are represented by an immonium or related characteristic ion except for glycine, alanine and serine. This is reasonable since the immonium ions from these three residues are below 70 Da. The commercial instrument is not set up to record this region of the spectrum. Figure 7B displays the low mass region of the photodissociation spectrum of peptide FSWGAEGQR. It contains immonium or related characteristic ions from most of the amino acids in the sequence. Once again, those from glycine, alanine and serine are missing. It is noteworthy that the tryptophan residue leads to an immonium ion (159 Da) along with three characteristic ions (100, 130 and 170 Da), consistent with previous high-energy CID experiments55. Figure 7C displays the low mass region of the photodissociation spectrum of peptide TGQAPGFTYTDANK after guanidination. In this Figure, K* denotes homoarginine. Similar to spectra of arginine-terminated peptides, it contains an immonium or related characteristic ion from most of the amino acids. Besides glycine and alanine, immonium ions associated with asparagine and aspartic acid are also missing. This is consistent with previously reported high-energy CID results55. It implies that immonium ion formation may be helpful for peptide identification, but it is certainly not comprehensive. It is noteworthy that homoarginine leads to an immonium ion (143 Da) as well as two characteristic ions (84 and 126 Da) that are each 14 Da heavier than those of arginine. These are unique masses that have not been observed from peptides without homoarginine. Their observation could enable homoarginine and arginine residues at peptide C-termini to be readily distinguished.
Figure 7.
Low mass regions in the photodissociation spectra of peptide (A) EGVNDNEEGFFSAR, (B) FSWGAEGQR and (C) TGQAPGFTYTDANK after guanidination.
Immonium or related characteristic ions have been observed from most amino acids except glycine, alanine, and serine. Since most of these ions are unique to amino acids and are easily identified, they can provide information about peptide composition. As noted previously, immonium and related characteristic ions are able to confirm the identification of the C-terminal residue of tryptic peptides even if an x1 ion is not observed. In addition, identification of several amino acids in a peptide could be used to constrain peptide identification results derived by either database-searching or de novo sequencing algorithms. However, not every amino acid in a sequence leads to an abundant immonium or related characteristic ion (e.g. D and N in Figure 7C). As a result, absence of an immonium ion cannot be used to rule out the presence of the corresponding amino acid.
Discussion
We have demonstrated that photodissociation in the ABI 4700 MALDI TOF-TOF mass spectrometer yields fragments similar to those obtained with a homebuilt tandem-TOF instrument. For peptides with C-terminal arginine, abundant x-, v- and w- type ions are observed. For peptides with N-terminal arginine, a- and d- type ions are abundant. In addition to photofragments, PSD fragments are also abundant in the photodissociation spectra since they are not be removed by the timed ion gate. In our previous work, the contribution of PSD fragments was largely removed by subtracting the PSD spectrum from the photodissociation spectrum26, 31. However, because of shot-shot variations induced by MALDI, this was optimally done by taking alternate shots with and without the photodissociation laser, recording the alternate spectra in separate data buffers and then subtracting them. While this was possible to do with a data acquisition system developed in-house, it was not feasible in the commercial instrument since that would require modification of the instrument's console software. Therefore, in this work, we did not remove PSD fragments from photodissociation spectra. In fact, the PSD fragments can be used to confirm peak assignments since they are complementary to photofragments.
Photodissociation in the commercial mass spectrometer offers several advantages. First, it has a high sensitivity that is comparable to that of conventional TOF-TOF CID. It can record high-quality spectra with as little as 5 fmol of peptides. With this sensitivity, photodissociation can handle most low-abundant proteins present in biological systems. Second, it also benefits from the commercial instrument's high throughput. Since the photodissociation timing is automatically controlled by a computer program, the photodissociation setup is automated with the ABI 4700 TOF-TOF mass spectrometer. Both gel-based and LC/MALDI MS/MS experiments can be performed. The repetition rate of this apparatus is 50 Hz and it is mainly limited by the F2 laser. It takes about 40 seconds to record a spectrum by averaging 2000 MALDI shots. Higher throughput could be achieved if a laser with higher repetition rate was used. Nevertheless, this apparatus is fast enough to analyze large-scale peptide mixtures following LC separation.
It is noteworthy that although photodissociation generates many more fragments than PSD, it does not sacrifice sensitivity to achieve this. Comparison of photodissociation and PSD spectra (e.g. in Figures 1 and 2) indicates that most photofragments have intensities similar to those of b- and y- type fragments in PSD spectra. This is reasonable since photodissociation converts about half of the remaining precursor ions after postsource decay into fragments as evidenced by the precursor ion depletion ratios. As a result, photodissociation has much higher fragmentation efficiency than PSD. Thus photodissociation does not sacrifice sensitivity by producing many more fragments than PSD.
Conclusions
157 nm photodissociation was implemented in an ABI 4700 MALDI TOF-TOF mass spectrometer and the whole system was automated using a programmable delay generator along with a timing control program developed in house. Photodissociation spectra recorded in the commercial instrument are dominated by a series of high-energy fragments depending on the charge location along with some PSD fragments, consistent with previously reported results26, 27, 34. Abundant immonium ions are also observed in the low mass region. With the high sensitivity of the commercial instrument, informative tandem mass spectra can be recorded with as little as 5 fmol of peptides. Although this sensitivity is comparable to that of the conventional TOF-TOF PSD, photodissociation leads to many more fragments. With this system, various tryptic peptides have been characterized in an automated mode, leading to highly informative fragments. By retaining the speed, sensitivity and spectral quality of the commercial instrument, photodissociation is found to be an alternative to CID/PSD in a tandem-TOF mass spectrometer.
Acknowledgments
This work was supported by NSF grant CHE-0518234 and the NIH/NCRR National Center for Glycomics and Glycoproteomics (NCGG) grant number RR018942.
References
- 1.Aebersold R, Goodlett DR. Chem Rev. 2001;101:269–295. doi: 10.1021/cr990076h. [DOI] [PubMed] [Google Scholar]
- 2.Yates JR. J Mass Spectrom. 1998;33:1–19. doi: 10.1002/(SICI)1096-9888(199801)33:1<1::AID-JMS624>3.0.CO;2-9. [DOI] [PubMed] [Google Scholar]
- 3.Aebersold R, Mann M. Nature. 2003;422:198–207. doi: 10.1038/nature01511. [DOI] [PubMed] [Google Scholar]
- 4.Hunt DF, Yates JR, Shabanowitz J, Winston S, Huauer CR. Proc Natl Acad Sci U S A. 1986;83:6233–6237. doi: 10.1073/pnas.83.17.6233. [DOI] [PMC free article] [PubMed] [Google Scholar]
- 5.Biemann K, Schoble HA. Sciecne. 1987;237:992–998. doi: 10.1126/science.3303336. [DOI] [PubMed] [Google Scholar]
- 6.Sleno L, Volmer DA. J Mass Spectrom. 2004;39:1091–1112. doi: 10.1002/jms.703. [DOI] [PubMed] [Google Scholar]
- 7.Burlet O, Orkiszewski RS, Ballard KD, Gaskell SJ. Rapid Commun Mass Spectrom. 1992;6:658–662. doi: 10.1002/rcm.1290061106. [DOI] [PubMed] [Google Scholar]
- 8.Johnson RS, Martin SA, Biemann K. Int J Mass Spectrom Ion Process. 1998;86:137–154. [Google Scholar]
- 9.Wysocki VH, Tsaprailis G, Simth LL, Breci LA. J Mass Spectrom. 2000;35:1399–1406. doi: 10.1002/1096-9888(200012)35:12<1399::AID-JMS86>3.0.CO;2-R. [DOI] [PubMed] [Google Scholar]
- 10.Dongre AR, Somogyi A, Wysocki VH. J Mass Spectrom. 1996;31:339–350. doi: 10.1002/(SICI)1096-9888(199604)31:4<339::AID-JMS322>3.0.CO;2-L. [DOI] [PubMed] [Google Scholar]
- 11.Waugh RJ, Bowie JH, Gross ML. Rapid Commun Mass Spectrom. 1993;7:623–625. [Google Scholar]
- 12.Medzihradszky KF, Campbell JM, Baldwin MA, Falick AM, Juhasz P, Vestal ML, Burlingame AL. Anal Chem. 2000;72:552–558. doi: 10.1021/ac990809y. [DOI] [PubMed] [Google Scholar]
- 13.Zubarev RA, Kelleher NL, McLafferty FW. J Am Chem Soc. 1998;120:3265–3266. [Google Scholar]
- 14.Syka JEP, Coon JJ, Schroeder MJ, Shabanowitz J, Hunt DF. Proc Natl Acad Sci U S A. 2004;101:9528–9533. doi: 10.1073/pnas.0402700101. [DOI] [PMC free article] [PubMed] [Google Scholar]
- 15.Dongre AR, Jones JL, Somogyi A, Wysocki VH. J Am Chem Soc. 1996;118:8365–8374. [Google Scholar]
- 16.Tsaprailis G, Nair H, Somogyi A, Wysocki VH, Zhong W, Futrell JH, Summerfield SG, Gaskell SJ. J Am Chem Soc. 1999;121:5142–5154. [Google Scholar]
- 17.Kapp EA, Schutz F, Reid GE, Eddes JS, Moritz RL, O'Hare RAJ, Speed TP, Simpson RJ. Anal Chem. 2003;75:6251–6264. doi: 10.1021/ac034616t. [DOI] [PubMed] [Google Scholar]
- 18.Johnson RS, Martin SA, Biemann K. Int J Mass Spectrom Ion Process. 1988;86:137–154. [Google Scholar]
- 19.Cheng CF, Gross ML. Mass Spectrom Rev. 2000;19:398–420. doi: 10.1002/1098-2787(2000)19:6<398::AID-MAS3>3.0.CO;2-B. [DOI] [PubMed] [Google Scholar]
- 20.Yergey AL, Coorssen JR, Backlund PS, Blank PS, Humphrey GA, Zimmerberg J, Campbell JM, Vestal ML. J Am Soc Mass Spectrom. 2002;13:784–791. doi: 10.1016/S1044-0305(02)00393-8. [DOI] [PubMed] [Google Scholar]
- 21.Zubarev RA, Kelleher NL, McLafferty FW. J Am Chem Soc. 1998;120:3265–3266. [Google Scholar]
- 22.Stensballe A, Jensen ON, Olsen JV, Haselmann KF, Zubarev RA. Rapid Commun Mass Spectrom. 2000;14:1793–1800. doi: 10.1002/1097-0231(20001015)14:19<1793::AID-RCM95>3.0.CO;2-Q. [DOI] [PubMed] [Google Scholar]
- 23.Shi SDH, Hemling ME, Carr SA, Horn DM, Lindh I, McLafferty FW. Anal Chem. 2001;73:19–22. doi: 10.1021/ac000703z. [DOI] [PubMed] [Google Scholar]
- 24.Nielsen ML, Savitski MM, Zubarev RA. Mol Cell Proteomics. 2005;4:835–845. doi: 10.1074/mcp.T400022-MCP200. [DOI] [PubMed] [Google Scholar]
- 25.Swaney DL, McAlister GC, Coon JJ. Nature Methods. 2008;5:959–964. doi: 10.1038/nmeth.1260. [DOI] [PMC free article] [PubMed] [Google Scholar]
- 26.Thompson MS, Cui W, Reilly JP. Angew Chem Int Ed. 2004;43:4791–4794. doi: 10.1002/anie.200460788. [DOI] [PubMed] [Google Scholar]
- 27.Cui W, Thompson MS, Reilly JP. J Am Soc Mass Spectrom. 2005;16:1384–1398. doi: 10.1016/j.jasms.2005.03.050. [DOI] [PubMed] [Google Scholar]
- 28.Morgan JW, Hettick JM, Russell DH. Biol Mass Spectrom. 2005;402:186–209. doi: 10.1016/S0076-6879(05)02006-9. [DOI] [PubMed] [Google Scholar]
- 29.Kjeldsen F, Silivra OA, Zubarev RA. Chem Eur J. 2006;12:7920–7928. doi: 10.1002/chem.200600248. [DOI] [PubMed] [Google Scholar]
- 30.Joly L, Antoine R, Broyer M, Dugourd P, Lemoine J. J Mass Spectrom. 2007;42:818–824. doi: 10.1002/jms.1222. [DOI] [PubMed] [Google Scholar]
- 31.Thompson MS, Cui W, Reilly JP. J Am Soc Mass Spectrom. 2007;18:1439–1452. doi: 10.1016/j.jasms.2007.04.015. [DOI] [PubMed] [Google Scholar]
- 32.Ly T, Julian RR. J Am Chem Soc. 2008;130:351–358. doi: 10.1021/ja076535a. [DOI] [PubMed] [Google Scholar]
- 33.Wilson JJ, Kirkovits GJ, Sessler JL, Brodbelt JS. J Am Soc Mass Spectrom. 2008;19:257–260. doi: 10.1016/j.jasms.2007.10.024. [DOI] [PMC free article] [PubMed] [Google Scholar]
- 34.Reilly JP. Mass Spectrom Rev. 2009;28:425–447. doi: 10.1002/mas.20214. [DOI] [PMC free article] [PubMed] [Google Scholar]
- 35.Morgan JW, Russell DH. J Am Soc Mass Spectrom. 2006;17:721–729. doi: 10.1016/j.jasms.2006.02.004. [DOI] [PubMed] [Google Scholar]
- 36.Devakumar A, Mechref Y, Kang P, Reilly JP. J Am Soc Mass Spectrom. 2008;19:1027–1040. doi: 10.1016/j.jasms.2008.03.005. [DOI] [PMC free article] [PubMed] [Google Scholar]
- 37.Devakumar A, O'Dell DK, Walker JM, Reilly JP. J Am Soc Mass Spectrom. 2008;19:14–26. doi: 10.1016/j.jasms.2007.10.003. [DOI] [PubMed] [Google Scholar]
- 38.Zhang L, Reilly JP. J Am Soc Mass Spectrom. 2008;19:695–702. doi: 10.1016/j.jasms.2008.01.011. [DOI] [PubMed] [Google Scholar]
- 39.Zhang L, Reilly JP. J Proteome Res. 2009;8:734–742. doi: 10.1021/pr800766f. [DOI] [PMC free article] [PubMed] [Google Scholar]
- 40.Zhang L, Reilly JP. Proceedings of the 55th ASMS Conference on Mass Spectrometry and Applied Topics; Indianapolis, IN. June 3-7; 2007. [Google Scholar]
- 41.Zhen Y, Xu N, Richardson B, Becklin R, Savage JR, Blake K, Peltier JM. J Am Soc Mass Spectrom. 2004;15:803–822. doi: 10.1016/j.jasms.2004.02.004. [DOI] [PubMed] [Google Scholar]
- 42.Kaufmann R, Kirsch D, Spengler B. Int J Mass Spectrom Ion Process. 1994;131:355–384. [Google Scholar]
- 43.Kaufmann R, Spengler B, Lutzenkirchen F. Rapid Commun Mass Spectrom. 1993;7:902–910. doi: 10.1002/rcm.1290071010. [DOI] [PubMed] [Google Scholar]
- 44.Keough T, Youngquist RS, Lacey MP. Proc Natl Acad Sci U S A. 1999;96:7131–7136. doi: 10.1073/pnas.96.13.7131. [DOI] [PMC free article] [PubMed] [Google Scholar]
- 45.Bauer MD, Sun Y, Keough T, Lacey MP. Rapid Commun Mass Spectrom. 2000;14:924–929. doi: 10.1002/(SICI)1097-0231(20000530)14:10<924::AID-RCM967>3.0.CO;2-X. [DOI] [PubMed] [Google Scholar]
- 46.Beardsley RL, Karty JA, Reilly JP. Rapid Commun Mass Spectrom. 2000;14:2147–2153. doi: 10.1002/1097-0231(20001215)14:23<2147::AID-RCM145>3.0.CO;2-M. [DOI] [PubMed] [Google Scholar]
- 47.Tsaprailis G, Somogyi A, Nikolaev EN, Wysocki VH. Int J Mass spectrom. 2000;195/196:467–479. [Google Scholar]
- 48.Zhang L, Cui W, Thompson MS, Reilly JP. J Am Soc Mass Spectrom. 2006;17:1315–1321. doi: 10.1016/j.jasms.2006.06.007. [DOI] [PubMed] [Google Scholar]
- 49.Downard KM, Biemann K. J Am Soc Mass Spectrom. 1993;4:874–881. doi: 10.1016/1044-0305(93)87005-W. [DOI] [PubMed] [Google Scholar]
- 50.Zhang L, Reilly JP. J Am Soc Mass Spectrom. 2009;20:1378–13901. doi: 10.1016/j.jasms.2009.03.026. [DOI] [PubMed] [Google Scholar]
- 51.Sharp JS, Tomer KB. J Am Soc Mass Spectrom. 2005;16:607–621. doi: 10.1016/j.jasms.2005.01.016. [DOI] [PubMed] [Google Scholar]
- 52.Cui W, Thompson MS, Reilly JP. Nashiville, TN: 2004. [Google Scholar]
- 53.Kjeldsen F, Haselmann KF, Sorensen ES, Zubarev RA. Anal Chem. 2003;75:1267–1274. doi: 10.1021/ac020422m. [DOI] [PubMed] [Google Scholar]
- 54.Johnson RS, Martin SA, Biemann K, Stults JT, Watson JT. Anal Chem. 1987;59:2621–2625. doi: 10.1021/ac00148a019. [DOI] [PubMed] [Google Scholar]
- 55.Falick AM, Hines WM, Medzihradszky KF, Baldwin MA, Gibson BW. J Am Soc Mass Spectrom. 1993;4:882–893. doi: 10.1016/1044-0305(93)87006-X. [DOI] [PubMed] [Google Scholar]


