

Abstract
Electroporation is a common technique for the introduction of exogenous molecules across the, otherwise, impermeant cell membrane. Conventional techniques are limited by either low throughput or limited selectivity. Here we present a novel technique whereby we use patterned light to create virtual electrodes which can induce the parallel electroporation of single cells. This technique seamlessly integrates with optoelectronic tweezers to provide a single cell manipulation platform as well. We present evidence of parallel, single cell electroporation using this method through use of fluorescent dyes and dielectrophoretic responses. Additionally, through the use of integrated microfluidic channels, we show that cells remain viable following treatment in the device. Finally, we determine the optimal field dosage to inject propidium iodide into a HeLa cell and maintain cellular viability.
Introduction
There has been an increasing amount of interest in the past decade in creating a system capable of performing single cell based assays for a variety of applications. One interesting application involves the creation of a chip with integrated cell membrane poration functionality. The ability to introduce foreign molecules into the intra-cellular space is important in applications ranging from genetic transfection to the study of cell-to-cell signaling.1,2
One of the most common membrane poration methods is electroporation. Temporary permeation of the cellular membrane is achieved in electroporation by subjecting the cell to an external electric field. If the field strength is large enough, it causes a temporary depolarization of the cell's bi-lipid membrane. This results in the formation of pores which allow molecules in the extra-cellular space to pass across the otherwise impermeable membrane. These molecules pass through the pores typically by either passive diffusion or field-assisted migration. The size and number of pores is highly dependent on field strength. It is typically understood that, in order for the membrane to reseal, the pores must be nano-scopic in diameter.3 The theory behind the exact nature of pore formation and lifetime is not thoroughly understood. The most common theories involve modeling pore evolution as a stochastic process by which pores form and then drift and diffuse when exposed to high electric fields.4
Current commercial techniques involve either the bulk5 or individual6 electroporation of cells. These techniques are limited by either limited selectivity (bulk) or low throughput (individual), respectively. Many of these issues stem from the fact that macroscopic instruments are being designed to interface with microscopic objects, namely cells. As a result, much work is being performed to shrink the interface to the microscale.
Prior work on creating micro-poration platforms can be divided into four categories. The first, microelectrode electroporation, is the simplest technique and allows for high throughput electroporation with improved selectivity through the use of individually addressable microelectrodes.7–9 However, it does not achieve true single cell selectivity. Here we define single cell selectivity as the ability to selectively porate a single cell amongst a greater population of cells. The second method involves creating microstructures which physically concentrate the field across the cell of interest.10–12 These devices can afford high throughput as well as allow for different drugs to be injected into different cells, simultaneously. However, there is no mechanism for achieving single cell selectivity from a population of cells and cells cannot be porated in-situ. Optoporation is the third option and allows for single cell poration in-situ simply by moving a focused laser beam from one cell to another.9,13–15 However, it is difficult to parallelize the poration as multiple expensive lasers would be necessary. Though, there is promising work in this field that reduces the required optical power by coupling to nanoparticle arrays.16 Yet another technique employed in microfluidic devices is chemical poration.17 Here, cells are subjected to chemical stimuli resulting in membrane poration. A major caveat of this method is the variation of cytotoxicity of the poration chemical with cell type.18 Finally, microinjection affords single cell poration, with accurate dosage control, which none of the other techniques allow for. However, this technique requires a skilled user and is, generally, low throughput.19
Here we present a novel technique for the in situ electroporation of single cells in parallel. By using a photosensitive surface, patterned light creates virtual electrodes which locally concentrate the field across the cell resulting in electroporation. The device seamlessly integrates with optoelectronic tweezers20 (OET) which creates a device capable of parallel single cell movement and electroporation. Finally, we integrate lithographically defined microfluidic channels onto the device to allow for the delivery of various reagents to the cells of interest. In this manner, we aim to create an electroporation platform capable of parallel processing with single cell selectivity.
Materials and methods
Device operation
The device consists of two main modalities wherein either light-induced electroporation or light-induced manipulation can occur (optoelectronic tweezers). The two modes of operation are switched between through a change of electrical bias.
Light-induced electroporation
Electroporation requires that a cell be subjected to a high electric field (kV cm−1). In order to achieve single cell selectivity, the regions of high electric field concentration must be controlled with subcellular resolution. The presented device uses patterned light to create localized high field regions dynamically and in parallel.
A schematic of the device is shown in Fig. 1. The device consists of two glass substrates which are both coated with a layer of the transparent conductor indium tin oxide (ITO). The bottom substrate is coated with a photosensitive film (a-Si:H). A layer of lithographically patterned SU-8 defines the channel geometry and serves as the spacer between the top and bottom substrates. The space between the two substrates is filled with a solution containing the cells of interest. An AC bias is applied between the two ITO layers. In the absence of light, most of the electric field is concentrated across the highly resistive photoconductive layer. However, upon illumination, the resistance of the photoconductive layer (in the illuminated areas) decreases by many orders of magnitude due to creation of electron-hole pairs. This causes large electric fields to exist in the liquid layer wherever the device is illuminated. Therefore, if an object, such as a cell, is illuminated, the electric field will be concentrated across it. If the field exceeds some threshold value, the cell's membrane will permeate allowing exogenous molecules to enter the cytosol. The optical power density required to operate the device is low (1 W cm−2). This means that a standard projector can be used to illuminate the device, thus, allowing for arbitrary optical pattern generation. In this way, parallel electroporation can occur.
Fig. 1.
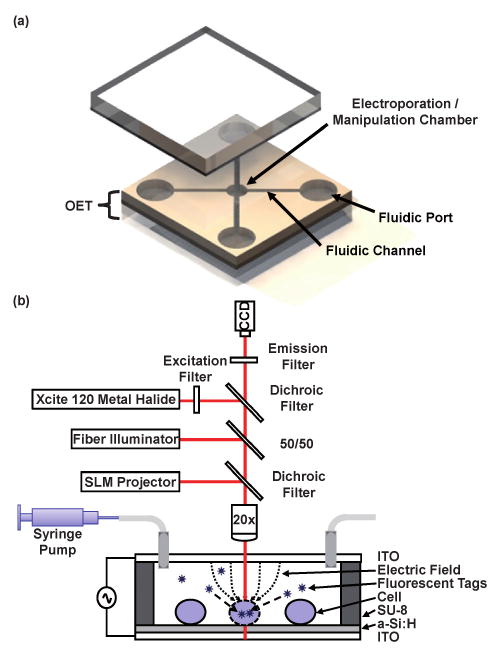
Device schematic. (a) Overall device layout where microfluidic channels define electroporation/manipulation areas and allow for perfusion of different reagents. OET and electroporation function are coupled through a change in device bias. (b) Cross section of device showing experimental setup and mechanism of light-induced electroporation. Optical patterns cause electric field concentration across illuminated cells resulting in selective electroporation.
Optoelectronic tweezers
Optoelectronic tweezers (OET) is a technique for the parallel manipulation of micro- and nanoscopic particles.20–24 The device geometry is identical to that necessary for light-induced electroporation depicted in Fig. 1. Once again, upon illumination, a localized electric field is created in the liquid layer. This localized electric field necessarily sets up localized electric field gradients. Particles in the presence of these gradients experience a dielectrophoretic (DEP) force. Therefore, particles can be manipulated in parallel simply by changing the illumination pattern.
Finally, it should be noted that the fields experienced by the cells during OET manipulation are below the electroporation threshold. Therefore, cell membranes are not compromised during manipulation. As mentioned above, the difference in operation between the OET modality and electroporation modality is a change in electrical bias. Specifically, the bias is increased for the electroporation regime relative to the manipulation regime.
Device fabrication
The fabrication of the described device is shown in Fig. 2. The starting substrates are 6″ glass wafers with a 300 nm layer of sputtered ITO (Thin Film Devices). A 1 μm layer of hydrogenated amorphous silicon (a-Si:H) is deposited via plasma-enhanced chemical vapor deposition (PECVD) on the bottom substrate (100 sccm 10% SiH4 : Ar, 400 sccm Ar, 900 mTorr, 350 °C, 200 W). The topside device is coated with a 55 μm layer of SU-8 (Microchem, SU-8 2050) and patterned to define the channel geometry. The top and bottom wafers are then diced into 2 × 2 cm chips with a dicing saw (ESEC 8003). Access ports are drilled into the top substrate using a diamond-coated 750 μm drill bit and drill press. Next, a UV-curable epoxy (Norland, NOA-68), is spin coated onto a dummy wafer to form a 10–20 μm layer. A block of polydimethylsiloxane is then used to transfer the uncured epoxy from the dummy wafer to the top of the SU-8 channels. The top and bottom substrates are then brought into contact (no alignment is necessary as the bottom substrate is featureless) and UV exposed using a hand-held UV gun (Norland, Opticure-4, 10 s). Finally, fluidic interface connectors are attached to the topside device using additional UV curable epoxy. The fluidic channel layout for all devices in this paper is shown in Fig. 1a (not to scale). All channels used in this paper are ∼55 μm in height. Fluidic channels leading to the central cell chamber are 255 μm in width. The inner-circular chamber where electroporation and manipulation occurs has a diameter of 1.1 mm. The total channel length, from port to port, is 10 mm.
Fig. 2.
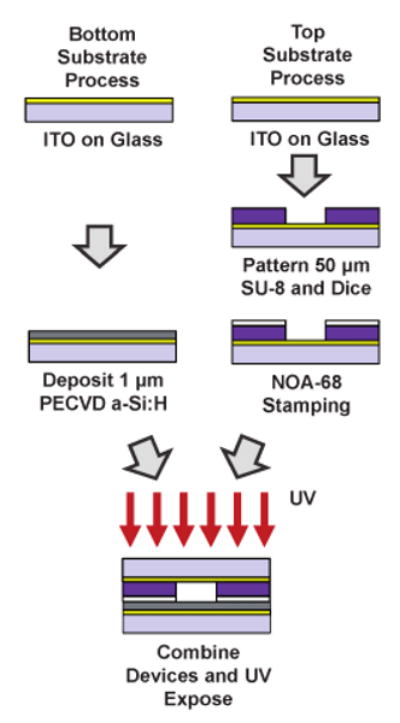
Device fabrication. Channels are defined in SU-8 on the topside OET substrate and bonded to the bottom OET substrate using a UV-curable epoxy.
By allowing for arbitrary top and bottom substrates this process allows us to integrate lithographically defined microfluidic circuits with OET/electroporation functionality.
Experimental setup
The experimental setup is also depicted in Fig. 1(b). The custom built setup consists of a 20× objective mounted above the sample. The optical patterns used for manipulation and electroporation are generated on a PC and focused on the substrate via a commercially available spatial light modulator/projector (SLM) (Dell 2400MP) and dichroic filter. While the ultimate resolution of the projector on the OET device is ∼1 μm, the actual DEP trap resolution using the projector is ∼5 μm when focused (through the 20× objective) onto the device surface. Bright field illumination is introduced via a 50/50 beam splitter. Fluorescence illumination is provided via a metal halide lamp (EXFO, XCite 120) coupled with a series of filters/dichroics specific to the fluorophore under investigation (Chroma Technology). Viewing occurs through a topside CCD camera (Sony, XCD-X710CR). Fluidic exchange occurs via off-chip syringe pumps (KD Scientific, KDS210). Finally, electrical bias (0–5 kV/cm, 100 kHz) was provided with a standard function generator (Agilent 33220A).
Cell preparation
HeLa cells at a concentration 2 × 10⁶ cells ml−1 were washed three times and suspended in commercially available electroporation buffer (Cytopulse Sciences, Cytoporation Media T, 10 mS m−1). Propidium Iodide (PI) (Invitrogen) dye was then added to the solution at a concentration of 2 μM. Another solution containing Calcein AM (CaAM) (Invitrogen) at a concentration 6 μM in electroporation buffer was also prepared. The cell solution was then introduced into the chip via a syringe pump. The CaAM solution was introduced later using the on-chip microfluidic channels to assess cellular viability following electroporation.
Field simulations
During electroporation the critical, device independent, parameter, is the electric field. To estimate the values of the field the cells experience for a given applied voltage and frequency, the device geometry is simulated in commercially available FEM software and the corresponding fields are extracted (COMSOL, 3.a). FEM simulations were carried out as described previously.21 Briefly, a 2-D axial symmetric chamber with dimensions equal to the electroporation chamber defined by the SU-8 channels (1.1 mm diameter with 55 μm height) was simulated. The localized conductivity profile in the a-Si:H layer caused by the incident light pattern was modelled as a Gaussian distribution with a FWHM of 20 μm. The light and dark conductivity of the a-Si:H was extracted from previously reported data.21 For the projector used in these experiments, the dark conductivity of the film was 10−4 S m−1 and light conductivity was 1 × 10⁻³ S m−1. The electric field was then calculated for varying applied voltages. The field at a point 5 μm off of the surface, at the center of light spot, was extracted for each voltage. In this manner, we were able to deduce a relationship between applied voltage and induced electric field. These simulations do not account for the additional loading effect of the cells on the field values and, thus, are merely estimates.
Results and discussion
Parallel single cell electroporation
In order to study electroporation, PI dye is added to the cellular solution as above. PI is a membrane impermeant dye which has low auto fluorescence. However, in the presence of DNA, the dye will bind to the nucleic acids and, as a result, fluoresce strongly red. Successfully electroporated cells will uptake the PI dye molecules and, subsequently, will develop a strong red fluorescent signature.
To demonstrate the capabilities of the OET electroporation assay we first use OET to select and array a number of individual cells. Next, we select a number of these cells (by illuminating them with the optical pattern) and increase the device bias. Unless otherwise stated, the electroporation bias is applied for 5 s at 100 kHz. The electroporation bias occurs at a frequency of 100 kHz because at this frequency the field in the liquid layer (which the cells experience) is maximized. This is also why DEP positioning occurs at the same frequency since the DEP force is also proportional to field strength (Fig. 4a). It has been found that for pulse durations longer than ∼4 ms the amount of dye uptake in HeLa cells remains relatively constant.7 Since we are mainly interested in studying the effects of the electric field on the cell, we kept the electroporation bias time much, much longer than this (i.e. 5 s). This attempts to isolate the electric field as the main parameter of interest.
Fig. 4.
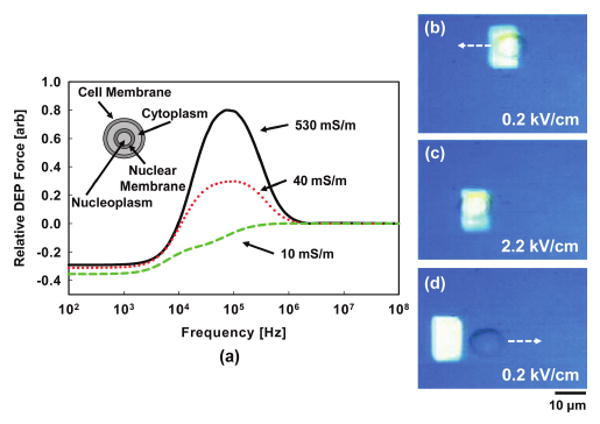
DEP force scaling. (a) Normalized DEP force in the device as a function of frequency for different cytosolic conductivities. Electroporation causes a reduction in cytosolic conductivity resulting in a varying DEP force. If the fluid exchange during electroporation is large enough, the force can switch from positive to negative. (b)–(d) Demonstration of transition from pDEP to nDEP. (b) At low bias, the cell experiences pDEP and is attracted to the light pattern. (Arrow indicates direction of movement.) (c) Electroporation bias is applied resulting in fluidic exchange across membrane. (d) Upon returning to low bias (after 30 s to allow the cell membrane to reseal), the cell now experiences nDEP and is repelled from the light pattern.
The applied electroporation bias causes poration of the cell membrane to occur and results in uptake of the PI dye in solution. The results of this are shown in Fig. 3. First, cells are manipulated into a 2 × 2 array (0.2 kV cm−1). The accompanying fluorescent image shows no dye uptake indicating that normal OET operation does not cause membrane damage. Next, the two cells on the diagonal are illuminated and the electroporation bias is applied (1.5 kV cm−1, 100 kHz, 5 s). The subsequent fluorescent image shows that only those cells that were selected are electroporated. The cells immediately adjacent to the electroporated cells are not affected by the electroporation bias. Finally, the remaining two un-electroporated cells are selected and subjected to the electroporation bias. Now, all four cells fluoresce red, indicating successful electroporation.
Fig. 3.
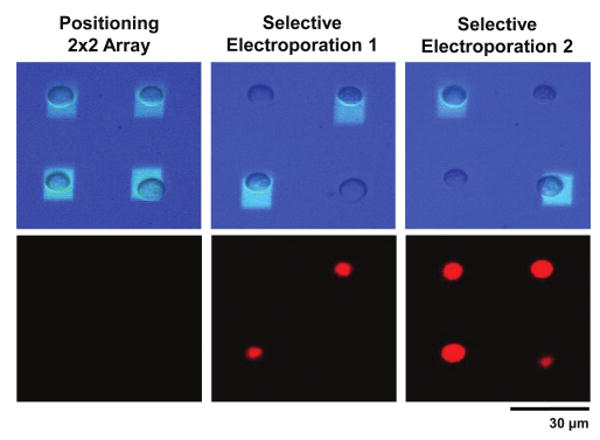
Parallel single cell electroporation. Top row shows bright field image of cells and optical pattern. Bottom row shows corresponding PI dye fluorescence. Cells are first arrayed using OET (0.2 kV cm−1). OET manipulation bias does not cause electroporation. Two cells on the diagonal are then subjected to the electroporation bias (1.5 kV cm−1) and, subsequently, fluoresce (image taken 5 minutes following electroporation bias). Finally, the remaining two cells are porated, resulting in the fluorescence of all cells (image taken 5 minutes following electroporation bias).
DEP force scaling
Under normal electroporation and manipulation conditions, the reported device does not cause any significant changes in the electrical characteristics of the cell. However, if the bias is substantially increased across the cell, dramatic changes in the electrical characteristics and, subsequently, the DEP response will occur. It should be noted that under these extreme operating conditions, the viability of the cells in the device is significantly decreased.
During electroporation, fluid is being exchanged across the cell membrane due to the creation of nanoscopic pores. If the fluidic exchange is substantial, it can cause a large change in the electrical characteristics of the cell. Since the effects of DEP are still present when operating the device in the electroporation regime; one would expect that the change in the electrical properties of the cell due to electroporation will also change the DEP response. The DEP force scales as25
| (1) |
where E is the electric field and εp* and εm* are the complex conjugates of the effective permittivity of the particle and media, respectively. The complex conjugate of the permittivity is equal to , where ε, σ, and ω are equal to the electrical permittivity, conductivity, and frequency, respectively. The quantity multiplying the gradient in electrical field squared is known as the Clausius–Mossotti (CM) factor. Its value can be either positive or negative (force can be attractive or repulsive) depending on the relative electrical properties of the particle and media.
In the described device, the cells are suspended in a relatively lowly conducting media (10 mS m−1). This is done to reduce the effects of joule heating due to the presence of large electric fields. This heating can reduce cellular viability. Additionally, it has been reported that the use of low conductivity media increases electroporation yield.26 This is believed to be due to the fact that in lowly conducting media (relative to that of the cytosol), the cells experience an electro-deformation force which enhances molecular uptake.27
While the media is lowly conducting, the interior (cytoplasm) of the cell is highly conducting (0.5 S m−1). At the frequency of operation of the device (typically 100 kHz), this results in a CM factor of 0.8. This means that cells will be strongly attracted towards the light pattern. However, during electroporation, the outside media mixes with intracellular fluid and results in an effective lowering of the cytoplasmic conductivity. This results in a lowering of the CM factor. If enough fluid exchange occurs, the CM factor can actually switch from positive to negative in value. This means that a cell can go from being attracted to the light pattern to being repulsed from it.
A plot of the relative DEP force (in our device) versus frequency for varying cytosolic conductivities is shown in Fig. 4(a). This figure was generated by simulating the device, as described in the previous section, in a FEM software package and extracting the resulting electric field gradients at varying frequencies. These gradients are then used to calculate the resulting DEP force. The resulting forces are then normalized to each other.
Here we use a four shell model for the effective complex permittivity of the cell using typical cellular parameters to account for the presence of the nuclear envelope and cell membrane.28 The force approaches zero at high frequencies due to the small impedance of the photoconductive layer (at these frequencies) causing the electric field to primarily exist in the liquid and prevent effective optical switching. Notice that the relative DEP force decreases as a function of decreasing cytoplasmic conductivity. As the conductivity of the interior of the cell approaches that of the media, the force switches polarity and goes from positive DEP (pDEP) to negative DEP (nDEP) (note that the cell membrane must remain intact for this to occur).
Certainly, if the field strength is high enough, the cell will undergo lysis. However, if the cell undergoes lysis, the function of the membrane of the cell as an electrical insulator will cease. This will result in the free mixing of intracellular contents with external solution. The lysed cell would be then electrically indistinguishable from the surrounding media and, thus, no DEP would occur (i.e. the CM factor is zero). This fact has been used to sort live cells from dead cells.20
In the case presented here, a strong nDEP response is observed (the cell is actively repulsed from the light pattern, Fig. 4d) after excessive electrical stimulation. This means that the conductivity of the membrane is quite low (i.e. the cell continues to act like an insulating shell, with the conductivity of the cytoplasm very similar to that of the media). It is typically very difficult to achieve true cell lysis with the optical powers and electric fields reported in this paper. Therefore, we believe that the onset of nDEP in this case is a result of a decrease in the cytoplasmic conductivity to near that of the surrounding media and not a result of cell lysis.
Fig. 4(b)–(d) shows the evolution of a cell switching from pDEP to nDEP as a result of the applied electroporation bias. Initially, the cell experiences pDEP and is attracted to the light pattern. The electroporation bias (2.2 kV cm−1) is applied and then the bias is turned off for 30 s to allow the cell's membrane to reseal. When the manipulation bias (0.2 kV cm−1) is reapplied, the cell now experiences nDEP. As mentioned above, when subjected to these large field strengths, the cell is likely to be no longer viable (as we will show later) and this provides an upper limit on the fields that may be applied without harming the cell. The variation of the DEP force with electroporation may be used as a way to monitor, or study, the extent of fluid exchange that occurs within a single cell.
Cell viability
For many applications of electroporation (such as gene transfection), one requires that the pores induced in the cell membrane reseal and the cell retains its viability. This is known as reversible electroporation. In order to assess this, we use a combination of two dyes to indicate both electroporation and cell viability. As before, we porate the cells in the presence of PI to indicate successful electroporation. We then use the onboard fluidic channels to exchange the media surrounding the porated cells with new media containing a dye which indicates cell viability. The cells are held in place during media exchange using OET. The viability dye used is CaAM. This dye, initially non-fluorescent, will passively diffuse across the cell membrane. Once inside, enzymes present in the cytosol break down the CaAM molecule to produce a product that fluoresces green and is membrane impermeable. A cell which strongly fluoresces green in the presence of CaAM, has an intact membrane and the necessary enzymes to produce the fluorescent derivative. These two traits are strong indicators that the cell is still viable. Therefore, after media exchange, we expect reversibly porated cells to fluoresce both red and green.
A panel depicting the evolution of the above process is shown in Fig. 5. An individual cell, immersed in a solution containing PI, is selected and positioned using OET (0.2 kV cm−1). Initially, both PI and CaAM fluorescence are negligible. The electroporation bias (1.5 kV cm−1) is then applied to the cell, resulting in PI dye uptake. The CaAM signature is still blank at this point as no CaAM is present. Finally, the media is exchanged with the CaAM-containing solution (0.1 μL min−1 (corresponding to ∼50 μm s−1 linear flow speed in the inner chamber), 15 min) and the cell, subsequently, fluoresces green (due to CaAM) and red (due to PI dye present previously). This indicates that successful reversible electroporation has occurred.
Fig. 5.
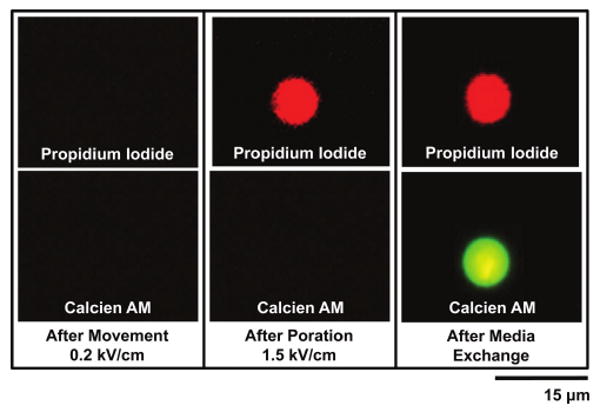
Cell viability. The top row shows PI fluorescence and the bottom row shows CaAM fluorescence. A single cell is suspended in a solution only containing PI (6 μM). In the first panel, no dye uptake is observed following positioning of the cell with OET (0.2 kV cm−1). In the second panel, the cell is subjected to the electroporation bias (1.5 kV cm−1) resulting in PI dye uptake (image taken 5 minutes following electroporation bias). In the third panel, the media is exchanged (0.1 μL min−1, 15 min) using microfluidic channels with a solution containing CaAM (2 μM). The cell now exhibits CaAM and PI response verifying successful reversible electroporation.
In order to more fully understand the field dependence of the electroporation mechanism, we repeat the above process for a variety of field strengths and monitor the fluorescence intensity of both PI and CaAM dye for each cell. Fig. 6 shows the results of this experiment. At low electric fields, membrane poration does not occur. This results in negligible PI dye fluorescence and strong CaAM fluorescence (indicating good cellular viability). Above about 1.4 kV cm−1, the cell's membrane is perforated and, as a result, PI dye fluorescence increases sharply. The CaAM fluorescence intensity initially remains unchanged from the unporated state, indicating successful reversible electroporation, until the field strength reaches approximately 2.3 kV cm−1. At this point, the CaAM fluorescence drops off sharply indicating that the viability of the cells has decreased. This is most likely due to excessive fluid exchange across the membrane resulting in a diluted intra-cellular space and/or the failure of field induced pores to reseal. This simple analysis indicates that the field strengths necessary for the successful electroporation of HeLa cells for PI uptake should be in the range of 1.4–2.3 kV cm−1. These values agree with those previously reported for this cell line and dye.7 The ability to track and map an individual cell's response to field strength (versus a population) is necessary for optimizing electroporation efficacy, where efficacy relates to the ability to reliably transfer the molecule of interest into the cell and achieve a desired cellular response.
Fig. 6.
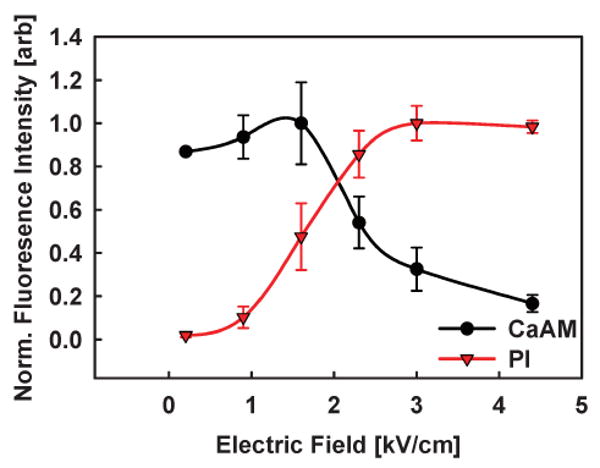
Electric field response of HeLa cells. Individual HeLa cells are subjected to varying electric field strengths and the corresponding PI and CaAM fluorescence intensity is measured. Points and error bars correspond to the mean and standard deviation fluorescence intensity of 5 HeLa cells, respectively. PI dye uptake begins at field strengths of greater than about 1.4 kV cm−1. CaAM dye fluorescence begins to decrease for field strengths in excess of 2.3 kV cm−1. This indicates that the optimal dosage for PI dye electroporation in HeLa cells is in the range of 1.4–2.3 kV cm−1.
Conclusion
The parallel, light-induced electroporation and manipulation of single cells is demonstrated. Through the use of patterned light, virtual electrodes can be dynamically created through the interaction of the light with a photosensitive layer on the device. Depending on electrical bias, these virtual electrodes can be used to either manipulate multiple cells using light-induced dielectrophoresis or selectively electroporate individual cells in parallel. Electroporation was monitored using fluorescent dyes and observing how the DEP force scales as a function of poration. Fluidic channels integrated onto the device allow for the exchange and perfusion of various media. These channels are used to demonstrate that the cells undergo reversible electroporation and are, therefore, still viable following treatment in the device. Finally, the assessment of the optimal electroporation dose is determined with single cell selectivity. We find that the optimal field necessary for electroporation while maintaining cell viability is in the range of 1.4–2.3 kV cm−1.
Light-induced electroporation is an interesting technique that allows for the low-cost, dynamic, and parallel electroporation of single cells. Since this technique seamlessly integrates with optoelectronic tweezers, the device will hopefully lead to a true cellular manipulation platform which includes on-chip cell sorting, electroporation, and culture.
Acknowledgments
The authors would like to thank the UC Berkeley Cell Culture facility for providing the cells used in this study and the UC Berkeley Microlab where all devices were fabricated. This work was funded by the Center for Cell Control, a National Institute of Health Nanomedicine Development Center under grant #PN2 EY018228.
References
- 1.Boitano S, Dirksen ER, Sanderson MJ. Science. 1992;258:292–295. doi: 10.1126/science.1411526. [DOI] [PubMed] [Google Scholar]
- 2.Braet K, Mabilde C, Cabooter L, Rapp G, Leybaert L. J Neurosci Methods. 2004;132:81–89. doi: 10.1016/j.jneumeth.2003.09.003. [DOI] [PubMed] [Google Scholar]
- 3.Weaver JC. Plasma Science, IEEE Transactions on. 2000;28:24–33. [Google Scholar]
- 4.Weaver JC, Chizmadzhev YA. Bioelectrochem Bioenerg. 1996;41:135–160. [Google Scholar]
- 5.Neumann E, Schaeferridder M, Wang Y, Hofschneider PH. EMBO J. 1982;1:841–845. doi: 10.1002/j.1460-2075.1982.tb01257.x. [DOI] [PMC free article] [PubMed] [Google Scholar]
- 6.Lundqvist JA, Sahlin F, Aberg MAI, Stromberg A, Eriksson PS, Orwar O. Proc Natl Acad Sci USA. 1998;95:10356–10360. doi: 10.1073/pnas.95.18.10356. [DOI] [PMC free article] [PubMed] [Google Scholar]
- 7.He HQ, Chang DC, Lee YK. Bioelectrochemistry. 2007;70:363–368. doi: 10.1016/j.bioelechem.2006.05.008. [DOI] [PubMed] [Google Scholar]
- 8.Jain T, Muthuswamy J. Biosens Bioelectron. 2007;22:863–870. doi: 10.1016/j.bios.2006.03.013. [DOI] [PubMed] [Google Scholar]
- 9.MacQueen LA, Buschmann MD, Wertheimer MR. Bioelectrochemistry. 2008;72:141–148. doi: 10.1016/j.bioelechem.2008.01.006. [DOI] [PubMed] [Google Scholar]
- 10.Khine M, Ionescu-Zanetti C, Blatz A, Wang LP, Lee LP. Lab Chip. 2007;7:457–462. doi: 10.1039/b614356c. [DOI] [PubMed] [Google Scholar]
- 11.Valero A, Post JN, van Nieuwkasteele JW, ter Braak PM, Kruijer W, van den Berg A. Lab Chip. 2008;8:62–67. doi: 10.1039/b713420g. [DOI] [PubMed] [Google Scholar]
- 12.Huang Y, Rubinsky B. Sens Actuators, A. 2001;89:242–249. [Google Scholar]
- 13.Soughayer JS, Krasieva T, Jacobson SC, Ramsey JM, Tromberg BJ, Allbritton NL. Anal Chem. 2000;72:1342–1347. doi: 10.1021/ac990982u. [DOI] [PubMed] [Google Scholar]
- 14.Gac SL, Zwaan E, v d Berg A, Ohl CD. Lab Chip. 2007;7:1666–1672. doi: 10.1039/b712897p. [DOI] [PubMed] [Google Scholar]
- 15.Tirlapur UK, Konig K. Nature. 2002;418:290–291. doi: 10.1038/418290a. [DOI] [PubMed] [Google Scholar]
- 16.Wu TH, Kalim S, Callahan C, Teitell M, Chiou PY. IEEE/LEOS Summer Topical Meetings, 2008 Digest of the. 2008:195–196. [Google Scholar]
- 17.Yamada M, Kobayashi J, Yamato M, Seki M, Okano T. Lab Chip. 2008;8:772–778. doi: 10.1039/b718281c. [DOI] [PubMed] [Google Scholar]
- 18.Felgner PL, Gadek TR, Holm M, Roman R, Chan HW, Wenz M, Northrop JP, Ringold GM, Danielsen M. Proc Natl Acad Sci USA. 1987;84:7413–7417. doi: 10.1073/pnas.84.21.7413. [DOI] [PMC free article] [PubMed] [Google Scholar]
- 19.Adamo A, Jensen KF. Lab Chip. 2008;8:1258–1261. doi: 10.1039/b803212b. [DOI] [PubMed] [Google Scholar]
- 20.Chiou PY, Ohta AT, Wu MC. Nature. 2005;436:370–372. doi: 10.1038/nature03831. [DOI] [PubMed] [Google Scholar]
- 21.Valley JK, Jamshidi A, Ohta AT, Hsu HY, Wu MC. J Microelectromech Syst. 2008;17:342–350. doi: 10.1109/JMEMS.2008.916335. [DOI] [PMC free article] [PubMed] [Google Scholar]
- 22.Ohta AT, Chiou PY, Han TH, Liao JC, Bhardwaj U, McCabe ERB, Yu F, Sun R, Wu MC. J Microelectromech Syst. 2007;16:491–499. [Google Scholar]
- 23.Jamshidi A, Pauzauskie PJ, Schuck PJ, Ohta AT, Chiou PY, Chou J, Yang P, Wu MC. Nat Photon. 2008;2:86–89. doi: 10.1038/nphoton.2007.277. [DOI] [PMC free article] [PubMed] [Google Scholar]
- 24.Neale S, Ohta AT, Hsu HY, Valley JK, Jamshidi A, Wu MC. SPIE Optics and Photonics. SPIE; San Diego, CA: 2008. [Google Scholar]
- 25.Jones TB. Electromechanics of Particles. Cambridge University Press; Cambridge: 1995. [Google Scholar]
- 26.Sukhorukov VL, Reuss R, Zimmermann D, Held C, Müller KJ, Kiesel M, Geβner P, Steinbach A, Schenk WA, Bamberg E, Zimmermann U. J Membr Biol. 2005;206:187–201. doi: 10.1007/s00232-005-0791-2. [DOI] [PubMed] [Google Scholar]
- 27.Sukhorukov VL, Mussauer H, Zimmermann U. J Membr Biol. 1998;163:235–245. doi: 10.1007/s002329900387. [DOI] [PubMed] [Google Scholar]
- 28.Crane JS, Pohl HA. J Theor Biol. 1972;37:15–41. doi: 10.1016/0022-5193(72)90113-0. [DOI] [PubMed] [Google Scholar]