

Abstract
Motivation: The explosion of next-generation sequencing data has spawned the design of new algorithms and software tools to provide efficient mapping for different read lengths and sequencing technologies. In particular, ABI's sequencer (SOLiD system) poses a big computational challenge with its capacity to produce very large amounts of data, and its unique strategy of encoding sequence data into color signals.
Results: We present the mapping software, named PerM (Periodic Seed Mapping) that uses periodic spaced seeds to significantly improve mapping efficiency for large reference genomes when compared with state-of-the-art programs. The data structure in PerM requires only 4.5 bytes per base to index the human genome, allowing entire genomes to be loaded to memory, while multiple processors simultaneously map reads to the reference. Weight maximized periodic seeds offer full sensitivity for up to three mismatches and high sensitivity for four and five mismatches while minimizing the number random hits per query, significantly speeding up the running time. Such sensitivity makes PerM a valuable mapping tool for SOLiD and Solexa reads.
Availability: http://code.google.com/p/perm/
Contact: tingchen@usc.edu
Supplementary information: Supplementary data are available at Bioinformatics online.
1 INTRODUCTION
Next-generation sequencing technology has created the need for highly efficient methods to align short DNA reads (Shendure and Ji, 2008). Current technologies (Ronaghi et al., 1998), e.g. the Illumina and SOLiD platforms, are capable of generating hundreds of millions of short reads in a single run (Applied Biosystems, 2008a; Bennett, 2004). These breakthroughs have led to many important biological applications, including the identification of transcription factor binding sites (Chip-Seq; Mardis, 2007), estimation of RNA expression levels (RNA-Seq; Marioni et al., 2008) and SNP calling (Quinlan et al., 2008).
Applied Biosystems ligation-mediated SOLiD sequencer has the unique property of collecting color signals for the transitions between nucleotides. Each single nucleotide polymorphism changes two transitions (i.e. consecutive colors), providing a large advantage in the detection of SNPs because only a fraction of color changes represent possible SNPs (Applied Biosystems, 2008a) and single color discrepancies can be regarded as sequencing errors. While this unique encoding results in base accuracy as high as 99.94% (Applied Biosystems, 2008a), it also requires algorithms capable of finding alignments with less similarity than those designed for sequencers such as Solexa which output signals directly from nucleotides.
Most read mapping programs are designed to be full sensitive to ‘k’ mismatches, meaning all alignments within k mismatches will be reported. Original alignment tools such as BLAST (Altschul et al., 1990) and BLAT (Kent, 2002), are capable of finding highly sensitive alignments for long reads, but do not provide full sensitivity to specific numbers of mismatches and are incapable of efficiently mapping the amount of reads currently produced by short-read sequencing machines. Many mapping programs have been designed to handle large amounts of short reads, including ELAND (Anthony. J. Cox, 2006, unpublished data), MAQ (Li et al., 2008), ZOOM (Lin et al., 2008), RMAP (Smith et al., 2008) and SeqMap (Jiang and Wong, 2008), which preprocess and index read sets and then scan the reference for potential matches. Programs including SOAP (Li et al., 2008), Pass (Campagna et al., 2009), MOM (Eaves and Gao, 2009), ProbMatch (Kim et al., 2009), SXOligoSearch (Malaysian Genomics Resource Center, 2009), Mosaik (The MarthLab, 2009), BWA (Li and Durbin, 2009) and Bowtie (Langmead et al., 2009) preprocess and index the reference and then search for potential matches among the reads.
In many SOLiD datasets (Ondov et al., 2008, Section 3.3), more than half of the sequenced reads will not align to the reference with fewer than three mismatches. For this reason, programs designed specifically for SOLiD data, including the Corona Lite pipeline (Applied Biosystems, 2008c) and SOCS (Ondov et al., 2008), provide full sensitivity to alignments including three or more mismatches. Such sensitivity usually comes at a cost; the shorter subsequences used to provide full sensitivity to high numbers of mismatches also slow mapping such that genome-scale mapping may not be possible.
PerM (Periodic Seed Mapping) ameliorates these difficulties through the design of periodic spaced seeds to maximize efficiency for many distance measures, including those specific to the location of polymorphism in color space. For example, rather than accepting the slower performance associated with sensitivity to multiple mismatches, we introduce a faster method which provides full sensitivity to one potential SNP locus (consecutive mismatches) and a free color error. Periodic seeds allow PerM to maximize efficiency while maintaining full sensitivity for up to three mismatches with about 88% and 67% partial sensitivity for four and five mismatches (see Supplementary section 3)
Most read-mapping programs use the idea of ‘seeds’ for preprocessing and matching (Myers, 1999). A seed is a set of selected positions within a window which generates fixed length subsequences when slid along a string. When a seed is aligned to a read or a genomic sequence, selected positions are concatenated to form a fixed length subsequence which can be used to extract similar reads or genomic substrings. These subsequences are used for filtering: only when a read and a genomic substring share the same subsequence will a ‘hit’ be declared and further examination be carried out to determine the actual similarity level. When subsequences are short, the seed is said to have ‘low weight’ and the probability of subsequences matching by chance becomes greater. For large genomes and datasets, these ‘random hits’ will often be the bottleneck of the running time.
The most widely used short-read mapping algorithm, implemented in many programs including ELAND, MAQ (Li et al., 2008), SOAP (Li et al., 2008), Corona Lite (Applied Biosystems, 2008c) and SOCS (Ondov et al., 2008) divides each read into k+m fragments to provide full sensitivity to k mismatches. Then  hashing steps are used to check for exact matches in the different combinations of m fragments. If a read aligns to the reference with k or fewer mismatches then one of the
  subsequences will match exactly. The larger the value chosen for m, the greater the seed weight, but more index tables and hashing steps are required. For example, Corona Lite (Applied Biosystems, 2008c) chooses m=3, while SOCS (Ondov et al., 2008) chooses m=1. However, the most common choice is m=2, used by ELAND, MAQ (Li et al., 2008) and SOAP (Li et al., 2008). This method is displayed in Figure 1. The read is divided into four equal size fragments, resulting in the hashing of six substring pairs for each read. These six pairs of substrings are encompassed into three seeds which can be used to preprocess the genome or the set of reads into three index tables.
Fig. 1.

Conventional seeds used by ELAND, SOAP and MAQ divide a 32 bp read into four substrings. For any alignment within two mismatches, at least one of six pairs of substrings will match exactly. This method requires three hash tables and six lookups for each read and direction (forward or reverse complement).
Instead of using seeds composed of equal-sized substrings, our method is based on idea of the spaced seed proposed by Burkhardt and Karkkainen (2001), Ma et al. (2002) in PatternHunter and Kucherov et al. (2005). A spaced seed is a set of ‘care’ and ‘don't care’ positions, annotated as ‘1’s and ‘*'s, respectively. For example, PatternHunter suggested 111*1**1*1**11*111 as a good spaced seed with weight (number of ‘care’ positions) 11. Mathematical results (Buhler et al., 2003; Xu et al., 2006) have shown that spaced seeds are more sensitive than consecutive seeds (those without ‘don't care’ positions) in finding local similarities between two strings. Kucherov et al. (2005) attempted to minimize the number of multiple spaced seeds necessary to achieve different levels of sensitivity. Lin et al. (2008) used multiple spaced seeds for short-read mapping and provided bounds for the number of lookups necessary to achieve full sensitivity for varying seed lengths and weights. They showed that for a 32 bp read, seeds with the weight of 16 require at least six lookups to obtain full sensitivity for two mismatches. They implemented this idea into a program, called ZOOM (Lin et al., 2008).
SHRiMP (Rumble et al., 2009) also uses spaced seeds to find hits, however, they find alignments with InDels as well as mismatches which requires significantly longer running time.
PerM uses single periodic weight-maximized spaced seeds. An example, shown in Figure 2, is composed of four repeating patterns of (111*1**) whose length is seven and is full sensitive to two mismatches. When this seed is applied to a 32 bp read, it generates seven subsequences, one of which will match any string within two mismatches of the read. It should be noticed that the length of the repeating pattern (seven in the example) is equal to the number of subsequences generated.
Fig. 2.

The single periodic spaced seed full sensitive to two mismatches over a 32 bp read. For any alignment within two mismatches, at least one out of the seven subsequences will match exactly. This seed is composed of repeating the pattern (111*1**).
In Section 2, we describe how PerM's periodic seeds allow to increase mapping efficiency and sensitivity when compared with the conventional consecutive seeds used by many other programs.
2 METHODS
2.1 Seed notation
Ck: the conventional seed family which divides reads into k+2 fragments (used in ELAND, MAQ and SOAP) to provide full sensitivity to k mismatches.
Fk: the maximum-weight periodic spaced seed family which is full sensitive to k mismatches.
Sx,k: the special weight maximized periodic seed family for mapping SOLiD reads, full sensitive to x SNP candidates (consecutive mismatches) and k free mismatches.
2.2 Motivation for periodic design
For any full sensitive seed family, there exists two performance criteria, memory load and running time. Memory load is directly related to the number of index tables required to be built during preprocessing. PerM's single periodic seeds store a single index for each locus, requiring only 4.5 bytes per base to index the entire genome. Running time is dependent linearly on the number of queries or slides required of a seed but can be influenced exponentially by the seed weight (number of ‘care’ positions). Specifically, periodic seeds that are composed of repeating patterns of length |P| will generate, for each read, |P| subsequences of weight w for query, where w is the seed weight. An approximation for the expected number of random hits per read is 2|G‖P|/4w, where |G| is the length of the genome and the number 2 is necessary for the forward and reverse compliment.
For large-scale genome projects, if the seed weight is not sufficiently large, the number of random hits will grow by a factor of four each time the weight is decreased by one. Thus, we make as our goal the design of single high weight periodic seeds with moderate pattern lengths. Sections 2.3–2.4 describe how the use of periodic seeds provides a generalizable framework to quickly develop high-performing maximum weight seeds for a variety of distance measures.
2.3 Periodic seeds: generalization, indexing and extendability
2.3.1 Generalization for different read lengths
That the full sensitive periodic seeds generalize to all lengths is a function of their repeating pattern. For example, sliding the following seed (length 28) six times generates seven subsequences that provide full sensitivity to two mismatches for a 34 bp read.
(111*1**)(111*1**)(111*1**)(111*1**)
By the definition of full sensitivity, all pairs of positions i and j will be covered pairwise with ‘don't care’ (*) positions in at least one of the slides. Ignoring boundary effects, we can examine the internal read positions 8–14 in Table 1, when the above spaced seed is applied (Slide 0) and slid six times (Slides 1–6). In total, each of the  pairs of positions is covered pairwise with ‘*’ exactly once. Therefore, this pattern is locally optimal, providing local full sensitivity to two mismatches.
Table 1.
The periodic spaced seed, applied to a read and slid through positions 8–14 six times, covers all the 21 pair of positions exactly once
| Positions | 8 | 9 | 10 | 11 | 12 | 13 | 14 | Covering 21 pairs of positions |
|---|---|---|---|---|---|---|---|---|
| Slide 0 | 1 | 1 | 1 | * | 1 | * | * | (11, 13) (11, 14) (13, 14) |
| Slide 1 | * | 1 | 1 | 1 | * | 1 | * | (8, 12) (8, 14) (12, 14) |
| Slide 2 | * | * | 1 | 1 | 1 | * | 1 | (8, 9) (8, 13) (9, 13) |
| Slide 3 | 1 | * | * | 1 | 1 | 1 | * | (9, 10) (9, 14) (10, 14) |
| Slide 4 | * | 1 | * | * | 1 | 1 | 1 | (8, 10) (8, 11) (10, 11) |
| Slide 5 | 1 | * | 1 | * | * | 1 | 1 | (9, 11) (9, 12) (11, 12) |
| Slide 6 | 1 | 1 | * | 1 | * | * | 1 | (10, 12) (10, 13) (12, 13) |
In fact, local full sensitivity of this pattern implies global full sensitivity of the periodic spaced seed because every position in the read shares a similar relationship with some position within 8–14. Formally, for any read position i (excluding the boundaries of the reads), there exists a position j, 8≤j≤14, where i mod 7=j mod 7, such that when j is aligned to ‘*’, so is i. Thus, if every pair of positions within a pattern are covered pairwise with ‘*’ in some slides then every pair of positions within the read is covered pairwise with ‘*’ at some slides. Note that this property is also applied to the boundary positions which are more often aligned to ‘*’.
This pattern of length seven can be generalized to produce the periodic spaced seeds for any read length, e.g. read lengths of 25 and 36 as follows:
111*1**)(111*1**)(111*1), (111*1**)(111*1**)(111*1**)(111*1**)11.
This generalizability of repeating patterns in periodic seeds holds not just for two mismatches but for all k mismatches, listed as a lemma in the work of Kucherov et al. (2005). Most importantly, generalizability drastically simplifies the seed-design algorithm and provides the framework for variable seed extension, which provides a significant increase in seed weight while maintaining a single index table.
2.3.2 Efficient indexing to allow seed extension
To achieve full sensitivity a periodic seed will slide |P| − 1 times and generate |P| subsequences on a read. As shown in Figure 2, this is accomplished by keeping open the last |P| − 1 positions at the end of the read. However, as periodic seeds maintain full sensitivity when generalized, these empty positions are not required. This is shown with a different example in Figure 4, each slide seeds can be extended to the end of the read so that all but the last are likely to have increased seed weight. In the example shown in Figure 4, seed extension results in weight increasing from the minimum of 14 to between 14 and 19 which corresponding to an approximately five times faster mapping performance for the whole human genome.
Fig. 4.

This figure shows the extension of periodic spaced seed S1,1, composed of the repeating pattern (1111**1***), to multiple variable-weight spaced seeds that are applied to a 34-color SOLiD reads where 0, 1, 2 and 3 represent the four colors. The original seed is shown in the black boxes, and the extended variable-weight seeds are highlighted at the tail by the dashed boxes. The weight w is shown at the beginning for each extended seeds
To take the advantage of the extended seed weight without additional requirements to memory, PerM combines hashing with the binary search. Our special data structure consists of a hash table which stores pointers to the starting position of each bucket in an index table which stores the addresses of reads or the genome locations. In the example shown in Figure 4, we preprocess a genome using the maximum weight seed with W = 19 to generate one subsequence for every position in the genome. The prefix of each subsequence (e.g. the first 14 bases) is used to hash the location into a bucket in the index table. Inside each bucket, multiple subsequences with the same prefix are sorted lexicographically and stored in the index table. Note that within each bucket, we can search for exact matches of variable-length strings using the binary search. Then, we apply the extended variable-weight seeds to each read to generate variable-length subsequences, and use the extended bases after 14 to find the exact matches using the binary search in the index table. This method results in seed weight which varies from 14 to 19 in the example shown in Figure 4.
2.4 Seed-search algorithm
The weight of periodic spaced seeds can be optimized by calculating the maximum-weight patterns of length |P| which achieve full sensitivity to some distance measure. The small search space allows us to easily enumerate all reasonable size patterns of length |P| to find which has maximum weight. Table 2 lists the maximum weights of the optimal patterns found for various number of consecutive color mismatches (x) and single mismatches (k) for various pattern lengths |P|=6,…, 15.
Table 2.
The maximum weights of patterns that are full sensitivity to x SNPs and k free mismatches
| Sensitivity threshold | Periodic pattern length |P| |
|||||||||
|---|---|---|---|---|---|---|---|---|---|---|
| 6 | 7 | 8 | 9 | 10 | 11 | 12 | 13 | 14 | 15 | |
| k = 2 | 3 | 4 | 4 | 5 | 6 | 7 | 8 | 9 | 9 | 10 |
| x = 1, k = 1 | 2 | 2 | 3 | 4 | 5 | 5 | 6 | 7 | 8 | 8 |
| k = 3 | 2 | 2 | 3 | 3 | 4 | 5 | 5 | 6 | 6 | 7 |
| x =2, k = 0 | 1 | 2 | 2 | 3 | 4 | 5 | 5 | 6 | 7 | 8 |
| k = 4 | 1 | 1 | 1 | 2 | 3 | 3 | 3 | 4 | 4 | 5 |
For any fixed values of k and x, the design of periodic space seeds has to consider which pattern length provides the best seed. Notice that a longer pattern provides a greater weight/length ratio asymptotically, but the relationship is not monotonic, as shown in the curve for k = 2 in Figure 3. On the other hand, longer pattern lengths will increase the number of required queries, so our seed design considers the shortest pattern whose weight to length ratio is large enough to provide a tolerable number of random hits. In the case of two mismatches, local optima occur at |P| = 7 and |P| = 13, which provide ratios of 4/7 and 9/13, respectively. Here, we choose the pattern with |P|=7 because it requires six fewer queries per read. This pattern is used to design F2, which is shown in Figure 2, generating seven queries when applied to a 32 bp read. We prove that the F2 seed is the maximum weight spaced seed for seven lookups in the Supplementary Material. This proof agrees with the results shown by Kucherov et al., (2005), that for moderate read lengths, optimal seeds are usually periodic. This method is also used to design F3, F4 and the SOLiD-specific family of seeds Sx,k.
Fig. 3.
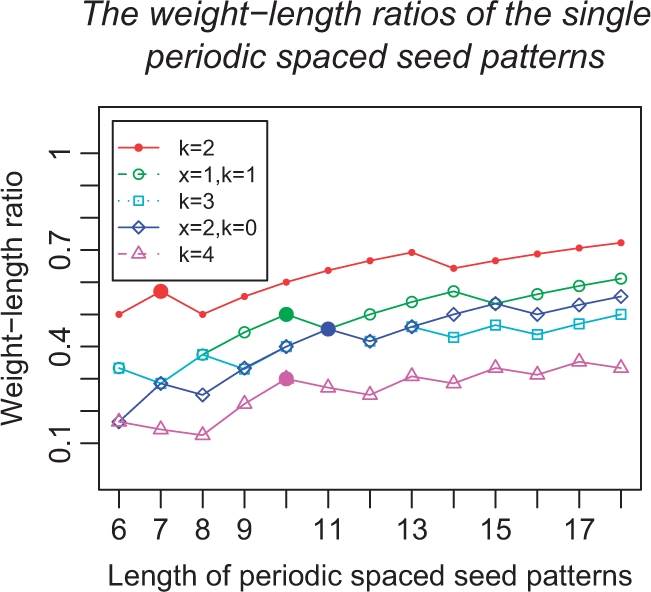
This figure shows the optimal weight–length ratios for different pattern lengths.
2.5 Implementation and bitwise encoding
2.5.1 Quality scores and paired end reads
If reads include a corresponding quality score, file PerM will evaluate mappings by their alignment scores according to the quality score of each base. PerM can also filter out poor quality reads before mapping. If paired end reads and bounds for their separation distance are given as input, PerM will output both the best alignments within and beyond the separation bounds. Each alignment will be stored in a separate file.
2.5.2 Base to color encoding
PerM encodes each read into two 64 bit words with two bits for each base, that is, A = (0,0), C = (0, 1), G = (1,0) and T = (1,1). We adopt RMAP's method (Smith et al., 2008) to encode these two bits separately in two words. Similarly, each base on the reference genome is encoded three bits, with the third bit indicating whether the locus is masked as character N. This encoding method enables us to quickly check the number of mismatches between two bit-strings, using two ‘XOR’ and one ‘OR’ bitwise operations.
For SOLiD reads, the color signals are also encoded in a similar way, with Blue = (0,0), Green = (0,1), Yellow = (1,0) and Red = (1,1). This encoding enables a quick translation of encoded base to encoded color signals by using bitwise operations of ‘SHIFT’ and ‘XOR’. In the example shown in Figure 5, a five-base read ‘ATGGA’ is encoded as two binary strings, U = (01110) and V = (01001). The color signals of this read, ‘Red Green Blue Yellow’ encoded as U′ = (1001) and V′ = (1100), can be obtained by U′ = U XOR (U SHIFT 1) and V′ = V XOR (V SHIFT 1). This allows the reference genome to be saved as an encoded string of bases, while the corresponding color spaced encoding can be read out in few bitwise operations.
Fig. 5.
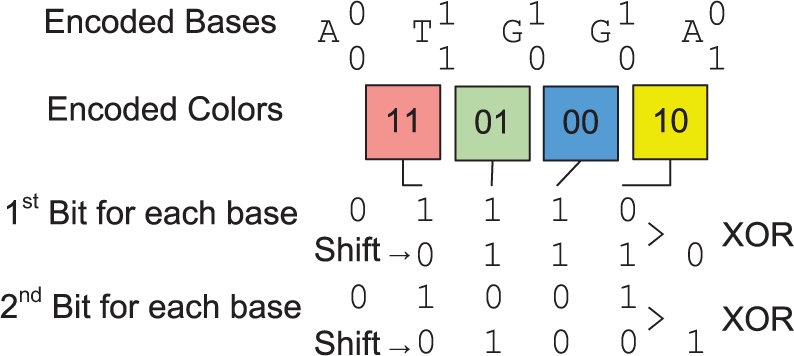
Dinucleotide colors signals encoded from the base encoding.
2.5.3 Color mutations for SNPs
Applied Biosystems lists rules (Applied Biosystems, 2008b) to check whether two consecutive mismatches are valid in their indication a base substitution (SNP). Only one-third of possible combinations of consecutive color mismatches are valid for a base substitution. For example, if ‘AATAA’ is encoded into the colors ‘BRRB’ and mapped to ‘BBBB’ the reference may have resulted from ‘AAAAA’ meaning a SNP from ‘A’⇔‘T’ causing two identical color mismatches, Blue ⇔ Red. However, if ‘BRRB’ is mapped to ‘BBGB’, a SNP cannot be present because the nucleotide sequence which corresponds to ‘BBGB’ is ‘AAACC’. Instead, this is likely the result of two color sequencing errors. For ease of explanation, the combinations of consecutive mismatches are classified into three types:
Type I: Blue ⇔ Red or Green ⇔ Yellow
Type II: Blue ⇔ Green or Red ⇔ Yellow
Type III: Blue ⇔ Yellow or Green ⇔ Red
Only when both color mismatches are of the same type, does it indicate a valid SNP. These three types of consecutive mismatches correspond to the three classes of base substitutions, (i) Transversion I [A ⇔ T or G ⇔ C]; (ii) Transversion II [A ⇔ C or G ⇔ T]; (iii) Transition, respectively.
The validation of SNP candidates is simple given our encoding method. Given two colors, one encoded into two bits B1 and B2, and the other into two bits b1 and b2, the three types of SNPs can be determined by the following bitwise operations:
Type I: iff (B1 XOR b1) AND (B2 XOR b2) = 1
Type II: iff (NOT (B1 XOR b1)) AND (B2 XOR b2) = 1
Type III: iff (B1 XOR b1) AND (NOT (B2 XOR b2)) = 1
3 RESULTS
3.1 Results of seed design
As shown in the experimental results, the periodic spaced seeds used in PerM outperform the seeds used in MAQ in terms of mapping speed and sensitivity for both Illumina and SOLiD data. Table 3 displays our fixed weight periodic spaced seeds generalized to 34-color SOLiD reads. Fk denotes a seed full sensitive to k mismatches, while Sx,k denotes a SOLiD-specific seed full sensitive to x consecutive color mismatches (SNPs) and k free color mismatches.
Table 3.
PerM's single periodic spaced seeds for SOLiD 34-color reads
| Seed name | Seed patterns parenthesized according to their repeats | Seed weight |
|---|---|---|
| F2 | (111*1**)(111*1**)(111*1**)(111*1**) | 16 |
| S1,1 | (1111**1***)(1111**1***)(1111*) | 14 |
| F3 | (111*1**1***)(111*1**1***)(11) | 12 |
| S2,0 | (1111**1****)(1111**1****)(11) | 12 |
| F4 | (11***1****)(11***1****)(11***) | 8 |
Table 3 groups F3 and S1,1 into one category because both are full sensitive to reads with one SNP and one color error. However, S1,1 achieves higher weight than F3 weight by taking advantage of SNP's signature in color space. The introduction of positional restriction at one mismatch at the SNP locus significantly reduces the number of combinations of three mismatches, leading to the higher seed weight. Similarly, S2,0 and F4 are both full sensitive to two SNPs, but S2,0 provides an increase of four (12 to 8) in seed weight. Thus, the design of seeds specifically for the color space will provide a significant advantage in mapping speed.
3.2 Theoretical performance of periodic spaced seeds
Table 4 further compares the F-seed family, the S-seed family and the conventional Ck seed method described in Section 1. Our comparison is based on the most common implementation where the human genome is preprocessed and 34-color SOLiD reads are divided into k + 2 fragments for mapping.
Table 4.
Three seed families are compared in their ability to map 34-color SOLiD reads to a preprocessed human genome
| Seed name | No. of index tables | No. of queries per read | Seed weight | Extended weights | E(Random Hits) per read |
|---|---|---|---|---|---|
| F2 | 1 | 7 | 16 | 16–20 | 1.89 |
| C2 | 3 | 6 | 16 | 8.38 | |
| S1,1 | 1 | 10 | 14 | 14–19 | 68.91 |
| F3 | 1 | 11 | 12 | 12–16 | 627.25 |
| C3 | 4 | 10 | 12 | 3576.28 | |
| S2,0 | 1 | 11 | 12 | 12–16 | 534.42 |
| C4 | 5 | 15 | 10 | 85.830 | |
| F4 | 1 | 10 | 8 | 8–11 | 216.007 |
An index table is, by definition, an array of N index for a genome of N base pairs. Thus, C2 requires three index tables as shown in Figure 1.
3.2.1 Memory requirements
As shown in Table 4, PerM's use of a single seed results in the requirement of a single index table to preprocess the human genome no matter the sensitivity requirement, compared with three to five index tables for the conventional method Ck. The use of single periodic spaced seeds allows us to preprocess the human genome efficiently into 4.5 bytes per base, and load it to 14 GB of memory, without the swapping of index tables between disk and memory.
3.2.2 Running time
The total running time of a mapping project can be divided into two major components:
Preprocessing: the time to preprocess the reference genome (or the reads set) into one or more index tables.
Mapping: the total time to find matches in the index tables for all queried subsequences, and the time to examine all matches using the full read-genome substring alignments.
PerM's requirement of a single index table results in faster preprocessing time than methods which use the conventional multi-seed, multi-table approach. Mapping time consists of two parts: the time to query each seed-induced subsequence and to validate matches which result in true alignments, and the time to examine and ignore matches that result from random hits. The former is fixed as the number of true alignments is constant given a particular sensitivity level, while the latter is related directly to the seed weight. Ideally, mapping time is largely spent on the matching and validation of true alignments, but if the seed weight is insufficient, the examination of random hits will dominate the running time. As listed in last column of Table 4, the expected number of random hits per read can grow so large that most of the running time is wasted on filtering out the random hits. For example, using F3 on the human genome will require the examination of approximately 627 random hits per read which will result in drastically slower performance than the F2 which is expected to examine fewer than two random hits per read. Thus, the number of random hits is the most important indicator of the actual running time. Table 4 shows that the weight increase associated with extended variable-weight periodic spaced seeds will result in a large reduction in random hits and significantly faster running times. As expected, this increased efficiency is greatest for the Sx,k family, when we compare S2,0 with C4, we expect 161 times fewer random hits for the periodic seed.
3.3 Experimental results
We performed genome-scale comparison with two popular mapping programs, MAQ (version 0.6.6; Li et al., 2008) and Bowtie (version 0.10.0; Langmead et al. 2009). Both Illumina and SOLiD reads from The 1000 Genomes Project were used for mapping the human genome. We also compared PerM with SOCS, a mapping program designed specifically for ABI SOLiD reads.
3.3.1 Genome-scale mapping with SOLiD reads
We mapped 5 million 35-color SOLiD reads (the first 5 million reads in the NCBI dataset ERR000455 are available on our web site) to the whole human genome. Overall, we were able to map 58% of the reads (2.94 M) with five or fewer mismatches. Over 78% of the mapped reads included at least one mismatch and 22% of the mapped reads have four or five mismatches in their best alignment to the reference, indicative of a high machine error rate. Considering that each SNP causes consecutive mismatches, it is likely that the majority of reads which cover SNP loci will contain at least three color mismatches. Thus, the detection of genomic variation with SOLiD reads requires far greater sensitivity than necessary for Illumina data. For this reason, PerM offers the seed S1,1 to maximize seed weight while still maintaining full sensitivity to reads which contain one SNP and a color error. For each seed, Table 5 lists the discovery rate for alignments containing five or fewer mismatches. The small difference in the discovery rates of S1,1 and F3 provides further reason to use S1,1 for SOLiD data.
Table 5.
The results of mapping 5 million 34-color SOLiD reads to the whole human genome
| Seed name | Mapped reads |
Unique SNP-supporting reads |
|||
|---|---|---|---|---|---|
| 3 mis | 4 mis | 5 mis | Mis Threshold | Read count | |
| F2 | 298 898 | 167 048 | 117 964 | ≤ 3 colors | 74 877 |
| S1,1 | 465 460 | 348 416 | 257 281 | ≤ 3 colors | 98 325 |
| F3 | 496 401 | 379 936 | 283 971 | ≤ 3 colors | 98 325 |
All PerM seeds provide a minimum of full sensitivity to two mismatches and report 637 681 exact matches, and 583 363 and 561 029 reads with one and two mismatches, respectively.
MAQ does not provide an alignment option which adheres to the definition of full sensitivity to greater than two mismatches. Instead, MAQ aligns SOLiD reads by finding hits using a seed similar to C2 (shown in Fig. 1), and checks each for the possibility of a feasible base-color alignment. It should be noted that each SOLiD read includes thirty-five colors preceded by the base of the primer used to synthesize the read. Thus, the first color represents the transition from the primer (which is not part of the reference) to the first base on the reference, leaving only thirty four colors which represent transitions on the reference. MAQ's current implementation uses only these thirty four colors for alignment. Unfortunately, each thirty-four color read could be the result of four different base strings, depending on the first base synthesized in the read. PerM uses the primer-color transition to infer the identity of this base and includes an extra check to insure that the first base in the reference matches the first base on the read.
Table 6 compares the mapping efficiency of MAQ and PerM at different sensitivity thresholds. In general, PerM offers faster running time for SOLiD reads than MAQ. In addition, PerM is able to offer full sensitivity to more than two mismatches.
Table 6.
Running time comparison of mapping the 35 bp SOLiD reads to the whole human genome
| Program | Seed/mode | weight | (Full) Sensitivity | Speed (M/h) |
|---|---|---|---|---|
| PerM | F2 | 16–20 | 2 colors | 3.53 |
| PerM | S1,1 | 14–19 | 1 base + 1 color | 1.17 |
| PerM | F3 | 12–16 | 3 colors | 0.75 |
| MAQ | -c | 14 | 2 colors | 0.56 |
Genome-scale mapping with Illumina reads
We mapped 9.9 million Illumina reads from whole human genome shotgun fragments (NCBI dataset SRR001154) to the whole human genome with full sensitivity to two and three mismatches. The reads, originally of length 47 bp were also trimmed down to 40 bp and 36 bp to provide a better comparison with MAQ and Bowtie. After trimming, 71.5%, 62.7% and 36.7% of the 36 bp, 40 bp and 47 bp reads, respectively, could be mapped within four mismatches to the genome with our F3 seed. MAQ which only offers full sensitivity to two mismatches was compared with the seed F2. Bowtie was run in its default mode which outputs the first alignment encountered with two or fewer mismatches as well as conditions which are most similar to offering full sensitivity to two and three mismatches, ‘-v 2 -a –best – strata’ and ‘-v 3 -a –best – strata’. These modes were compared with the seeds F2 and F3.
Table 7 compares the performance for mapping different length Illumina reads with sensitivity to two or three mismatches. For the popular task of mapping 36 bp reads with full sensitivity to two mismatches, PerM runs approximately 12 times faster than MAQ. Bowtie outperforms PerM when three mismatches are allowed for 36 bp reads. However, as read lengths grow longer, PerM significantly outperforms Bowtie and MAQ for sensitivity to both two and three mismatches. It should be noted also that Bowtie's default mode is faster than PerM's F2 seed for read length 36. This advantage results from Bowtie's requirement to find and output only a single alignment in the default mode.
Table 7.
Running time comparison of mapping the Illumina reads with different read lengths and seeds to the whole human genome
| Length | 36 bp |
40 bp |
47 bp |
|||
|---|---|---|---|---|---|---|
| Weight | Reads/h | Weight | Reads/h | Weight | Reads/h | |
| Seed | ||||||
| F2 | 18–21 | 5.92 M | 20–24 | 8.01 M | 24–28 | 20.1 M |
| MAQ | 14 | 0.49 M | 14 | 0.55 M | 14 | 0.67 M |
| Bowtie -v2* | 4.43 M | 3.87 M | 2.64 M | |||
| F3 | 13–18 | 1.69 M | 15–19 | 2.21 M | 18–23 | 3.27 M |
| Bowtie -v3* | 4.28 M | 3.38 M | 1.63 M | |||
| Bowtie default | 9.27 M | 7.95 M | 7.20 M | |||
The default mode of Bowtie is equivalent to -k 1. The -v k mode is set with -a –best – strata. The tests are performed on Sun, X4600, Opteron, 2.6 GHz, using 15 GB single node and thread.
3.3.2 Comparison: PerM and MAQ
As shown in Tables 6 and 7, PerM is able to map both SOLiD and Solexa reads significantly faster than MAQ while offering greater levels of full sensitivity. The differences in performance are a testament to the benefit of extendable periodic spaced seeds which provide greater seed weights than the fixed length consecutive seeds implemented in MAQ. This increase in seed weight allows PerM to avoid the bottleneck which results from the many random hits present on a large genome. It should also be noted that MAQ preprocesses reads, requiring it to build an index table for each mapping project while PerM can reuse the same index because it preprocesses the genome.
3.3.3 Comparison: PerM and Bowtie
Although PerM and Bowtie both index the genome, PerM finds full sensitive alignments through seed subsequence matching while Bowtie uses a modified exact matching algorithm and quality-aware backtracking to report alignments. As shown in Table 7, Bowtie's performance slows down when aligning long reads because of the increase in backtracking steps required to find inexact alignments. PerM's performance is primarily a result of it's seed weight, which is maximized for any read length or sensitivity level. As shown in Table 7, long reads allow PerM's extended seeds to significantly speed up mapping.
3.3.4 Comparison: PerM with SOCS
PerM was compared with a program dedicated to SOLiD reads, SOCS (version 1.2.1). Both PerM and SOCS provide full sensitivity to three mismatches, but SOCS does not provide sufficient seed weight to map reads to the entire genome. For this reason, we mapped the 5 million 35 bp SOLiD reads used in 3.3.1 to chromosome X. Eight percent of the reads included a mapping to chromosome with three of fewer substitutions. Table 8 lists the mapping times for different sensitivity levels. PerM's faster running time in comparison to SOCS is primarily the result of much higher seed weight.
Table 8.
Comparing of PerM and SOCS in chromosome-level reference
| Full sensitivity | PerM |
SOCS |
||
|---|---|---|---|---|
| Running time | Weight | Running time | Weight | |
| 2 color mis | 11 min 46 s | 16–20 | 14 min 30 s | 11 |
| 1 base + 1 color mis | 23 min 0 s | 14–19 | ||
| 3 color mis | 32 min 41 s | 12–16 | 2 h 20 min | 8 |
The running time includes preprocessing and I/O. The memory usage of both the programs is <2 GB. The tests are performed on Sun, X4600, Opteron, 2.6 GHz, using single node and thread.
3.3.5 Genome preprocessing
Genome preprocessing time is linear with respect to the size of the reference regardless of the seed used. PerM requires 3 h 30 min to index the whole human genome to 14 GB of memory. In comparison, Bowtie requires 4 h 47 min to build a compressed 2.7 GB human genome index. However, for large-genome resequencing projects, preprocessing time is negligible in comparison with mapping time. Once the genome has been preprocessed, its index can be shared and reused by multiple processors to map different read sets. Both PerM and Bowtie use multiple cores in one computer to map read sets in parallel by querying the same genome index table in the shared memory. Thus, on a server with shared memory architecture, PerM is more memory efficient in terms of ‘memory per CPU’ compared with MAQ, despite a 14 GB index table.
4 DISCUSSION
PerM provides highly efficient mapping solutions for genome-scale mapping projects involving Illumina or SOLiD data. PerM owes its performance primarily to the use of single periodic spaced seeds which are capable of providing sufficient weight and sensitivity to significantly increase genome-scale mapping performance in comparison with other mapping programs.
However, for applications that require full sensitivity to many mismatches (k ≥ 4) on a short read, single periodic seeds may prove incapable of providing efficient mapping performance. In this situation, the costly step of hashing to multiple index tables may be necessary to increase seed weight and eliminate a bottleneck in the checking step. Already a topic of much interest (Li et al., 2004; Nicolas and Rivals, 2008; Noé and Kucherov, 2004; Sun and Buhler, 2005; Yang et al., 2004), Ma and Yao, (2008) showed that the optimization of multiple seeds cannot be easier than the Golomb Ruler Design problem, considered likely to be NP-hard. Thus, although we cannot guarantee optimality over the entire search space, we propose three methods to design high weight multiple seeds: a constrained exhaustive search, a reduction to the integer programming problem and a ‘tuples-grouping’ algorithm. These methods and additional performance analysis and experiments are discussed in detail in the Supplementary Material.
Supplementary Material
ACKNOWLEDGEMENTS
The authors would like to thank Dr Zhenyu Xuan and Dr Richard McCombie from the Genome Center of Cold Spring Harbor Laboratory and Dr Andrew Smith at USC for providing us with data and helpful suggestions. We would also like to thank Zheng Zhang from ABI as well as graduate students Dazhe Meng and Zach Frazier from USC for their helpful discussion.
Funding: National Institutes of Health Center of Excellence in Genomic Sciences.
Conflict of Interest: none declared.
REFERENCES
- Altschul SF, et al. Basic local alignment search tool. J. Mol. Biol. 1990;215:403–410. doi: 10.1016/S0022-2836(05)80360-2. [DOI] [PubMed] [Google Scholar]
- Applied Biosystems. Principles of di-base sequencing and the advantage of color space analysis in the solid system. World Wide Web electronic publication; 2008a. Available at http://marketing.appliedbiosystems.com/images/ Product_Microsites/Solid_Knowledge_MS/pdf/SOLiD_Dibase _Sequencing_and_Color_Space_Analysis.pdf. [Google Scholar]
- Applied Biosystems. Principles of di-base sequencing and the advantage of color space analysis in the solid system. World Wide Web electronic publication; 2008b. Available at http://marketing.appliedbiosystems.com/images/ Product_Microsites/Solid_Knowledge_MS/pdf/SOLiD_Dibase_Sequencing_and _Color_Space_Analysis.pdf. [Google Scholar]
- Applied Biosystems. SOLiDTM system application documentation: Ab resequencing analysis pipeline (corona lite). World Wide Web electronic publication; 2008c. Available at http://solidsoftwaretools.com/gf/project/corona/ [Google Scholar]
- Bennett S. Solexa ltd. Pharmacogenomics. 2004;5:433–438. doi: 10.1517/14622416.5.4.433. [DOI] [PubMed] [Google Scholar]
- Buhler J, et al. Journal of Computer and System Sciences. FL, USA: ACM Press; 2003. Designing seeds for similarity search in genomic DNA; pp. 67–75. [Google Scholar]
- Burkhardt S, Karkkainen J. Proceedings of the 12th Symposium on Combinatorial Pattern Matching (CPM'01). Israel: 2001. Better filtering with gapped q-grams. [Google Scholar]
- Campagna D, et al. Pass: a program to align short sequences. Bioinformatics. 2009;25:967–968. doi: 10.1093/bioinformatics/btp087. [DOI] [PubMed] [Google Scholar]
- Eaves HL, Gao Y. MOM: maximum oligonucleotide mapping. Bioinformatics. 2009;25:969–970. doi: 10.1093/bioinformatics/btp092. [DOI] [PubMed] [Google Scholar]
- Jiang H, Wong WH. SeqMap: mapping massive amount of oligonucleotides to the genome. Bioinformatics. 2008;24:2395–2396. doi: 10.1093/bioinformatics/btn429. [DOI] [PMC free article] [PubMed] [Google Scholar]
- Kent WJ. BLAT–the BLAST-like alignment tool. Genome Res. 2002;12:656–664. doi: 10.1101/gr.229202. [DOI] [PMC free article] [PubMed] [Google Scholar]
- Kim YJ, et al. ProbeMatch: rapid alignment of oligonucleotides to genome allowing both gaps and mismatches. Bioinformatics. 2009;25:1424–1425. doi: 10.1093/bioinformatics/btp178. [DOI] [PMC free article] [PubMed] [Google Scholar]
- Kucherov G, et al. Multiseed lossless filtration. IEEE/ACM Trans. Comput. Biol. Bioinform. 2005;2:51–61. doi: 10.1109/TCBB.2005.12. [DOI] [PubMed] [Google Scholar]
- Langmead B, et al. Genome Biol. Vol. 10. World Wide Web electronic publication; 2009. Ultrafast and memory-efficient alignment of short DNA sequences to the human genome. [DOI] [PMC free article] [PubMed] [Google Scholar]
- Li H, Durbin R. Fast and accurate short read alignment with Burrows-Wheeler transform. Bioinformatics. 2009;25:1754–1760. doi: 10.1093/bioinformatics/btp324. [DOI] [PMC free article] [PubMed] [Google Scholar]
- Lin H, et al. Zoom! zillions of oligos mapped. Bioinformatics. 2008;24:2431–2437. doi: 10.1093/bioinformatics/btn416. [DOI] [PMC free article] [PubMed] [Google Scholar]
- Li H, et al. Mapping short DNA sequencing reads and calling variants using mapping quality scores. Genome Res. 2008;18:1851–1858. doi: 10.1101/gr.078212.108. [DOI] [PMC free article] [PubMed] [Google Scholar]
- Li M, et al. PatternHunter II: highly sensitive and fast homology search. J. Bioinform. Comput. Biol. 2004;2:417–439. doi: 10.1142/s0219720004000661. [DOI] [PubMed] [Google Scholar]
- Li R, et al. SOAP: short oligonucleotide alignment program. Bioinformatics. 2008;24:713–714. doi: 10.1093/bioinformatics/btn025. [DOI] [PubMed] [Google Scholar]
- Ma B, Yao H. Seed optimization is no easier than optimal Golomb ruler design. Asia Pacific Bioinformatics Conference (APBC). 2008 Available at http://sunflower.kuicr.kyoto-u.ac.jp/apbc2008/acceptpaper.htmlpaper 19. [Google Scholar]
- Ma B, et al. PatternHunter: faster and more sensitive homology search. Bioinformatics. 2002;18:440–445. doi: 10.1093/bioinformatics/18.3.440. [DOI] [PubMed] [Google Scholar]
- Malaysian Genomics Resource Center. SXOligoSearch. World Wide Web electronic publication; 2009. Available at http://synasite.mgrc.com.my:8080/sxog/NewSXOligoSearch.php. [Google Scholar]
- Mardis ER. ChIP-seq: welcome to the new frontier. Nat. Methods. 2007;4:613–614. doi: 10.1038/nmeth0807-613. [DOI] [PubMed] [Google Scholar]
- Marioni JC, et al. RNA-seq: an assessment of technical reproducibility and comparison with gene expression arrays. Genome Res. 2008;18:1509–1517. doi: 10.1101/gr.079558.108. [DOI] [PMC free article] [PubMed] [Google Scholar]
- Myers G. A fast bit-vector algorithm for approximate string matching based on dynamic programming. J. ACM. 1999;46:395–415. [Google Scholar]
- Nicolas F, Rivals E. Hardness of optimal spaced seed design. J. Comput. Syst. Sci. 2008;74:831–849. [Google Scholar]
- Noé L, Kucherov G. Improved hit criteria for DNA local alignment. BMC Bioinformatics. 2004;5:149–149. doi: 10.1186/1471-2105-5-149. [DOI] [PMC free article] [PubMed] [Google Scholar]
- Ondov BD, et al. Efficient mapping of applied biosystems solid sequence data to a reference genome for functional genomic applications. Bioinformatics. 2008;24:2776–2777. doi: 10.1093/bioinformatics/btn512. [DOI] [PMC free article] [PubMed] [Google Scholar]
- Quinlan AR, et al. Pyrobayes: an improved base caller for SNP discovery in pyrosequences. Nat. Methods. 2008;5:179–181. doi: 10.1038/nmeth.1172. [DOI] [PubMed] [Google Scholar]
- Ronaghi M, et al. A sequencing method based on real-time pyrophosphate. Science. 1998;281:363–363. doi: 10.1126/science.281.5375.363. [DOI] [PubMed] [Google Scholar]
- Rumble SM, et al. SHRiMP: accurate mapping of short color-space reads. PLoS Comput. Biol. 2009;5:e1000386. doi: 10.1371/journal.pcbi.1000386. [DOI] [PMC free article] [PubMed] [Google Scholar]
- Shendure J, Ji H. Next-generation DNA sequencing. Nat. Biotechnol. 2008;26:1135–1145. doi: 10.1038/nbt1486. [DOI] [PubMed] [Google Scholar]
- Smith AD, et al. Using quality scores and longer reads improves accuracy of Solexa read mapping. BMC Bioinformatics. 2008;9:128–128. doi: 10.1186/1471-2105-9-128. [DOI] [PMC free article] [PubMed] [Google Scholar]
- Sun Y, Buhler J. Designing multiple simultaneous seeds for DNA similarity search. J. Comput. Biol. 2005;12:847–861. doi: 10.1089/cmb.2005.12.847. [DOI] [PubMed] [Google Scholar]
- The MarthLab. Mosaik. World Wide Web electronic publication; 2009. [Google Scholar]
- Xu J, et al. Optimizing multiple spaced seeds for homology search. J. Comput. Biol. 2006;13:1355–1368. doi: 10.1089/cmb.2006.13.1355. [DOI] [PubMed] [Google Scholar]
- Yang I-H, et al. BIBE '04: Proceedings of the 4th IEEE Symposium on Bioinformatics and Bioengineering. Washington, DC: IEEE Computer Society; 2004. Efficient methods for generating optimal single and multiple spaced seeds; p. 411. [Google Scholar]
Associated Data
This section collects any data citations, data availability statements, or supplementary materials included in this article.